Objectives : The aim of this study was to estimate potential savings to EU economy due to return to work of disabled cancer survivors.
Methods : Data on indirect cost of cancer related disability were calculated based on Luengo-Fernandez et al. (2013) study and own estimation. Presenteeism and absenteeism in cancer survivors were adopted from our previously published studies.
Results : We estimated the indirect cost of cancer due to disability in EU at the amount of 4223.2 million EUR. Partial disability accounts for 20-25% of this sum. The efficacy of rehabilitation programs, loss of productivity due to absenteeism and presenteeism in cancer survivors reduce potential savings for EU economy due to return to work of cancer survivors to the amount of 231.36-289.20 million EUR.
Conclusion : Indirect cost of cancer related disability can be reduced, but probably only to a small extent. Well-being due to the return to work of cancer-survivors rather than economic aspects should be our primary targets for further researches.
cancer survivors, disability, indirect cost
World Health Organization estimates cancer to be one of the most aggravating diseases in terms of DALYs (disability adjusted life-years) lost, comprising for 8.2% of all DALYs lost due to health problems in the world [1]. In Europe, cancer burden is even more pronounced and comprises 15.4% of all DALYs lost due to health problems and being second after cardiovascular diseases leading cause of DALYs lost [1]. Thus, not surprisingly cancer is recognized not only as a clinical but also social and economic problem. Luengo-Fernandez et al. (2013) estimated economic burden of cancer in European Union (EU) at 126 billion EUR [2]. The National Institutes of Health estimated overall costs of cancer in the United States (US) in 2010 at 263.8 billion USD [3]. American Cancer Society based on DALYs lost to cancers globally in 2008 estimated economic burden of cancer at 895 billion USD, which constituted 1.5% of the world gross domestic product (GDP) [4]. It should be emphasized that both European and United States estimation showed that not only direct but also indirect cost of cancer have a substantial effect on the economy. The indirect costs are defined as the expenses incurred from the cessation or reduction of work productivity as a result of the morbidity and mortality associated with a given disease [5]. Indirect costs typically consist of absenteeism (i.e. temporary absence from work due to sickness or permanent absence from work due to incapacity or disability or premature death) and presenteeism (i.e. costs of lost productivity due to illness while working) [6]. The National Institute of Health estimates 161 billion USD i.e. 61% of reported previously overall costs of cancer in the United States are indirect costs, with 20.9 billion USD for indirect morbidity costs (cost of lost productivity due to illness) and 140.1 billion USD for indirect mortality costs (cost of lost productivity due to premature death) [3]. The indirect cost of cancer estimated by Luengo-Fernandez et al. (2013) amounted to approx. 52 billion EUR, with 9.4 billion EUR for indirect morbidity costs and 42.6 billion EUR for indirect mortality costs and constitutes 1.07% of the EU GDP [2].
It is not surprising most of lost productivity costs are related to premature death due to cancer. According to the World Health Organization, cancer-related mortality accounted for 15.2% of all deaths worldwide in 2015 and this value is predicted to increase to 18.0 by 2030 [7]. Nevertheless, the number of cancer survivors in Europe is significant and was estimated at approx. 2% of total population in 2002 - i.e. over EU 10 million inhabitants live with cancer [8]. Moreover, the number of cancer survivors is growing due to improvement in diagnosis and treatment – e.g. in United States cancer survivors comprise approximately 4 % of the total population [9]. Although cancer is recognized as an aging-associated disease, still almost half of cancer survivors are at working age. The growing number of new cases of cancer, improvement in diagnosis and cancer treatment and trends to extend the retirement age leads to an increase of the number of cancer survivors at working-age. A direct consequence of such phenomena is the problem of returning to work after cancer, important for both: cancer patients and the society. It has been estimated that cancer survivors were more likely to be unemployed than healthy control participants [10]. It can be assumed that many of cancer survivors do not return to work due to disability. Although real-world data (e.g. Polish Social Insurance Institution report on effectiveness of rehabilitation in breast cancer patients) showed up to 54% of disabled may return to work after comprehensive rehabilitation programs, still it should be underlined, that cancer-related disability is usually more severe compared to disability due to other diseases [11,12]. Moreover, in numerous cases, presenteeism has been shown to be a far more important financial problem than disease-related absenteeism [13]. Goetzel et al. (2004) estimate presenteeism accounts for an average 53% of total expenditures on cancer in US (except for mortality costs) [13]. Although not to such extent, estimated indirect costs associated with the presenteeism in Poland are significant and comparable to cost of lost productivity due to disability or sickness absence [14,15]. Thus, it can be presumed that cancer generates significant presenteeism, which cannot be omitted while estimating economic burden of cancer.
Although most of lost productivity costs is related to premature death due to cancer, absenteeism cost related to disability cannot be omitted, especially when talking about potential savings for economy triggered by cancer survivors returning to work. On the other hand, several constraints should be taken into account on such estimations, e.g. ability to undergo rehabilitation and its effectiveness, presenteeism and absenteeism in those who returned to work, the need for vocational retraining and at last but not at least patients’ preferences (willingness to return to work). The aim of this paper was to roughly estimate potential savings for EU economy triggered by disabled cancer survivors returning to work.
We used Luengo-Fernandez et al. (2013) study data on indirect costs related to cancer morbidity and our estimation of a contribution of disability to indirect costs related to morbidity in Poland to calculate indirect costs of cancer-related disability [2,15]. We assumed that population with complete disability or inability of independent existence cannot return to work and thus partially disabled cancer survivors are the only target population for comprehensive rehabilitation programs. Due to lack of access to data from other EU countries we assumed that disability structure i.e. percentage of a partially disabled cancer survivors are similar to those observed in Poland [11]. Data on disability (the number of medical certificates awarded because of incapacity for work or independent existence) due to cancer and other diseases were retrieved from the Social Insurance Institution’s annual report [16]. Data included a number of medical certificates issued for the first time and a number of certificates reissued, their periods of validity, age of population and severity of disability (complete or partial inability to work, inability of independent existence).
We assumed that effectiveness of comprehensive rehabilitation programs is similar to those observed in other disease and up to 54% of partially disabled cancer survivors will return to work after rehabilitation (Polish Social Insurance Institution observations on effectiveness of rehabilitation) [12]. Finally, we adjusted estimation for previously published data on presenteeism and absenteeism in cancer survivors [11].
As, to the best of our knowledge, cost of presenteeism resulting from cancer in Europe have never been studied, we performed survey in a population of about 300 economically active patients (score 80 or above on Karnofsky performance scale) with cancer to estimate presenteeism cost of cancer in Poland. To obtain possibly close to representative sample, direct survey of randomly selected oncology patients was planned. The survey was performed by professional agency (TNS Poland) at 10 regional oncology centres covering over 70% of total oncology services in Poland. The inclusion criteria were as follows: economically active, currently employed patients with cancer during therapy or on remission observation lasting less than 5 years. Employed persons where defined as persons who during the forgone week (week before the questionnaire completion) performed for at least 1 day any work providing earnings or income. People who formally were employed but did not perform it during the forgone week (e.g., due to illness, vacation, a break in company activity, etc.) were excluded from the study. The survey included collection of basic demographic and employment data. To assess the impact of health on productivity a modified questionnaire WPAI-SHP was used [17]. Due to the considerable heterogeneity of the study group and given the limited number of respondents we have refrained from collecting data on clinical characteristics of the disease. Human capital approach was used to estimate both presenteeism and absenteeism [18]. We analyzed the differences in productivity loss in relation to gender, age, educational level and employment by sector of ownership.
Hypothesis testing for low-count samples with a non-normal distribution was conducted using non-parametric tests (Kruskal-Wallis test). The analysis of samples with N ≥ 30 or a normal distribution was conducted using the Student’s t-test or ANOVA. All tests were two-sided and p=0.05 was considered statistically significant. Correlations were estimated using the Spearman correlation coefficient (R). All statistical calculations were conducted using StatSoft, Inc. (2011). STATISTICA, version 12. Tulsa, Oklahoma, USA and Microsoft Office Excel 2010.
Economic activity of cancer survivors in Poland
Cancer was the second (after cardiovascular diseases) cause of medical certificates issued for the first time because of incapacity for work or independent existence and accounted for 22% of all certificates issued for the first time – see (Figure 1a). However, the number of certificates reissued was significantly lower – cancer accounted for 7% of all certificates reissued – see (Figure 1b). Significant differences in the structure of severity of disability exist. A significantly higher proportion of cancer patients were judged as either incapable of independent existence (19.9%-24.9% compared to 4.4%-6.5% in overall population) or completely incapable to work (45.9%-71.1% compared to 23.4%-32.9% in overall population) – see (Figure 2a and 2b). Overall disability structure analysis in Polish cancer survivors showed less than 25% of them were the target population for comprehensive rehabilitation programs – see (Figure 3).
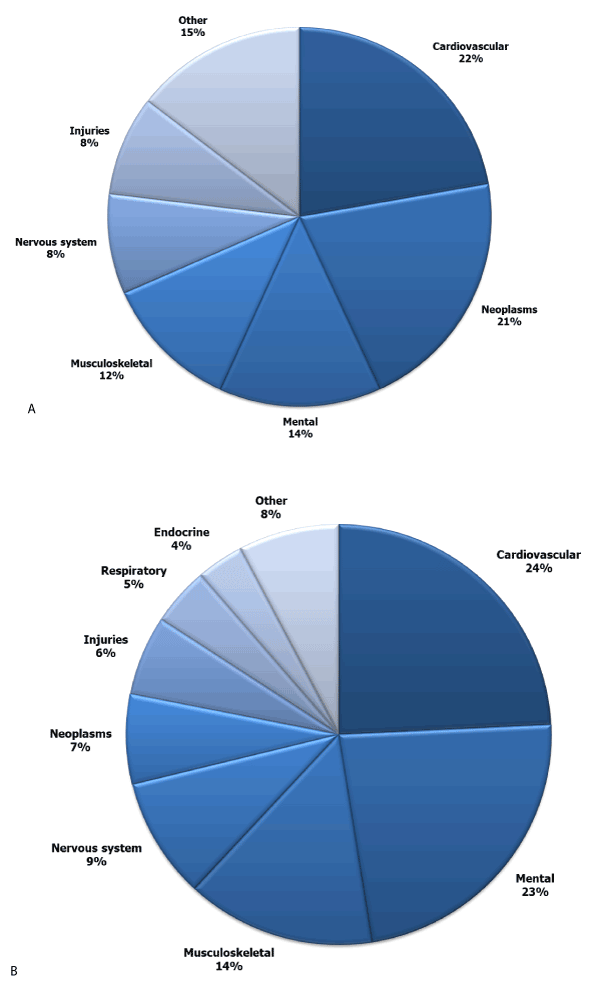
Figure 1 a,b. Contribution of medical certificates
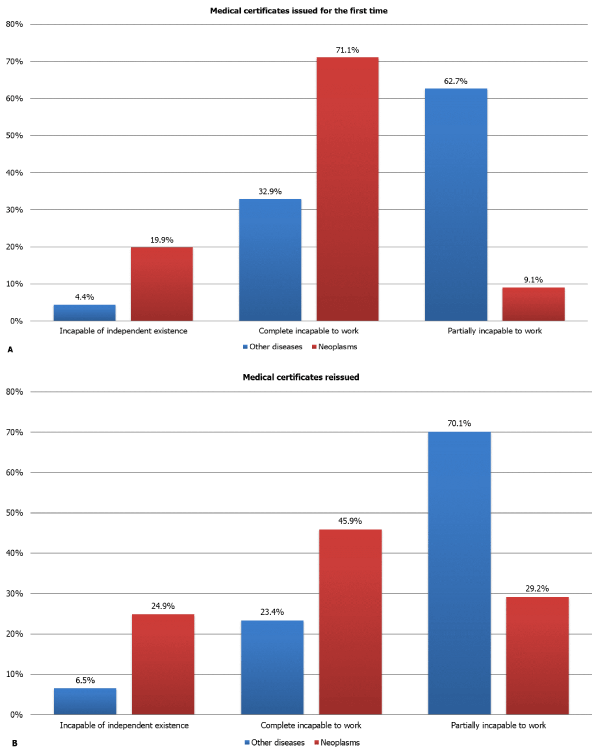
Figure 2 a,b. Severity structure of disability due to cancer
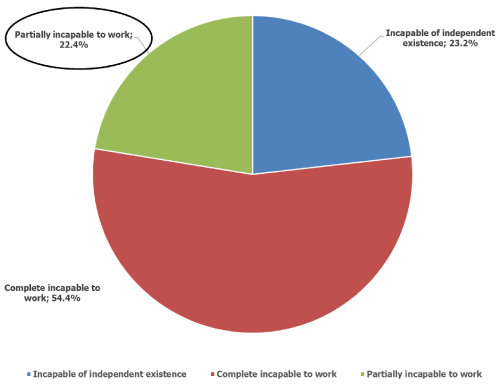
Figure 3. Disability structure in Polish cancer survivors
Presenteeism and absenteeism in economically active cancer survivors
On August 2011 population of 300 persons were questioned directly. Of them 299 (99.7%) met inclusion criteria and completed WPAI-SHP questionnaire properly. The mean age of surveyed patients was 50.0 ± 9.1 years and the average declared weekly work time was 40.4 ± 9.6 hours. Most respondents were employed in private sector and prevailed persons with post-secondary and secondary educational level. Demographics of included population are presented in Table 1.
Table 1. Demographics of included economically active cancer survivors in presenteeism study
Male; [n (%)] |
149 (49.8%) |
Age (years); [mean (SD)] |
50.0 (9.1) |
Age by category; [n (%)] |
|
|
8 (2.7%) |
|
|
24 (8.0%) |
|
|
106 (35.5%) |
|
|
114 (38.1%) |
|
|
47 (15.7%) |
Average weekly work time (hours); [mean (SD)] |
40.4 (9,6) |
Employment by ownership; [n (%)] |
|
|
90 (30.1%) |
|
|
206 (68.9%) |
|
|
3 (1.0%) |
Educational level; [n (%)] |
- primary and lower secondary
|
34 (11.4%) |
- post-secondary and secondary
|
183 (61.2%) |
|
|
68 (22.7%) |
|
|
11 (3.7%) |
|
|
3 (1.0%) |
The average time of the absence from work due to cancer in the study population was 19.1% ± 22.7% of weekly work time, corresponding to 8.2 ± 10.6 hours of work lost. The estimated average loss of productivity in the workplace was 37.3% ± 29.0%, corresponding to 11.1 ± 9.3 loss of hours of work. Statistically significant (Kruskal-Wallis test) difference in both absenteeism and presenteeism was observed in the analysis of variance in relation to the level of education – see Table 2. Spearman rank correlation analysis showed significant, a weak negative correlation between both absenteeism or presenteeism and level of education - R Spearman correlation coefficient -0,167 and -0.221 respectively. The analysis also showed that male patients have a significantly higher relative absenteeism rate compared to female patients (p=0.046). Differences were statically insignificant in relation to other analyzed subgroups – see Table 2.
Table 2. Comparative statistics for absenteeism and presenteeism in the population of cancer survivors
Grouping variable |
N |
Mean (SD) |
p-value |
Absenteeism |
Educational level |
- primary and lower secondary
|
34 |
22.2% (22.3%) |
0.014** |
|
|
11 |
42.0% (37.7%) |
|
- post-secondary and secondary
|
183 |
18.9% (21.6%) |
|
|
|
68 |
14.4% (21.4%) |
|
Sex |
|
149 |
21.7% (24.3%) |
0.046* |
|
|
150 |
16.5% (20.8%) |
|
Employment by ownership |
|
206 |
20.5% (23.4%) |
0.103* |
|
|
90 |
15.8% (21.2%) |
|
Age |
|
8 |
15.3% (17.8%) |
0.895** |
|
|
24 |
17.4% (17.2%) |
|
|
|
106 |
17.9% (22.9%) |
|
|
|
114 |
20.0% (23.1%) |
|
|
|
47 |
21.1% (25.0%) |
|
Presenteeism |
Educational level |
- primary and lower secondary
|
34 |
47.1% (33.0%) |
<0.001** |
|
|
11 |
67.3% (34.4%) |
|
- post-secondary and secondary
|
183 |
37.0% (27.4%) |
|
|
|
68 |
27.6% (25.2%) |
|
Sex |
|
149 |
39.5% (30.1%) |
0.177* |
|
|
150 |
35.0% (27.7%) |
|
Employment by ownership |
|
206 |
36.8% (27.8%) |
0.611* |
|
|
90 |
38.7% (31.8%) |
|
Age |
|
8 |
30.0% (31.2%) |
0.840** |
|
|
24 |
38.3% (23.9%) |
|
|
|
106 |
35.4% (27.3%) |
|
|
|
114 |
39.2% (31.3%) |
|
|
|
47 |
37.4% (29.3%) |
|
* Student’s t-test
** Kruskal-Wallis test
Savings for EU economy triggered by disabled cancer survivors returning to work
Based on Luengo-Fernandez et al. (2013) and our own estimation of a contribution of disability to indirect cost related to morbidity in Poland (44.8%), we estimated the indirect cost of cancer incurred by disability in EU at the amount of 4223.2 million EUR – see (Table 3) [2,15]. As only 20-25% of disabled cancer survivors are partially disabled (see Figure 3) potential savings are reduced to the amount of 844.6–1055.8 million EUR (Table 3). Potential efficacy of rehabilitation programs (up to 54% according to Polish Social Insurance Institution report on the effectiveness of rehabilitation), reduces these savings to 456.11-570.14 million EUR (Table 3). The loss of productivity triggered by sickness absence and presenteeism measured in cancer survivors’ population (19.1% and 37.3% respectively) reduces the potential savings for EU economy due to return to work of cancer survivors with a disability to the amount of 231.36-289.20 million EUR (Table 3).
Table 3. Potential savings (million EUR) for EU economy triggered by disabled cancer survivors returning to work
Country |
Indirect morbidity cost based
on Luengo-Fernandez et al. |
Indirect cost of disability |
Indirect cost of disability in
target population i.e.
partially disabled |
Potential savings in target population |
corrected with efficacy of
rehabilitation programs |
corrected with sickness absence |
corrected with presenteeism |
Austria |
136 |
60.89 |
12.18-15.22 |
6.58-8.22 |
5.32-6.65 |
3.34-4.17 |
Belgium |
604 |
270.44 |
54.09-67.61 |
29.21-36.51 |
23.63-29.54 |
14.82-18.52 |
Bulgaria |
26 |
11.64 |
2.33-2.91 |
1.26-1.57 |
1.02-1.27 |
0.64-0.8 |
Cyprus |
5 |
2.24 |
0.45-0.56 |
0.24-0.3 |
0.2-0.24 |
0.12-0.15 |
Czech Republic |
166 |
74.33 |
14.87-18.58 |
8.03-10.03 |
6.49-8.12 |
4.07-5.09 |
Denmark |
380 |
170.15 |
34.03-42.54 |
18.38-22.97 |
14.87-18.58 |
9.32-11.65 |
Estonia |
34 |
15.22 |
3.04-3.81 |
1.64-2.06 |
1.33-1.66 |
0.83-1.04 |
Finland |
77 |
34.48 |
6.9-8.62 |
3.72-4.65 |
3.01-3.77 |
1.89-2.36 |
France |
2299 |
1029.39 |
205.88-257.35 |
111.17-138.97 |
89.94-112.42 |
56.39-70.49 |
Germany |
2213 |
990.88 |
198.18-247.72 |
107.02-133.77 |
86.58-108.22 |
54.28-67.85 |
Greece |
86 |
38.51 |
7.7-9.63 |
4.16-5.2 |
3.36-4.21 |
2.11-2.64 |
Hungary |
48 |
21.49 |
4.3-5.37 |
2.32-2.9 |
1.88-2.35 |
1.18-1.47 |
Ireland |
63 |
28.21 |
5.64-7.05 |
3.05-3.81 |
2.46-3.08 |
1.55-1.93 |
Italy |
143 |
64.03 |
12.81-16.01 |
6.92-8.64 |
5.59-6.99 |
3.51-4.38 |
Latvia |
20 |
8.96 |
1.79-2.24 |
0.97-1.21 |
0.78-0.98 |
0.49-0.61 |
Lithuania |
40 |
17.91 |
3.58-4.48 |
1.93-2.42 |
1.56-1.96 |
0.98-1.23 |
Luxembourg |
18 |
8.06 |
1.61-2.01 |
0.87-1.09 |
0.7-0.88 |
0.44-0.55 |
Malta |
1 |
0.45 |
0.09-0.11 |
0.05-0.06 |
0.04-0.05 |
0.02-0.03 |
Netherlands |
706 |
316.11 |
63.22-79.03 |
34.14-42.68 |
27.62-34.52 |
17.32-21.65 |
Poland |
386 |
172.83 |
34.57-43.21 |
18.67-23.33 |
15.1-18.88 |
9.47-11.84 |
Portugal |
98 |
43.88 |
8.78-10.97 |
4.74-5.92 |
3.83-4.79 |
2.4-3 |
Romania |
81 |
36.27 |
7.25-9.07 |
3.92-4.9 |
3.17-3.96 |
1.99-2.48 |
Slovakia |
88 |
39.40 |
7.88-9.85 |
4.26-5.32 |
3.44-4.3 |
2.16-2.7 |
Slovenia |
72 |
32.24 |
6.45-8.06 |
3.48-4.35 |
2.82-3.52 |
1.77-2.21 |
Spain |
482 |
215.82 |
43.16-53.95 |
23.31-29.14 |
18.86-23.57 |
11.82-14.78 |
Sweden |
478 |
214.03 |
42.81-53.51 |
23.11-28.89 |
18.7-23.37 |
11.72-14.66 |
UK |
682 |
305.37 |
61.07-76.34 |
32.98-41.22 |
26.68-33.35 |
16.73-20.91 |
Total for EU |
9432 |
4223.22 |
844.64-1055.81 |
456.11-570.14 |
368.99-461.24 |
231.36-289.2 |
To the best of our knowledge, the potential savings for EU economy triggered by disabled cancer survivors returning to work have never been analyzed previously. Although our estimates are encumbered with several important limitations, including: i) lack of country-specific data on disability caused by cancer; ii) uncertainty of indirect cost estimation; iii) cancer-specific data on the effectiveness of rehabilitation (breast cancer) and iv) uncertainty of presenteeism and absenteeism estimations in cancer survivors, we would like to stress that it was not our intention to show exact values but rather we intended to show the impact of quantifiable factors on estimated indirect cost of cancer-related disability. Most of the limitations described above can be solved with country-specific data, but it should be noted that even when this data would be available, still the most important limitation, which in our opinion is an uncertainty of indirect cost estimation, would greatly bias the final result of this analysis. For example, we have previously estimated the total indirect costs of cancer-related absenteeism in the Polish workplace in 2009 to be 2.612 billion EUR while Luengo-Fernandez et al. (2013) based on same sources estimated indirect costs of cancer-related absenteeism to be 1.692 billion EUR [2,15]. This may not be unexpected as Luengo-Fernandez et al. (2013) used friction cost approach to estimate indirect costs, while our estimation was based on human capital approach [18,19]. Nevertheless, we would expect these differences to be much more pronounced since recent publication on the indirect cost of cancer estimated based on friction cost approach reported indirect cost to be much lower than those estimated based on human capital approach [20]. Moreover, if we use Rijo et al. (2008) methodology to estimate the indirect cost of cancer-related absenteeism, we will end with much higher numbers (17.924 billion EUR – our not published estimation) [4]. Although, it should be emphasized that based on this methodology the indirect cost of disability caused by cancer will constitute only 2.5% of total indirect cost (447.42 million EUR, i.e. value that is very close to our estimations), since years of life lost (YLL) is the dominant component of DALY in cancer. Thus, we believe that exact estimation of potential savings for EU economy triggered by disabled cancer survivors returning to work will be always greatly biased with methodology of indirect cost estimations. Nevertheless, several important factors i.e. patient’s motivation, need for vocational re-training and potential reduction in productivity that may further reduce estimated savings, were not analyzed. Altogether we might have overestimated potential savings for EU economy triggered by cancer survivors return to work.
The analysis showed that the loss of productivity associated with the presenteeism among cancer patients has important implications for the EU economy although less pronounced than costs of absenteeism in the workplace. Although comprehensive rehabilitation programs may reduce disability of cancer patients and promote the return to work, indirect cost of cancer-related to disability can be reduced only to a small extent. We conclude well-being due to the return to work of cancer-survivors rather than economic aspects should be our primary targets for further researches.
The author (TM) is responsible for the reported research, the concept and design, analysis and interpretation of data, drafting or revising of the manuscript.
I acknowledge the Professor Tomasz Hermanowski (grant no. N N405 115034 leader) for support this project
Source of financial support: Ministry of Science and Higher Education grant no. N N405 115034
Role of the funding source: Publication of the study results was not contingent upon the sponsor’s approval.
None to declare.
- World Health Organization. Health statistics and information systems. Global Health Estimates for the years 2000–2012.
- Luengo-Fernandez R, Leal J, Gray A, Sullivan R (2013) Economic burden of cancer across the European Union: a population-based cost analysis. Lancet Oncol 14: 1165-1174.
- American Cancer Society (2011) Cancer Facts & Figures 2011. Atlanta: American Cancer Society.
- Rijo M John, Hana Ross (2008) Economic value of disability-adjusted life years lost to cancers.
- Hodgson TA, Meiners MR (1982) Cost-of-illness methodology: a guide to current practices and procedures. Milbank Mem Fund Q Health Soc 60: 429-462. [Crossref]
- Johns G (2010) Presenteeism in the workplace: A review and research agenda. J Organiz Behav 31: 519-542.
- World Health Organization. Projections of mortality and causes of death 2015 and 2030.
- Capocaccia R, Colonna M, Corazziari I, De Angelis R, Francisci S, et al. (2002) EUROPREVAL Working Group. Measuring cancer prevalence in Europe: the EUROPREVAL project. Ann Oncol 13: 831-839. [Crossref]
- de Moor JS, Mariotto AB, Parry C, Alfano CM, Padgett L, et al. (2013) Cancer survivors in the United States: prevalence across the survivorship trajectory and implications for care. Cancer Epidemiol Biomarkers Prev 22: 561-570. [Crossref]
- de Boer AG, Taskila T, Ojajärvi A, Frank JH, Jos HAM (2009) Cancer survivors and unemployment: a meta-analysis and meta-regression. JAMA 301: 753-762.
- Macioch T, Hermanowski T (2013) Economic activity of cancer survivors in Poland. Value Health 16: A417-A418.
- Nietopiel M (2016) 20 years of medical rehabilitation as part of ZUS disability prevention. Prevention and Rehabilitation 2: 3-13.
- Goetzel RZ, Long SR, Ozminkowski RJ, Hawkins K, Wang S, et al. (2004) Health, absence, disability, and presenteeism cost estimates of certain physical and mental health conditions affecting U.S. employers. J Occup Environ Med 46: 398-412.
- Macioch T, Hermanowski T (2012) Cost of presenteeism due to cancer in Poland. Value Health 15: A432.
- Macioch T, Hermanowski T (2011) The indirect costs of cancer-related absenteeism in the workplace in Poland. J Occup Environ Med 53: 1472-1477.
- Social Security (2010) Decisions of doctors of the Social Insurance Institution (ZUS) regarding incapacity for work issued in 2009 Warsaw.
- Reilly MC, Zbrozek AS, Dukes EM (1993) The validity and reproducibility of a work productivity and activity impairment instrument. PharmacoEconomics 4: 353-365.
- Liljas B (1998) How to calculate indirect costs in economic evaluations. Pharmacoeconomics 13: 1-7. [Crossref]
- Koopmanschap MA, Rutten FF, van Ineveld BM, van Roijen L (1995) The friction cost method for measuring indirect costs of disease. J Health Econ 14:171-189.
- Hanly P, Timmons A, Walsh PM, Sharp L (2012) Breast and prostate cancer productivity costs: a comparison of the human capital approach and the friction cost approach. Value Health 15: 429-436.