A careful prospective pharmaco-epidemiological study on diabetic patients using WHO prescribing, patient care and facility indicator was carried out in southern Punjab, Multan, Pakistan. The prescribing, patient care and facility indicators were evaluated using WHO indicator form. The results showed that average drug prescribed per patient has maximum value of 9 which indicates the trend of poly-pharmacy. The percentage of generic prescribing was very low which indicates that there is lot of trend of doctors to be influenced by the companies and prefer to prescribe the brand names, which cause health burden on poor peoples. The percentage of antibiotic prescribed was very high in most of the health care facilities and antibiotic was prescribed in 100% patients in Nishter hospital. The percentage of injection prescribed was also very high and close to 100% at most of the facilities except for PSSHMC hospital Muzafargarh, where trend was 76.7%. Injections are costly dosage form and cause health burden to the patients. The trend of prescribing from Essential drug list of Pakistan was checked and it was observed that none of the hospital has 100% prescribing from NEDL. The consultation time varies at different hospital and it was 1.6 min at Tehsil level hospitals which shows that physician spend very little time in counseling the patients. The average dispensing time varies from 50 seconds to 238 seconds it shows that the health care facilities do not follow similar trend there is need to establish similar protocol and standard operating procedure for dispensaries. The percentage of drug dispensed was 100% at only two facilities, which indicate that remaining 18 facilities need to rationalize their system of dispensing and availability of stock. The adequate knowledge of patient was very poor and there is need of proper counseling to the patients.
In summary, prescribing trend do not follow the international standards and there is a grave need to incorporate the role of pharmacist to monitor and check the trend of poly-pharmacy and drug interactions.
epidemiology, prescribing indicators, patient care indicators, facility indicators, diabetes, southern punjab region
Diabetes is a public health problem and its incidence is increasing day by day. It is important to evaluate the prescribing trend of health facilities regarding diabetic patients [1,2]. The study was conducted among diabetic patients who met the patient’s inclusion criteria devised for the study [3]. The main study objective was to assess and evaluate the pattern and practice of physicians among diabetic patients by using standard WHO prescribing indicator forms [4], and to judge the patient’s behavior by using WHO patients care indicator forms and to judge the quality of health care facility by using WHO facility indicator forms. The trend of prescribing from Essential drug list of Pakistan was checked and it was observed that none of the hospital has 100% prescribing from NEDL. As NEDL of Pakistan was published in 2003 and many useful safe salts and therapeutic goods are being readily used, need is felt the revising of NEDL. The adequate knowledge of patient was very poor and there is need of proper counseling to the patients. There was not only a single facility where proper labeling of medicine was carried out [5,6]. The facility indicators were evaluated by using WHO facility indicator form. The availability of EDL was almost at 70% of the hospitals [7]. The availability of key drugs was 100% only at one facility. As diabetes is a major health problem so, key drugs should be available at most of the health center at all the times.
Sample size
A prospective study was carried out among diabetic patients to assess the prescribing, patient care and facility indicators in southern Punjab Pakistan. Sample size taken from each health facility was thirty hence data of total 600 patients was collected from twenty different health care centers of Southern Punjab.
Survey methodology
The study was conducted using WHO prescribing, patient care and facility indicator forms. Patients were enrolled in the study after taking informed consent.
Prescribing indictor
form was filled by checking the prescriptions of diabetic patients from twenty different health care facilities. At least 30 patients were considered from each facility. Forms were designed according to WHO standards and were approved by the research committee. Prescriptions were carefully noted on the forms including generic as well as brand names and dosage used.
Patient care indicators
were checked by interviewing the patients. Consultation time of each patient was noted carefully and dispensing time at the pharmacy was noted for the outpatients and inpatients. Numbers of drugs prescribed by the physician were noted by viewing the prescriptions and numbers of drugs actually dispensed were noted by visiting the pharmacy at the time of dispensing for outpatient and by visiting patients’ charts for indoor patients.
Facility indicator
form was developed by using standard WHO criteria. Full name of facility and its location was noted in the form. Availability of copy of EDL and key drugs were checked for each facility. A list of major key drugs for the diabetic patients was made and was approved by the research committee and then this list was checked at each facility.
Inclusion criteria
- People suffering from Diabetes Mellitus were included in the study.
- Patient of age above 18 years was included in the study.
- Patient who was visiting at least the secondary care hospital was included in the study.
- Patient who willingly provided data was included in the study.
- Patients of southern Punjab were included in the study.
Exclusion criteria
- Patients of age less than eighteen years were excluded from the study.
- Patients suffering from life threatening co-morbidity were excluded from the study.
- Patients who were not willing to provide the data were also excluded from the study.
Experimental data source
The data for the research was collected from Tehsil Head Quarter Hospitals and District Head Quarter Hospitals in the southern Punjab, Pakistan. Data was also taken from social security hospital, Tayyeb Erdgan Hospital Muzafargarh and Nishter hospital Multan. Data was collected after taking permission from the research committees of the hospitals under study. 20 different health care centers were included in the study. Data was directly taken from the patients.
Period of data collection
The study period was six months from April 2014 to September 2014. In these six months’ data was collected from twenty different health centers of southern Punjab, Pakistan.
Statistical analysis
Software SPSS 16 was used to analyze the results statistically. Non -parametric test was applied for general parameters and chi square test and descriptive statistics was applied at 0.05 significant level. Data collected from different centers was also graphically analyzed and compared to evaluate the WHO core indicators of prescribing, patient care and health facility [8].
Prescribing indicators
The data was collected from twenty different health care facilities from southern Punjab and prescribing indicators were evaluated for each facility and results are described as:
The average drugs per encounter were calculated for all the health care facility to find out the occurrence of poly-pharmacy. Poly-pharmacy is a major issue in our health care system that leads to a number of different drug interactions and prolong stay of patients in the hospital. The results show that the maximum poly pharmacy trend was in Nishter hospital Multan and least was in DHQ hospital Bhakkar and average encounter /patients in all health care facilities was 6.89, which shows that there is a trend of poly-pharmacy in southern Punjab hospital and there should be a role of pharmacist in monitoring the drug interaction and minimizing the trend of poly-pharmacy [8-10].
The data in the figure 1 (Table 1) reveals that the number of drugs prescribed in thirty patients at different health care facilities is the highest in Nishtar Hospital Multan which is a teaching hospital and the patients from different areas of southern Punjab which already has been exposed to the drugs, patients of critical nature are referred to this facility [11,12].
The numbers of drugs prescribed by their generic names were checked at different health care facilities included in the study. The results indicate that there is very low trend of generic prescribing in the hospital, except for social security hospital Muzafargarh where there is 100% trend of generic prescribing. At DHQ hospital muzafargarh only 4.4% of drugs were prescribed by their generic names (Figure 2, Table 2).
The numbers of drugs prescribed by their generic names were checked at different health care facilities included in the study [13,14] (Figure 3, Table 3). The results indicate that there is very low trend of generic prescribing in the hospital, except for social security hospital Muzafargarh where there is 100% trend of generic prescribing.
The numbers of antibiotics prescribed to the patients at twenty different health care facilities were checked by the prescriptions of patients. The results indicate that the maximum trend of antibiotic prescription was at Nishter hospital Multan and almost all the prescriptions contained the antibiotics. The least trend of antibiotic prescribing was at DHQ Vehari where nearly 63.3% patients were prescribed by the antibiotics (Figure 4, Table 4).
The numbers of patients prescribed with injections were calculated at different health care facilities and it was found that the trend of injection prescribed was 100% at most of the health centers. It shows the excessive use of injectable dosage form which is a costly dosage form and lead to the health burden to the patient as well as on the hospital (Figure 5, Table 5).
Essential drug list of Pakistan is formulated after a through feedback and taking into consideration the health care needs of the patients. The trend of prescribing from EDL was checked to assess that how much the prescriber takes the EDL into consideration. The results show that maximum trend of drugs prescribed from EDL was at DHQ Layyah that is 92% and minimum prescribing from EDL was at Nishter hospital Multan (Figure 6, Table 6,12).
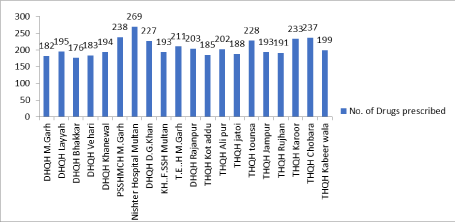
Figure 1.Number of drugs prescribed in different facilities
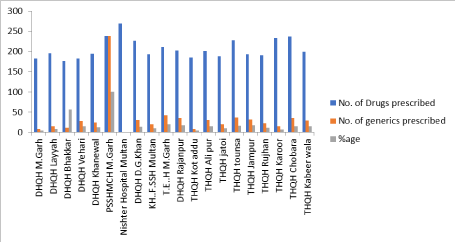
Figure 2.Number of drug/encounter in different facilities
The figure depicts the average number of drugs per encounter at different health care facilities. The average drugs per encounter are maximum 9 at Nishter hospital Multan
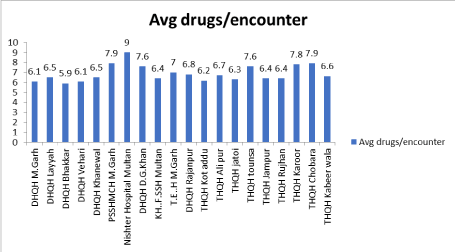
Figure 3. Comparison of drugs prescribed and generic prescribed
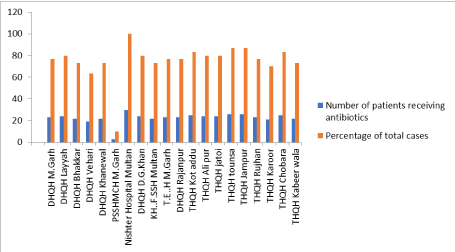
Figure 4. Patients receiving antibiotics
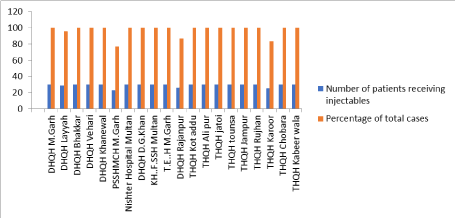
Figure 5. Patients receiving injectable
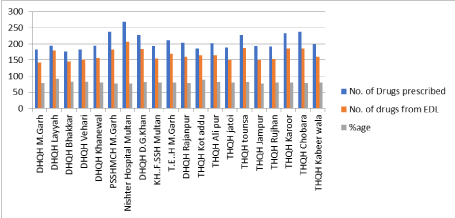
Figure 6. Number of drugs prescribed from EDL
Table 1 Number of drugs prescribed /patient in facilities under study
Name of facility |
No. of Drugs prescribed |
Avg. drugs/encounter |
DHQH M.Garh |
182 |
6.1 |
DHQH Layyah |
195 |
6.5 |
DHQH Bhakkar |
176 |
5.9 |
DHQH Vehari |
183 |
6.1 |
DHQH Khanewal |
194 |
6.5 |
PSSHMCH M.Garh |
238 |
7.9 |
Nishter Hospital Multan |
269 |
9.0 |
DHQH D.G.Khan |
227 |
7.6 |
KH..F.SSH Multan |
193 |
6.4 |
T.E..H M.Garh |
211 |
7.0 |
DHQH Rajanpur |
203 |
6.8 |
THQH Kot addu |
185 |
6.2 |
THQH Ali pur |
202 |
6.7 |
THQH jatoi |
188 |
6.3 |
THQH tounsa |
228 |
7.6 |
THQH Jampur |
193 |
6.4 |
THQH Rujhan |
191 |
6.4 |
THQH Karoor |
233 |
7.8 |
THQH Chobara |
237 |
7.9 |
THQH Kabeer wala |
199 |
6.6 |
Table 2. Number of generics prescribed in different facility
Name of facility |
No. of Drugs prescribed |
No. of generics prescribed |
Percentage |
DHQH M.Garh |
182 |
8 |
4.4 |
DHQH Layyah |
195 |
15 |
7.69 |
DHQH Bhakkar |
176 |
11 |
56.3 |
DHQH Vehari |
183 |
28 |
15.3 |
DHQH Khanewal |
194 |
24 |
12.4 |
PSSHMCH M.Garh |
238 |
238 |
100 |
Nishter Hospital Multan |
269 |
0 |
0 |
DHQH D.G.Khan |
227 |
30 |
13.2 |
KH.F.SSH Multan |
193 |
20 |
10.4 |
T.E..H M.Garh |
211 |
42 |
19.9 |
DHQH Rajanpur |
203 |
35 |
17.2 |
THQH Kot addu |
185 |
8 |
4.3 |
THQH Ali pur |
202 |
30 |
14.9 |
THQH jatoi |
188 |
19 |
10.1 |
THQH tounsa |
228 |
36 |
15.8 |
THQH Jampur |
193 |
32 |
16.6 |
THQH Rujhan |
191 |
22 |
11.5 |
THQH Karoor |
233 |
15 |
6.4 |
THQH Chobara |
237 |
35 |
14.8 |
THQH Kabeer wala |
199 |
29 |
14.6 |
Table 3. Percentage of patients receiving antibiotics in different facilities
Name of facility |
Number of patients receiving antibiotics |
Percentage of total cases |
DHQH M.Garh |
23 |
76.7 |
DHQH Layyah |
24 |
80 |
DHQH Bhakkar |
22 |
73.3 |
DHQH Vehari |
19 |
63.3 |
DHQH Khanewal |
22 |
73.3 |
PSSHMCH M.Garh |
3 |
10 |
Nishter Hospital Multan |
30 |
100 |
DHQH D.G.Khan |
24 |
80 |
KH..F.SSH Multan |
22 |
73.3 |
T.E..H M.Garh |
23 |
76.7 |
DHQH Rajanpur |
23 |
76.7 |
THQH Kot addu |
25 |
83.3 |
THQH Ali pur |
24 |
80 |
THQH jatoi |
24 |
80 |
THQH tounsa |
26 |
86.7 |
THQH Jampur |
26 |
86.7 |
THQH Rujhan |
23 |
76.7 |
THQH Karoor |
21 |
70 |
THQH Chobara |
25 |
83.3 |
THQH Kabeer wala |
22 |
73.3 |
Table 4. Percentage of patients receiving injectable in different facilities
Name of facility |
Number of patients receiving injectable |
Percentage of total cases |
DHQH M.Garh |
30 |
100 |
DHQH Layyah |
29 |
96 |
DHQH Bhakkar |
30 |
100 |
DHQH Vehari |
30 |
100 |
DHQH Khanewal |
30 |
100 |
PSSHMCH M.Garh |
23 |
76.7 |
Nishter Hospital Multan |
30 |
100 |
DHQH D.G.Khan |
30 |
100 |
KH.F.SSH Multan |
30 |
100 |
T.E..H M.Garh |
30 |
100 |
DHQH Rajanpur |
26 |
86.7 |
THQH Kot addu |
30 |
100 |
THQH Ali pur |
30 |
100 |
THQH jatoi |
30 |
100 |
THQH tounsa |
30 |
100 |
THQH Jampur |
30 |
100 |
THQH Rujhan |
30 |
100 |
THQH Karoor |
25 |
83.3 |
THQH Chobara |
30 |
100 |
THQH Kabeer wala |
30 |
100 |
Table 5. Percentage of patients receiving injectable in different facilities
Name of facility |
Number of patients receiving injectable |
Percentage of total cases |
DHQH M.Garh |
30 |
100 |
DHQH Layyah |
29 |
96 |
DHQH Bhakkar |
30 |
100 |
DHQH Vehari |
30 |
100 |
DHQH Khanewal |
30 |
100 |
PSSHMCH M.Garh |
23 |
76.7 |
Nishter Hospital Multan |
30 |
100 |
DHQH D.G.Khan |
30 |
100 |
KH.F.SSH Multan |
30 |
100 |
T.E..H M.Garh |
30 |
100 |
DHQH Rajanpur |
26 |
86.7 |
THQH Kot addu |
30 |
100 |
THQH Ali pur |
30 |
100 |
THQH jatoi |
30 |
100 |
THQH tounsa |
30 |
100 |
THQH Jampur |
30 |
100 |
THQH Rujhan |
30 |
100 |
THQH Karoor |
25 |
83.3 |
THQH Chobara |
30 |
100 |
THQH Kabeer wala |
30 |
100 |
Table 6. Number of drugs prescribed from EDL at different health care facilities
Name of facility |
Number of Drugs prescribed |
Number of drugs from EDL |
Percentage |
DHQH M.Garh |
182 |
142 |
78 |
DHQH Layyah |
195 |
180 |
92 |
DHQH Bhakkar |
176 |
146 |
83 |
DHQH Vehari |
183 |
151 |
82.5 |
DHQH Khanewal |
194 |
156 |
80.4 |
PSSHMCH M.Garh |
238 |
182 |
76.5 |
Nishter Hospital Multan |
269 |
206 |
76.6 |
DHQH D.G.Khan |
227 |
184 |
81.1 |
KH.F.SSH Multan |
193 |
155 |
80.3 |
T.E..H M.Garh |
211 |
169 |
80.1 |
DHQH Rajanpur |
203 |
160 |
78.8 |
THQH Kot addu |
185 |
165 |
89.2 |
THQH Ali pur |
202 |
165 |
81.7 |
THQH jatoi |
188 |
150 |
79.8 |
THQH tounsa |
228 |
187 |
82 |
THQH Jampur |
193 |
150 |
77.7 |
THQH Rujhan |
191 |
153 |
80.1 |
THQH Karoor |
233 |
185 |
79.4 |
THQH Chobara |
237 |
185 |
78.1 |
THQH Kabeer wala |
199 |
160 |
80.4 |
Table 12. Availability of copy of EDL at different facilities
|
Name of facility |
Availability of copy of EDL |
|
DHQH M.Garh |
Yes |
|
DHQH Layyah |
Yes |
|
DHQH Bhakkar |
Yes |
|
DHQH Vehari |
Yes |
|
DHQH Khanewal |
Yes |
|
PSSHMCH M.Garh |
NO |
|
Nishter Hospital Multan |
Yes |
|
DHQH D.G.Khan |
Yes |
|
KH..F.SSH Multan |
No |
|
T.E..H M.Garh |
Yes |
|
DHQH Rajanpur |
Yes |
|
THQH Kot addu |
Yes |
|
THQH Ali pur |
NO |
|
THQH jatoi |
NO |
|
THQH tounsa |
NO |
|
THQH Jampur |
Yes |
|
THQH Rujhan |
NO |
|
THQH Karoor |
Yes |
|
THQH Chobara |
No |
|
THQH Kabeer wala |
Yes |
|
Total |
Yes=23
No=7 |
The consultation time of patients was recorded at different health care centers in the southern Punjab. The results indicate that the average consultation time of physicians vary greatly at different health care centers. The consultation time was maximum at Tayyab Erdagen hospital Muzafargarh which is Turkish based hospital. The minimum average consultation time was at THQ chobara, which means that doctors spend very little time with patients at tehsil headquarters (Figure 7, Table 7).
The dispensing time at different health care facilities was calculated and it was concluded that maximum dispensing time was 238sec at social security hospital and minimum was at THQH chobara (Figure 8, Table 8).
The number of drugs dispensed out of total drugs prescribed was calculated at different health care facilities. It was concluded in the study that maximum % age of dispensed drugs was at Tayyab erdagan hospital muzafargarh and PSSHMCH Muzaffargarh where the rate was 100% which show the good stock position at these two hospitals and efficiency of dispensing staff at these hospitals (Figure 9, Table 9).
The number of drugs adequately labeled was almost zero at all the health care centers in southern Punjab which results in poor compliance of patients. It is due to absence of adequate pharmacist at health care centers which leads to poor compliance (Figure 10, Table 10).
The knowledge of patients about correct doses was checked at different health care centers and it was concluded that the patient’s knowledge was very poor because of poor literacy rate in these areas. Poor knowledge leads to poor compliance of medication regimen [15,16] (Figure 11,12, Table 11).
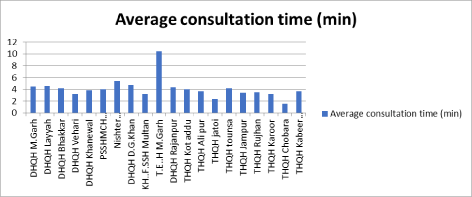
Figure 7. Average consultation time at different facilities
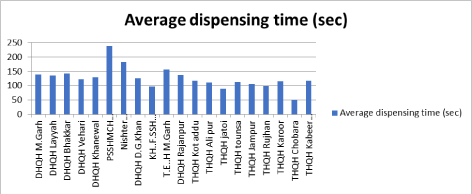
Figure 8. Average dispensing time at different facilities
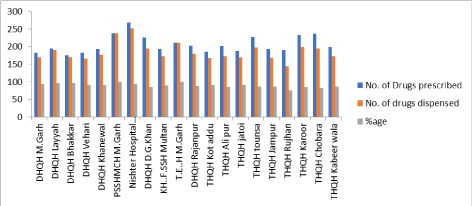
Figure 9. Number of drugs dispensed
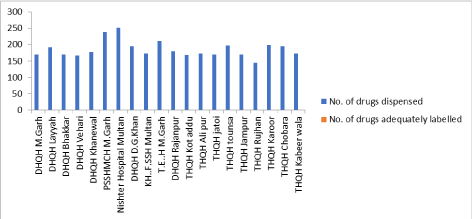
Figure 10. Number of drugs adequately labeled
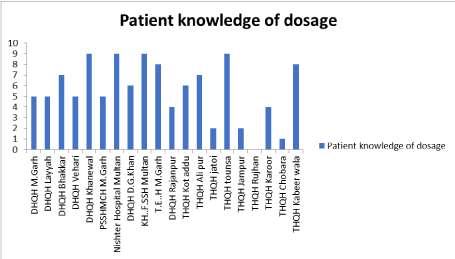
Figure 11. Patients knowledge of doses at different facilities
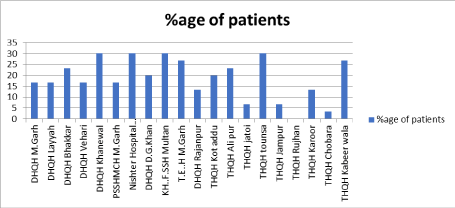
Figure 12. Percentage of patients having adequate knowledge about doses
Table 7. Average consultation time of different facilities
Name of facility |
Total consultation time (min) |
Average consultation time (min) |
DHQH M.Garh |
135 |
4.5 |
|
DHQH Layyah |
136 |
4.53 |
DHQH Bhakkar |
130 |
4.2 |
DHQH Vehari |
95 |
3.2 |
DHQH Khanewal |
113 |
3.8 |
PSSHMCH M.Garh |
121 |
4 |
Nishter Hospital Multan |
162 |
5.4 |
DHQH D.G.Khan |
140 |
4.7 |
KH.F.SSH Multan |
96 |
3.2 |
T.E..H M.Garh |
313 |
10.4 |
DHQH Rajanpur |
130 |
4.3 |
THQH Kot addu |
119 |
4 |
THQH Ali pur |
11 |
3.7 |
THQH jatoi |
72 |
2.4 |
THQH tounsa |
127 |
4.2 |
THQH Jampur |
101 |
3.4 |
THQH Rujhan |
105 |
3.5 |
THQH Karoor |
97 |
3.2 |
THQH Chobara |
47 |
1.6 |
|
THQH Kabeer wala |
112 |
3.7 |
Table 8. Average dispensing time of different facilities
Name of facility |
Total dispensing time (sec) |
Average dispensing time (sec) |
DHQH M.Garh |
4170 |
139 |
|
DHQH Layyah |
4060 |
135.3 |
DHQH Bhakkar |
4260 |
142 |
DHQH Vehari |
3680 |
122.7 |
DHQH Khanewal |
3870 |
129 |
PSSHMCH M.Garh |
2745 |
238 |
Nishter Hospital Multan |
5460 |
182 |
DHQH D.G.Khan |
3780 |
126 |
KH.F.SSH Multan |
2940 |
98 |
T.E..H M.Garh |
4660 |
155.3 |
DHQH Rajanpur |
4140 |
138 |
THQH Kot addu |
3540 |
118 |
THQH Ali pur |
3320 |
110.7 |
THQH jatoi |
2670 |
89 |
THQH tounsa |
3390 |
113 |
THQH Jampur |
3150 |
105 |
THQH Rujhan |
2970 |
99 |
THQH Karoor |
3450 |
115 |
THQH Chobara |
1500 |
50 |
|
THQH Kabeer wala |
3510 |
117 |
Table 9. Number of drugs dispensed at different facilities
Name of facility |
No. of Drugs prescribed |
No. of drugs dispensed |
Percentage |
DHQH M.Garh |
182 |
170 |
93.4 |
DHQH Layyah |
195 |
191 |
97 |
DHQH Bhakkar |
176 |
170 |
96.6 |
DHQH Vehari |
183 |
166 |
90.7 |
DHQH Khanewal |
194 |
177 |
91.2 |
PSSHMCH M.Garh |
238 |
238 |
100 |
Nishter Hospital Multan |
269 |
252 |
93.7 |
DHQH D.G.Khan |
227 |
195 |
85.9 |
KH..F.SSH Multan |
193 |
173 |
89.6 |
T.E..H M.Garh |
211 |
211 |
100 |
DHQH Rajanpur |
203 |
180 |
88.7 |
THQH Kot addu |
185 |
168 |
90.8 |
THQH Ali pur |
202 |
173 |
85.6 |
THQH jatoi |
188 |
170 |
90.4 |
THQH tounsa |
228 |
198 |
86.8 |
THQH Jampur |
193 |
169 |
87.6 |
THQH Rujhan |
191 |
144 |
75.4 |
THQH Karoor |
233 |
199 |
85.4 |
THQH Chobara |
237 |
195 |
82.3 |
THQH Kabeer wala |
199 |
173 |
86.9 |
Table 10. Number of drugs adequately labeled
Name of facility |
No. of drugs dispensed |
No. of drugs adequately labelled |
DHQH M.Garh |
170 |
0 |
DHQH Layyah |
191 |
0 |
DHQH Bhakkar |
170 |
0 |
DHQH Vehari |
166 |
0 |
DHQH Khanewal |
177 |
0 |
PSSHMCH M.Garh |
238 |
0 |
Nishter Hospital Multan |
252 |
0 |
DHQH D.G.Khan |
195 |
0 |
KH.F.SSH Multan |
173 |
0 |
T.E..H M.Garh |
211 |
0 |
DHQH Rajanpur |
180 |
0 |
THQH Kot addu |
168 |
0 |
THQH Ali pur |
173 |
0 |
THQH jatoi |
170 |
0 |
THQH tounsa |
198 |
0 |
THQH Jampur |
169 |
0 |
THQH Rujhan |
144 |
0 |
THQH Karoor |
199 |
0 |
THQH Chobara |
195 |
0 |
THQH Kabeer wala |
173 |
0 |
Table 11. Patients knowledge of dosage at different facilities
Name of facility |
Patient knowledge of dosage |
Percentage of patients |
DHQH M.Garh |
5 |
16.7 |
DHQH Layyah |
5 |
16.7 |
DHQH Bhakkar |
7 |
23.3 |
DHQH Vehari |
5 |
16.7 |
DHQH Khanewal |
9 |
30 |
PSSHMCH M.Garh |
5 |
16.7 |
Nishter Hospital Multan |
9 |
30 |
DHQH D.G.Khan |
6 |
20 |
KH..F.SSH Multan |
9 |
30 |
T.E..H M.Garh |
8 |
26.7 |
DHQH Rajanpur |
4 |
13.3 |
THQH Kot addu |
6 |
20 |
THQH Ali pur |
7 |
23.3 |
THQH jatoi |
2 |
6.7 |
THQH tounsa |
9 |
30 |
THQH Jampur |
2 |
6.7 |
THQH Rujhan |
0 |
0 |
THQH Karoor |
4 |
13.3 |
THQH Chobara |
1 |
3.3 |
THQH Kabeer wala |
8 |
26.7 |
The number of key drugs available at different health care facilities was checked after making a list of key drugs with reference to diabetic patients and the results shows that only one facility has 100% availability of all the key drugs. As the diabetes is more prevalent in Pakistan and its incidence is increasing so it is recommended that the key drugs should be available at the health care center [17,18] (Figure 13, table 13).
The pharmaco-epidemiological study of diabetic patients was carried our using WHO prescribing, patient care and facility indicators [19-22]. The study was carried out in twenty different health care facilities of southern Punjab in different districts. The results of prescribing indicators show that overall there is trend of poly-pharmacy (Table 14). It was concluded that the trend of poly-pharmacy prevails in majority of health care facilities. The results of generic prescribing shows that there is very least trend of generic prescribing except of social security hospital Muzafargarh. The percentage of antibiotics prescribed was evaluated and results indicate that there is excessive trend of antibiotic prescribing in all the health care facilities. The results concluded that in Nishter hospital Multan there is 100% trend of antibiotic prescribing. Similarly, there is excessive trend of injection prescribing in all the health care facilities. The results of patient care prescribing indicate that consultation time varies from 1.6 minutes to 10.4 minutes in the hospitals under study. The dispending time varies from 50 seconds to 238 seconds which is very low and may lead to error in dispensing causing serious threat to the e health of patient. The percentage of drugs dispensed varies from 75.4% to 100% at different hospitals which need to be improved where it was not maximum. The study of facility indicator shows that almost 70% facilities have availability of EDL and only one facility had 100% availability of key Drugs.

Figure 13. Number of key drugs available at different facilities
Table 13. Availability of key drugs at hospital
|
Name of facilitty |
Number of key drugs available |
|
DHQH M.Garh |
3 |
|
DHQH Layyah |
4 |
|
DHQH Bhakkar |
3 |
|
DHQH Vehari |
3 |
Table 14.Consolidated data of drug use indicators at different facilities
Facility |
Avg. drugs prescribed |
Percentage
Generic drugs |
Percentage of Antibiotics |
Percentage of Injections |
Percentage on EDL |
Avg.
Consult time
(min) |
Avg.
Dispense
Time
(sec) |
Percentage of drugs dispensed |
DHQH M.Garh |
6.1 |
4.4 |
76.7 |
100 |
78 |
4.5 |
139 |
93.4 |
DHQH Layyah |
6.5 |
7.69 |
80 |
96 |
92 |
4.53 |
135.3 |
97 |
DHQH Bhakkar |
5.9 |
56.3 |
73.3 |
100 |
83 |
4.2 |
142 |
96.6 |
DHQH Vehari |
6.1 |
15.3 |
63.3 |
100 |
82.5 |
3.2 |
122.7 |
90.7 |
DHQH Khanewal |
6.5 |
12.4 |
73.3 |
100 |
80.4 |
3.8 |
129 |
91.2 |
PSSHMCH M.Garh |
7.9 |
100 |
10 |
76.7 |
76.5 |
4 |
238 |
100 |
NH Multan |
9.0 |
0 |
100 |
100 |
76.6 |
5.4 |
182 |
93.7 |
DHQH D.G.Khan |
7.6 |
13.2 |
80 |
100 |
81.1 |
4.7 |
126 |
85.9 |
KH..F.SSH Multan |
6.4 |
10.4 |
73.3 |
100 |
80.3 |
3.2 |
98 |
89.6 |
T.E..H M.Garh |
7.0 |
19.9 |
76.7 |
100 |
80.1 |
10.4 |
155.3 |
100 |
DHQH Rajanpur |
6.8 |
17.2 |
76.7 |
86.7 |
78.8 |
4.3 |
138 |
88.7 |
THQH Kot addu |
6.2 |
4.3 |
83.3 |
100 |
89.2 |
4 |
118 |
90.8 |
THQH Ali pur |
6.7 |
14.9 |
80 |
100 |
81.7 |
3.7 |
110.7 |
85.6 |
THQH jatoi |
6.3 |
10.1 |
80 |
100 |
79.8 |
2.4 |
89 |
90.4 |
THQH tounsa |
7.6 |
15.8 |
86.7 |
100 |
82 |
4.2 |
113 |
86.8 |
THQH Jampur |
6.4 |
16.6 |
86.7 |
100 |
77.7 |
3.4 |
105 |
87.6 |
THQH Rujhan |
6.4 |
11.5 |
76.7 |
100 |
80.1 |
3.5 |
99 |
75.4 |
THQH Karoor |
7.8 |
6.4 |
70 |
83.3 |
79.4 |
3.2 |
115 |
85.4 |
THQH Chobara |
7.9 |
14.8 |
83.3 |
100 |
78.1 |
1.6 |
50 |
82.3 |
THQH Kaber wala |
6.6 |
14.6 |
73.3 |
100 |
80.4 |
3.7 |
117 |
86.9 |
Mean |
6.89 |
18.29 |
75.17 |
97.14 |
80.89 |
4.1 |
126.1 |
89.9 |
Minimum |
5.9 |
0 |
10 |
76.7 |
76.5 |
1.6 |
50 |
75.4 |
Maximum |
9.0 |
100 |
100 |
100 |
92 |
10.4 |
238 |
100 |
It was concluded from the current study that prescribing trend do not follow the international standards and there is a grave need to incorporate the role of pharmacist to monitor and check the trend of poly-pharmacy and drug interactions. There should be the availability of pharmacist per 50 beds to properly counsel the patient regarding drug usage. Proper labeling of the medicines according to the WHO Standards should be ensured to avoid any mishap and to achieve the goal of effective patient care.
Author declared no conflict of interest
All authors hereby acknowledged all members of Nishter hospital, Multan, Pakistan
Compliance with ethical statement
Informed Consent
The authors declared that they have do this survey under the permission of hospital and letter issued by university 1203/PEC/18.
Contribution of authors
Syed Nisar Hussain Shah: Research Supervisor
Ayaz Ahmad: Doing research survey
Hina Javed: manuscript writing and corresponding author
Qalander Khan: Help in conducting survey
Nida Javed: Assist in manuscript writing
Muhammad Yousuf: Help in data collection
Rabeea Anum: Help in data collection
- Wild S, Roglic G, Green A, Sicree R, King H (2004) Global prevalence of diabetes: estimates for the year 2000 and projections for 2030. Diabetes Care 27: 1047-1053. [Crossref]
- Yutaka Seino, Kishio Nanjo, Naoko Tajima, Takashi Kadowaki, Atsunori Kashiwagi, et al. (2010) Report of the committee on the classification and diagnostic criteria of diabetes mellitus. J Diabetes Investig 1: 212-228. [Crossref]
- Yutaka Seino, Kishio Nanjo, Naoko Tajima, Takashi Kadowaki, Atsunori Kashiwagi, et al. (2010) Report of the committee on the classification and diagnostic criteria of diabetes mellitus. J Diabetes Investig 1: 212-228. [Crossref]
- World Health Organization (2009) Fact Sheet No.312: What is Diabetes? Available at: Http:// www.who.iny/mediacentre/factsheets/fs312/en/
- Dobson, Matthew John F (1776) Experiments and Observations on the Urine in a Diabetes.
- Willett JB, Singer JD, Martin NC (1998) The design and analysis of longitudinal studies of development and psychopathology in context: statistical models and methodological recommendations. Dev Psychopathol 10: 395-426. [Crossref]
- Lipscombe LL, Hux JE (2007) Trends in diabetes prevalence, incidence, and mortality in Ontario, Canada 1995-2005: a population-based study. Lancet 369: 750-756. [Crossref]
- Statistics Canada. 1996-97 (1999) National Population Health Survey: Derived Variable Specifications. Ottawa.
- Tuomilehto J, Virtala E, Karvonen M, Lounamaa R, Pitkäniemi J, et al. (1995) Increase in incidence of insulin-dependent diabetes mellitus among children in Finland. Int J Epidemiol 24: 984-992. [Crossref]
- Elamin A, Altahir H, Ismail B, Tuvemo T (1992) Clinical pattern of childhood type 1 (insulin-dependent) diabetes mellitus in the Sudan. Diabetologia 35: 645-648. [Crossref]
- Nishimura R, LaPorte RE, Dorman JS, Tajima N, Becker D, et al. (2001) Mortality Trends in Type 1 Diabetes: The Allegheny County (Pennsylvania) Registry 1965-1999. Diabetes Care 24: 823-827. [Crossref]
- Rosenbloom AL, Silverstein JH, Amemiya S, Zeitler P, Klingensmith GJ International Society for Pediatric and Adolescent Diabetes (2008) ISPAD Clinical Practice Consensus Guidelines 2006-2007. Type 2 diabetes mellitus in the child and adolescent. Pediatr Diabetes 9: 512-526. [Crossref]
- Bloomgarden ZT (1998) Insulin resistance: current concepts. Clin Ther 20: 216-231. [Crossref]
- Shaw JE, Sicree RA, Zimmet PZ (2010) Global estimates of the prevalence of diabetes for 2010 and 2030. Diabetes Res Clin Pract 87: 4-14. [Crossref]
- Valdés S, Botas P, Delgado E, Alvarez F, Cadórniga FD (2007) Population-based incidence of type 2 diabetes in northern Spain: the Asturias Study. Diabetes Care 30: 2258-2263. [Crossref]
- UK Prospective Diabetes Study Group.Effect of intensive blood glucose control with metformin on complications in overweight patients with type 2 diabetes (UKPDS 34). Lancet 1998; 352: 854-865. [Crossref]
- Knowler WC, Barrett-Connor E, Fowler SE, Hamman RF, Lachin JM, et al. (2002) Reduction in the incidence of type 2 diabetes with lifestyle intervention or metformin. N Engl J Med 346: 393-403. [Crossref]
- [No authors listed] (1998) Intensive blood-glucose control with sulphonylureas or insulin compared with conventional treatment and risk of complications in patients with type 2 diabetes (UKPDS 33). UK Prospective Diabetes Study (UKPDS) Group. Lancet 352: 837-853. [Crossref]
- Chiasson JL, Josse RG, Gomis R, Hanefeld M, Karasik A, et al. (2002) STOP-NIDDM Trial Research Group. Acarbose for prevention of type 2 diabetes mellitus: the STOP-NIDDM randomised trial. Lancet 359: 2072-2077 [Crossref]
- Ulf Bergman (2001) Pharmacoepidemiology – from description to quality assessment A Swedish perspective. Norsk Epidemiologi 11: 31-36.
- Desalegn AA (2013) Assessment of drug use pattern using WHO prescribing indicators at Hawassa University Teaching and Referral Hospital, south Ethiopia: a cross-sectional study. BMC Health Serv Res 13: 170. [Crossref]
- Ola A Akl, Azza AE Mahalli, Ahmed Awad Elkahky, Abdallah Mohamed Salem (2014) WHO/INRUD drug use indicators at primary healthcare centers in Alexandria. Journal of Taibah University Medical Sciences 9: 54-64
- Andressa Tanise Vooss, Helissara Silveira Diefenthaeler (2011) Evaluation of prescription indicators established by the WHO in Getúlio Vargas – RS. Brazilian Journal of Pharmaceutical Sciences 47: 385- 390


