Background: Effective drug supply management ensures uninterrupted availability of quality approved, safe and effective pharmaceuticals. This could be achieved through proper selection, quantification, procurement, distribution and use of drugs based on consumption and morbidity pattern of the catchment area by using a system like ABC-VEN analysis. ABC/VEN analysis used for the investigation represents the simple and effective method of analysis of medicine expenditures, identifying priority groups of medicines, the use of which, when improved, may provide the greatest clinical and economic impact.
Methods: Descriptive, retrospective cross sectional study was conducted using document reviewed from the main central national and state medical supply organizations NMSF and RDF respectively, in addition to hospital based study. All data was analyzed with excel spread sheet to obtain ABC, VEN, and ABC-VEN matrix analysis results of the annual medicine expenditures and to explore the pharmaceutical inventory control management. Awareness about inventory system among pharmacists working in drug supply centers was measured using pretested questionnaires.
Results: The analysis of drugs procured by the NMSF for years (2015-2017) shows that total number of items imported was 584 items, with total value of 1495510147.2 Euro. About 79 (14%) of items consumed 75% of the budget (class A), 100 (17%) items cost 15% (class B), while majority 405 (69%) items only consumed 10% of total medicine expenditure (class C). Among the class A medicines purchased items (Sodium chloride solution 0.9% w/v) 500 ml solution for intravenous infusion ranked first by contributing 5% of total expenditures. The results obtained from RDF for year (2017) shows that the total number of items imported was1134 items, with total value of 242,148,789.5 SDG. About 166 (15%) items consumed 75% of the budget (class A), and 277(24%) items consumed 15% (class B), where majority of items 691 (61%) only consumed 10% of total medicine expenditures (class C). Among the class A items ceftriaxone injection (1 gram) ranked first by contributing 4% of total expenditures and 95% of class A items total expenditure. Hospital based study from ALZYTONA private hospital for 2017 shows that the total number of items purchased was 175 items. With value of (135,695 SDG). The ABC analysis shows that about 66% of the medicines belonged to class A, and 19% (32 items) categorized as class B, The rest of items that is about 15% (27 items) categorized as class C. Among the class A purchased items Innohep 4500mg (Tenzaparin) contributing 4% of total expenditures (5500 SDG) as the highest purchased medication.
Conclusion: The inventory management tools knowledge was found to be poor in fresh graduates and university pharmacists but it was better in some postgraduate pharmacists which leads to the problems in the decision making in purchasing drugs and optimizing cost.
ABC analysis, VEN analysis, medicine expenditure, pharmaceutical inventory
Many countries are facing large increases in their expenditures on pharmaceuticals, a matter that causes concern for policy-makers worldwide. In many countries, especially the low-income country, the high proportion of medicines spending that is paid for out of pocket by individuals, creates a huge financial burden on patients and presents an additional problem for policy-makers. In order to develop effective policies aimed at securing universal access to essential medicines requires a comprehensive understanding of a country’s current expenditures on pharmaceuticals in relation to its level of income and other expenditures The data on total pharmaceutical expenditures are lacking for many low-income countries; it is evident that collectively high-income countries spend a great deal more on medicines than the less wealthy countries. In 2006, high-income countries accounted for 78.5% of global pharmaceutical expenditures, while the upper middle-income, the lower middle-income and the low-income countries combined accounted for the remaining 21.5% of the total (10.2%, 10.3% and 1.0%, respectively). In world’s total expenditures on pharmaceuticals, leaving the poorest 71% of the population distributed among 78 low-middle- and low-income countries with an 11% share of the world’s medicines expenditure [1].
Thus, the need for planning, designing and organizing the pharmacy in a manner that results in efficient clinical and administrative services becomes the most pertinent in low-income countries. Effective drug supply management ensures uninterrupted availability of quality approved, safe and effective pharmaceuticals. This can be achieved through proper selection, quantification, procurement, distribution and use of drugs based on consumption and morbidity pattern of the catchment area by using a system like ABC-VEN analysis [2,3]. On hospital basis the goal of the pharmaceutical supply system is to ensure that sufficient stock of necessary items is maintained and there is a continuous supply all the time. Hospitals should be equipped with all essential, affordable and available medicines and these should be taken care by using efficient inventory pharmaceutical management techniques [4]. There are various tools involved for inventory management but commonly used are: Always, Better, and Control (ABC) and Vital, essential and Non-essential (VEN). Lacking these brings not only a discredit to the hospital but to the whole public health system as well and medicines expenditures should be an issue of concern to hospital management especially pharmacy managers in ensuring high quality health services provision as far as the health of the patients is concerned since most of the time financial resources are limited [5]. ABC/VEN-analysis used for the investigation represents the simple and effective method of analysis of medicine expenditures, identifying priority groups of medicines, the use of which, when improved, may provide the greatest clinical and economic impact. ABC analysis provides an accurate and objective picture of budget expenditures on medicines. VEN-analysis helps to prioritize between various medicines in their selection for procurement and use within a drug supply system. It is a method of classifying items or activities according to their relative importance. It is also known as "separating the vital few from the trivial many" because for any group of things that contribute to a common effect, a relatively few contributors account for a majority of effects. The analysis classifies the items into three categories, The first 20% of the items which accounts for approximately 80% of cumulative value (cost), 40% are category B items that that account for a further 15% of cumulative value and remaining 40% are C items accounting for mere 5% of total value [6-7]. Pharmaceutical Inventory Management may be described as the process of managing inventory in order to meet patient demand at the lowest possible cost with minimum investment. In hospitals accurate and current records are essential for proper management. They are the sources of information used to calculate the needs and inaccurate records produce inaccurate demand estimations which bring about problems of stock outs and expiry [5,8].
In Sudan, National Medicines Supply Fund (NMSF) is the national central agency for procurement and distribution medicines and medical devices to public health facilities, while the Revolving Drug Fund (RDF) is the main state agency that distribute of pharmaceutical products in Khartoum state. Both organizations make their procurement mainly from private companies either through tenders or direct purchasing. A previous study analyzed the annual medicine importation during the period 2012-2015 by private sector [9]. The objectives of this study are to compare the (ABC/VEN) analysis between importation by private sector to purchasing by different drug supply organizations. Also to explore methods of inventory control management used and assess knowledge of personnel involved in inventory control management of pharmaceutical at a private hospital.
This was retrospective cross sectional study done as quantitative and qualitative research conducted between (AUG.01.2017-OCT.31.2017). The quantitative research performed by obtaining electronic data of annual purchasing and expenditure from NMSF, RDF and Alzytona private hospital for the year 2017. The obtained data were reviewed and analyzed as MS Excel spreadsheet of the included organizations. Following steps were undertaken to do ABC-VEN analysis.
In step 1: ABC of analysis of all the drugs purchased or inventory was done. For this, the annual purchased of individual items was arranged in descending order. The cumulative cost of all the items was then calculated. The cumulative percentage of expenditure and the cumulative percentage of number of items were calculated. This list was then subdivided into three categories: A, B and C, based on the cumulative cost percentage of 70%, 20% and 10% respectively.
In step 2: The VEN critically analysis of all the listed item was performed by classifying the items into vital (V) which items critically needed for the survival. Essential (E) which items with a lower critically need, and non-essential (N) which items whose shortage can be tolerated for a short period at the health center.
In step 3: coupling of the ABC- VEN matrix was formulated by cross-tabulating the ABC and VEN analysis to evolve a management system which can be used for prioritization. From the resultant combination three categories were created (Category I, II, III).
In the qualitative research purposive sampling technique was performed, a total of 100 pharmaceutical personnel including the (NMSF,RDF,ALzytona private hospital) gave their consents to participate. Data was performed by using pretested self-administered questionnaire which contained closed-ended and open-ended questions were used for gathering information from the pharmaceutical personnel. 34 Open-ended questions were used to elicit experiences about inventory system that exist in the private hospital and drug supply centers. In the questionnaire the respondents were also asked about the application of the ABC &VEN. The collected data were entered, cleaned, coded and analyzed using Statistical Package for Social Sciences version 16 SPSS Inc., 233s. Wacker Drive Chicago, II. 60606-6412 USA). Results were summarized using table and figures.
Our Annual medicine expenditures from NMSF:
Data of the items purchased was obtained for (2015-2017) tender; the total number of items imported was 584 items. The total value of drugs purchased was 1,495,510,147.2 Euro = 52,941,059,210.88 SDG (Official exchange 1 EURO = 35.4 SDG). ABC analysis of NMSF tender shows that 79 (14%) items consumed 75% of the budget (Class A), 100 (17%) items consumed 15% (Class B), while majority of 405 (69%) items only consumed 10% of total medicine expenditure (Class C), (Table 1).
Table 1: Summary of medicines expenditures by ABC classification from NMSF
Medicine analysis |
Class A |
Class B |
Class C |
TOTAL |
noof items % |
79 (14%) |
100 (17%) |
405 (69%) |
584 (100%) |
Annual purchasing and cost value in EURO & % |
112628766.8(75%) |
22607789(15%) |
14314461.4(10%) |
149,551,0147.2 (100%) |
The study result in (Figure 1) shows that the cut-offs were not exactly at 75/15/10%, and differed marginally, which is permissible [10].
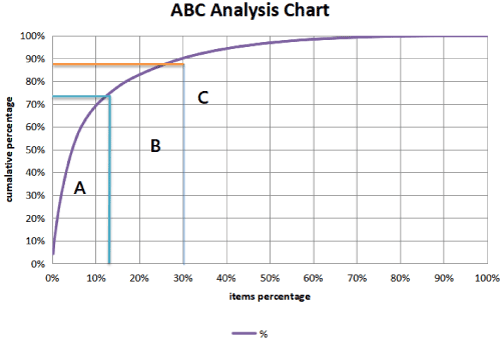
Figure 1. ABC Cumulative analysis of from the NMSF data
The VEN curve is shown in Figure 2. However, the individual drug budget cannot be visualized from this graph which can be best represented by plotting the percentage cost of each drug with, respect to Total Awarded Price (TAP) as shown for half items of class A (Figure 3). This concave type of plotting showed the individual drug expenditure as a percentage of the total TAP. Class A medicine items were observed to be of interest since they consumed large part of the budget and therefore the study went further on looking the composition of the class. The findings show that 27 out of the 79 class A items from NMSF procured items consumed 50% the budget and only 11 items consumed 25% the budget. These items are Sodium Chloride 0.9%, 500 ml had a percentage TAP of 4%. Dextrose 5% in 0.9% Sodium Chloride infusion used 3%, Iron (III) hydroxide 50mg/5ml 150ml syrup consumed 3%, Water for injection 5ml consumed 3%. Each of Meropenem 1g powder for injection with diluents, Human normal Immunoglobulin 5gm/100ml for i.v use, Ceftriaxone sodium 500mg powder for injection, Dextrose 5% in water solution for IV infusion with set 500ml bottle, and Artemether 80mg/ml in 1ml injection consumed 2% of the budget. (Figure 3).
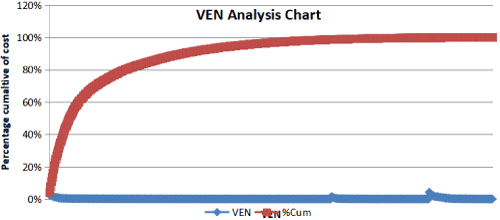
Figure 2. VEN Cumulative analysis of from the NMSF data
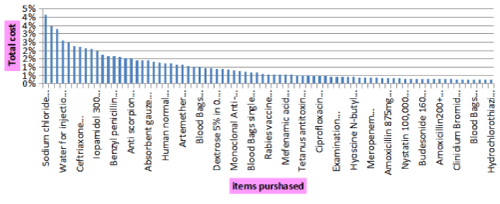
Figure 3. Detailed of some items of Class A procured by NMSF
Annual medicine expenditures from the Revolving drug fund (RDF)
The full detailed data of the items purchased was obtained only for year (2017) for the period between (1/1/2017 -30/10/2017), the total number of items purchased was 1134 items. The total value of drugs purchased was 242,148,789.5 SDG (official exchange I USD=30 SDG). ABC analysis of RDF shows that about 166 (15%) of the items purchased consumed 75% of budget allocated for drugs supply (Class A), 277 (24%) items consumed 15% (class B), whereas a majority of 691 (61%) items only consumed 10% of total medicine expenditures (Class C), (Table 2).
Table 2: Summary of medicines expenditures by ABC classification from RDF
Medicine analysis |
Class A |
Class B |
CLASS C |
TOTAL |
No of items (%) |
166(15%) |
277(24%) |
691(61%) |
1134(100%) |
Annual purchasing cost value in SDG and % |
181485796.23 (75%) |
36453453.06 (15%) |
24209540.16 (100%) |
242148789.5 (100%) |
The cutoff values were not exactly 75%, 15%, and 10% but differed marginally (Figure 4).
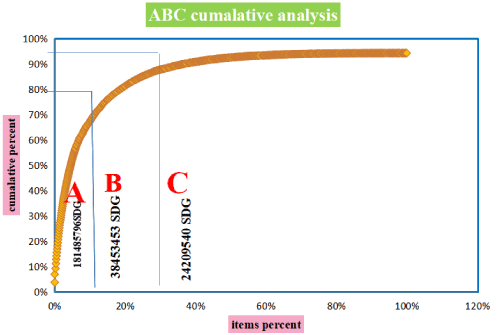
Figure 4. ABC Cumulative analysis of from the RDF data
The VEN curve individual drug cannot be visualized clearly in a graph due to the big numbers of items purchased (1134), but can be best represented by plotting the percentage cost of each drug with, respect to Total Cost Purchased (TCP) as shown for 40 items of class A (Figure 3). This concave type of plotting showed the individual drug expenditure as a percentage of the total TCP. Class A medicine items were observed to be of interest since they consumed large part of the budget and therefore the study went further on looking the composition of the class. The findings show that 50 out of the 166 class A items from RDF procured items consumed 50% the budget and only 15 items consumed 25% the budget. These items are Ceftriaxone sodium 1 gm powder for injection had a percentage TCP of 3.8%., Biphasic Isophane Insulin 30/70 Injection consumed 3.2%, Sodium Chloride 0.9%, 500 ml used 2.28%, Dorzolamide HCl + Timolol Maleate 2%+0.5% Eye drops 1.91%, Co-Amoxiclav 1gm Tablet 1.64%, Disposible Insulin syringe 1ml with needle 1.41%, Metronidazole 5mg/ml Infusion 1.34%, Pantoprazole Sodium 40mg Powder for Injection 1.31%, Mecobalamine (B12) 500mcg Tablet 1.29%, Co-Amoxiclav 457mg/5ml Powder for suspension 1.25%, Budesonide + Formoterol Fumarate 80mcg+4.5mcg/dose Inhaler 1.2%, Cefixime Trihydrate 400mg Capsule 1.19%, Meropenem 1gm Powder for Injection 1.1% and Cefuroxime Sodium 750mg Powder for Injection consumed 1.08% of the budget (Figure 5).
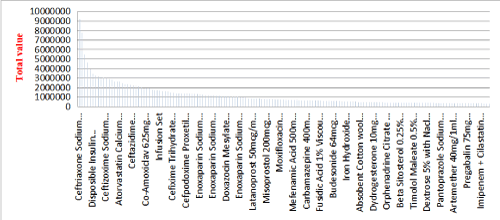
Figure 5. Detailed of some items of Class A procured by RDF
The comparison with similar studies in Sudan showed high variation in the percentage of different categories and this may be due to different institutes and sectors have different service profiles depending on the specialty service and purchasing system (Table 3).
Table 3: Comparison of ABC. VEN and ABC-VEN matrix analysis of different sectors
Mousnad study11
NHIF |
Salah Study9
Importation |
Present study
RDF |
Present study
NMSF |
Categorory |
17.0 |
9.2 |
15 |
14 |
A |
21.9 |
23.6 |
24 |
17 |
B |
61.1 |
67.2 |
61 |
69 |
C |
2.4 |
41.6 |
7.0 |
14.4 |
V |
52.6 |
45.1 |
47.0 |
63.4 |
E |
45.0 |
13.3 |
46.0 |
22.2 |
N |
17.8 |
23.0 |
22.4 |
23.1 |
I |
50.5 |
67.0 |
38.9 |
59.2 |
II |
31.7 |
10.0 |
38.7 |
17.7 |
III |
Note: All figures are in % for items, NHIF = National Health Insurance Fund. |
Annual medicine expenditures from ALZYTONA private hospital
ABC analysis detailed data of the items purchased by pharmacy department in ALzytona private hospital was obtained only for year 2017 in the period between (1/1/2017 - 30/10/2017), the total number of items purchased was 175 items. The total value of drugs purchased was 135,695 SDG (official exchange I USD = 30 SDG). ABC classification shown in (Table 4). The ABC cumulative curve confirms that the pharmaceutical purchasing was not exactly compatible under V. pareto curve (Figure 6).
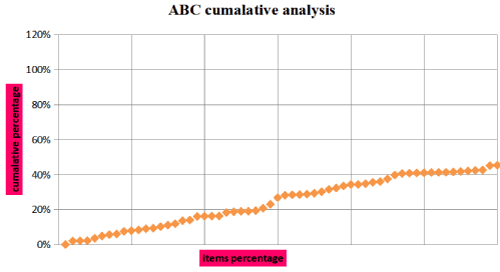
Figure 6. ABC Cumulative analysis of from the ALZYTONA national private hospital data
The VEN analysis was performed and the assignment of drugs to the appropriate classes was made in consultation with the hospital senior pharmacist. The findings revealed that 49 (28%) items in vital category constitutes 70% of the purchasing value, while 91 (52%) items grouped as essential constitute 26% of the value and 35 (20%) of the items as non-essential consumes only 4% of total medicine imported in 2017 (Table 5).
Table 4: Summary of medicines expenditures by ABC classification from ALZYTONA hospital
Medicine analysis |
Class A |
Class B |
Class C |
TOTAL |
No of items % |
116 (66%) |
32 (19%) |
27 (15%) |
175 (100%) |
Annual purchasing cost value in SDG & % |
100359 (74%) |
21158 ( 16%) |
14178 (10 %) |
135695 (100%) |
Table 5: VEN analysis of medicines purchased by Alzytona hospital during 2017
Medicine analysis |
Vital items |
Essential items |
Non-essential items |
Total |
No of items % |
49 (28%) |
91 (52%) |
35 (20%) |
175 (100%) |
Annual purchasing cost value in SDG & % |
95235 (70%) |
34895 (26%) |
5565 (40%) |
135693 (100%) |
Class A medicine items were observed to be of interest since they consume large part of the budget and therefore in Figure 7 shown the percentage of total value and the 116 items of class A. The top 5 items of class A which consumed the highest portion of the hospital medicines budget were Tenzaparin injection, Cefixime trihydrate 400mg capsule, Gabapentin 100mg caps, Amlodipine 10 mg tabs, Azithromycin 500 mg tabs.
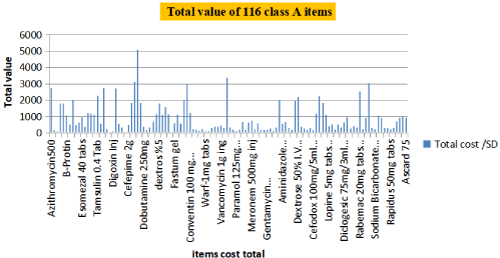
Figure 7. Values of the 116 class A items procured by ALZYTONA hospital
From the resultant ABC-VEN matrix, three categories were created (1,11,111) and would require different inventory control management in order to prioritized medicine importation process as depicted in (Table 6),top priority in money allocation should be considered to category 1 which compromise 75% of the budget and 45% of items, category 11 which constitutes about 20% of the budget and represented 36% of the items,Category 111 constitute only 5% of the budget and represented 19% of the items.
Table 6: Prioritization categories of medicines purchased by Alzytona private hospital
|
V |
E |
N |
Total medicine items |
|
|
No of items |
No of items |
|
No of items |
|
A |
AV33 (76%) |
AE18 (24%) |
|
AN19 (32%) |
70 (40%) |
B |
BV8 (19%) |
BE17 (23%) |
|
BN7 (12%) |
32 (18%) |
C |
CV2 (5%) |
CE39 (53%) |
|
CN32 (55%) |
73 (41%) |
TOTAL |
43 |
74 |
|
58 |
|
175 |
Category 1 |
AV |
AE |
AN |
BV |
CV |
TOTAL |
No of drugs |
Cost in SDG |
No of drugs |
Cost in SDG |
No of drugs |
Cost in SDG |
No of drugs |
Cost in SDG |
No of drugs |
Cost in SDG |
No of drugs |
Cost in SDG |
33 |
3766 |
18 |
23892 |
19 |
3391 |
8 |
4075 |
2 |
9125 |
80 (45%) |
40174 (75%) |
Category 11 |
BE |
CE |
BN |
|
TOTAL |
No of drugs |
Cost in SDG |
No of drugs |
Cost in SDG |
No of drugs |
Cost in SDG |
No of drugs |
Cost in SDG |
17 |
6822 |
39 |
4181 |
7 |
1302 |
63 (36%) |
12305 (20%) |
Category 111 |
CN |
|
Total |
No of drugs |
Cost in SDG |
No of drugs |
Cost in SDG |
32 |
872 |
32 (19%) |
872 (5%) |
Awareness and knowledge of personnel involved regarding the pharmaceutical inventory control management
As a part of qualitative research a self-administered questionnaire was distributed to 100 pharmaceutical personnel from NMSF, RDF, and ALzytona private hospital to assess their awareness and knowledge regarding important concepts of medicine inventory management system and to explore the challenges involved in inventory management. The knowledge of pharmacists involved in questionnaire was seen in detailed table below. Only 22% had a good knowledge about the concept of ABC-VEN analysis while 78% showed poor knowledge (Table 7). The respondents were asked whether they knew about different concepts used in inventory management. Majority knew about economic order quantity (64%), but minority knew safety stock and review period (39% & 38% respectively). Most of respondents had heard about the above concepts on job training (71%) or formal training (58%) and (35%) heard about these concepts in postgraduate studies and the least numbers from university studies (32%). The majority of respondents had a good knowledge on the methods used to keep the inventory control management electronic record control system and files were the most method used (92% and 50% respectively). About (70%) of the respondents were able to know the purpose of inventory control management, which means the pharmacists can understand the concept of good inventory management but with poor knowledge about the methodology and application of ABC and VEN analysis [11].
Table 7: Socio-demographic characteristics of pharmaceutical personnel and their knowledge about inventory control management system
Characteristics |
|
Respondents |
|
|
N=100(%) |
Sex |
Male |
54 (54%) |
|
Female |
46 (46%) |
Age range (Years) |
21 – 23 |
34 (34%) |
|
24 – 26 |
63 (63%) |
|
27 – 29 |
3 (3%) |
|
≥ 30 |
0 (0%) |
Academic level |
Bachelor of Pharmacy |
71 (71%) |
|
Postgraduate studies |
29 (29%) |
|
Other |
0 (0%) |
Occupation |
Pharmacist |
52 (52%) |
|
Hospital pharmacist |
15 (15%) |
|
Pharmacist technician |
8 ( 8%) |
|
Training pharmacist |
25 (25%) |
Work experience ( Years) |
0 – 2 |
40 (40%) |
|
3 – 5 |
50 (50%) |
|
6 – 9 |
9 (%) |
|
≥ 10 |
1 (1%) |
Do you know about ABC-VEN analysis of medicines in inventory control management? |
Yes |
22 (22%) |
|
No |
78 78%) |
Are there any written SOP for inventory control management used? |
Yes |
64 (64%) |
|
No |
36 (36%) |
Do you have predetermined time for ordering medicines from the main store |
Yes |
69 (69%) |
|
No |
31 (31%) |
Are you involved and assessing or estimating in the quintiles of medicines required per ear |
Yes |
63 (63%) |
|
No |
37 (37%) |
Do you have record for your purchase for the last three years |
Yes |
64 (64%) |
|
No |
36 (36%) |
The pharmaceutical personnel explored that there are many challenges faced them to be involved in inventory management, 24% of the pharmacists personnel complained about shortage of staff, 54% complained about shortage of stock and 94% of pharmacists complained about lack of seminars and sessions regarding methods of inventory control. In response to an opened-ended question about advantage of application of ABC-VEN analysis in inventory management only 22 of postgraduate pharmacist were answered and affirmed that it will lead to prioritization of medicines to meet the needs within the budget allocated and will avoid shortage of vital and essential drugs. Others think that it is a good pharmacoeconomic method of medicines expenditure control lead to cost-effectiveness.
Provision of care in health system is sensitive to the timely availability of facilities, including drugs. In case of drugs, besides the critical factor, the cost factor must be taken in consideration as can be seen from our study. ABC analysis is well-known method for analysis costs in pharmaceutical supply chain. It allows determination of medicines that are the most costly [12].
NMSF as a governmental public drug supply system has an overall goal is to improve access to essential medicines and other medical supplies in order to improve health status of inhabitants particularly in far states in free or affordable prices [13].
RDF also as a drug distribution system has been defined as : a self-sustaining (cost recovery) source of funding to ensure access to a continuous supply of quality drugs at an affordable price [14]. In both organizations ABC/VEN analysis is well applied as quantification and prioritization mechanisms, reflecting a good experience in the management of procurement process which result in a good estimate, quantify and forecast of medicines and avoid it is shortage and expiration. In addition to well kept inventory records, bin or stock cards containing the average consumption rates in addition to the existence of computer systems as local area net (LAN) in the headquarters of organizations crate a domain for record keeping ensuring best care for information management at the drug store level reflecting the real awareness about the importance of the drug management information system (DMIS) which is vital in decision making. Also better knowledge among NMSF and RDF personnel about the concept and SOPs of good inventory management than other pharmacists surveyed.
The health system in Sudan is characterized by heavy reliance on charging users at point of access (private expenditure on health is 79%) (WHO, 2004), with less use of prepayment system such as health insurance [15]. Medicine expenditures in NHIF-Sudan is an increasing and the number of medicines included in list also increased in items and quantities from 2006 to 2010 [16]. The comparison of this study results of NMSF and RDF with similar previous studies analyzed medicines importation anal NHIF medicines expenditures showed that there is more or less similarities in percentage of ABC items, but a high variation in the percentage VEN items which consequently led to variation in percentage of category I,II and III items [17].
The ABC analysis of medicine expenditure for Alzytona hospital, indicate that it was not following any of the inventory methods. No separate attention was give according on Class A stock. Drugs inventory was not at all to ABC method, the A group was containing around 66% of drugs, which should be only 10%, similarly C group was having only 15% of drugs that should have 70% of drugs. Again curve was not exactly applicable under V. pareto curve.
This is maybe due to the less knowledge about the ABC and VEN applications and inventory control management as on questionnaire the knowledge of the pharmacists working in ALZYTONA private hospital was poor which lead to ineffective inventory control and lack of other necessary medicines. Other consequences could be followed such as death, disability and inability to compensate and avoid damage which might have negative effect on hospital's image. Also The VEN analysis of this hospital indicated that 49 (28%) medicine items out of the 175 purchased items were vital medicines, 91(52%) items were essential medicines and 32(20%) items out of all items were Non-essential medicines, this analysis is based on criticality of the medicines as far as health needs and priorities of the patients are concerned, there could be serious functional dislocation of patients care services in hospitals when vital drugs are not available beyond a few days or a week, the functioning of the hospital can be adversely affected, the shortage of Non-essential items would not adversely affect patient care or hospital functioning even if its prolonged. Combining the ABC and VEN lead to categories of medicines that require different inventory control management, the essence is to narrow down the number of items requiring maximum supervision since there no need of loading equal attention to entire medicine inventory under the hospital custody. Category 1 had about 80 drug items comprising the expensive class A items and vital medicines, as total composing 75% of the total budget. It is not realistic to allocate maximum inventory control only on the class A medicine items of which some are expensive while others are cheap. The pharmacy department management should dedicate also higher supervisory effort on inventory control of the category 11 & 111. However the significance of managing category 11 medicines is to ensure the availability of essential medicines which has an impact on quality of pharmaceutical services provided.
Concerning the knowledge on pharmaceutical inventory management only (22%) knew about inventory control management however most of the pharmacist respondents could not correctly explain the application of VEN or ABC as far as inventory management is concerned.
Central stores like NMSF and RDF are applying good inventory management system, while hospital stores not applying ABC-VEN analysis system on purchasing. The inventory management tools knowledge was found to be poor in fresh graduates and university pharmacists but it was better in some postgraduate pharmacists which leads to the problems in the decision making in purchasing drugs and optimizing cost.
The personnel in drug supply departments should acquire an intensive formal training and regular workshops or seminars related to the subject.
- Dinesh D, Lokeswara C (2013) “ABC Classification for Inventory Optimization”, IOSR J Busi Mgmt 38: 2319-7668.
- Sandeep B, Bina M, Syed J, Mohan K, Doifode M (2016) ABC-VED matrix analysis of Government Medical College, Aurangabad drug store. Int J Comm Med Pub Heal 3: 469-472.
- Sefinew M , Mahlet Y, Berhanemeskel W, Workineh (2013) “ABC-VEN matrix analysis of pharmaceutical inventory management in TikurAnbessa Specialized Hospital for the years 2009 to 2013”. Ind J Basic Applied Med Res 734: 2250-2858.
- Tumaini H (2013) Analysis of medicines expenditures and pharmaceutical inventory control management at MUHIMBILI National Hospital. Institutional Repository, Muhimbili University of Health and Allied Sciences.
- Blackburn J (2010) Fundementals of purchasing and inventory control of certified pharmacy technicians. MBA-Healthcare Admin 2010: 6
- Thawani VR (2004) Economic analysis of drug expenditure in government medical college hospital, Nagpur. Ind J Pharmacol 36: 15-19.
- Gupta R, Gupta K, Jain B, Garg R (2007) ABC and VED analysis in medical stores inventory. Med J Armed Forces India 6: 325-327. [Crossref]
- Dobler B, Lee Jr L (1990) Purchasing and Material Management Text and Cases. (5th edn) McGraw-Hill Inc, New York, USA pp: 842.
- Kheder SI, Awad MM, Hamid K (2018) Prioritization of Medicines Importation by Private Sector in Sudan, Evidence Data Analysis 2012- 2015.
- Ammer DS (1982) Material Management and purchasing. Bombay: D.B Taraporevala Sons and Co. Pvt. Ltd.
- Mousnad MA, Ibrahim MIM, Palaian S, Shafie AA (2016) Medicine expenditure in Sudan National Health Insurance Fund: an ABC-VEN analysis of 5-year medicine consumption. J Pharm Health Serv Res 7: 165-171.
- Quick JD (2011) Management Sciences for Heath. MDS: Managing Access to Medicines and Heath Technologies. Serling Va Kumarian Press.
- Ali GKM, Omer AM (2011) Privitization of the Central Medical Supplies (CMS) public corporation: Why not ? Res In Pharm Biotech 3: 104-110.
- Hamid MM, Ibrahim MIBM (2009) Do systems contribute to the sustainability of the Revolving Drug Fund (RDF) in Sudan? Brit J Mgmt Eco 4: 288-295.
- WHO (2004) The World Medicines Situation. World Health Organization (WHO) Geneva, Switzerland.
- Mousnad MA, Shafie AA, Mohamed MI (2013) Determination of the main factors contributing to increase in medicine expenditures in National Health Insurance Fund in Sudan. J Pharm Health Serv Res 4: 159-164.
- Kagashe G, Massawe T (2012) Medicine Stock out and inventory management problems in public hospitals in Tanzania. A case of Dar es salam region. Int J Pharm 2: 252 -259.


