Introduction: In poor, rural communities, colorectal cancer (CRC) burden remains high, while CRC screening—known to be effective in prevention and control—remains low due to cultural norms and entrenched poverty. Academic detailing, outreach and education to providers through personal contact as is done by pharmaceutical representatives, to increase screening colonoscopy in Appalachian Kentucky was previously not effective. To understand why, we investigated the interaction of academic detailing with the underlying socio-economic context, in particular persistence of poverty.
Methods: Between 2005 and 2010, 3665 and 3571 medical records were reviewed using standard abstraction forms with quality control at baseline and six months for screening colonoscopy recommendation and completion in sixty-two primary care practices in rural Appalachian Kentucky after randomization to receive academic detailing either immediately after baseline review (“treatment” arm) or after the six-month review (“control” arm). Data analyses for this report were conducted in 2017-2019.
Results: In the treatment arm, nonpersistent poverty was associated with significant increases in both colonoscopy recommendation (p=0.020) and completion (p=0.0059), whereas persistent poverty was associated with a significant decrease in colonoscopy recommendation (p=0.0061) and unchanged colonoscopy completion (p=0.74). In the control arm, neither subgroup showed a significant change in either colonoscopy recommendation or completion.
Conclusions: Even after academic detailing, disparities in colonoscopy screening between persistent- and nonpersistent-poverty communities persist, notwithstanding the latter being of moderate—and not low—poverty and the racial and cultural homogeneity of Appalachian Kentucky. Results suggest academic detailing may help overcome cultural barriers in the absence of persistent poverty. But its presence may reinforce cultural norms and beliefs, undermining academic detailing, which by itself may be detrimental in persistently poor communities.
screening colonoscopy, Appalachian Kentucky, academic detailing, persistent poverty
Colorectal cancer (CRC) remains a worldwide public health concern despite significant declines in CRC-specific mortality since its peak in the mid-twentieth century [1-3]. CRC is the third most common cancer in men and women, and the second leading cause of age-adjusted cancer deaths in the United States (US) [2,4]. Improved screening procedures and their increased use are associated with declines in both CRC incidence and mortality [4-6]. A recent prospective study that followed 88,902 participants for 22 years demonstrated that 40% of CRCs would have been prevented by screening colonoscopy [7].
Colonoscopy, considered the gold standard for CRC screening and the most frequently used test, is recommended by the American Cancer Society and US Preventive Services Task Force [2,4,6,8,9] and is covered by Medicare and Medicaid [10]. Moreover, most states, including Kentucky, require insurance coverage for CRC screening [10]. Nonetheless, screening rates remain low [4,6] and approximately one in three 50 to 75 year-old adults of average CRC risk was not screened in 2012 [11]. Also, screening rates are variable, both among and within states [12-15]. Thus Kentucky, with a 2012 screening rate of 62.9% vs. 65.1% nationally [16], has vast regional differences. Compared to the rest of the state, screening rates in Appalachian Kentucky are lower and CRC incidence and mortality higher [8,17,18]. Appalachian Kentucky is primarily rural, with higher rates of poverty, lower levels of educational attainment and greater health disparities than the rest of Kentucky [8,19]. For example, in 2012, 42 (77.8%) of the 54 counties in Appalachian Kentucky were classified by the US Department of Treasury as persistently poor, as defined in US Public Law 112-74: poverty rates of 20 percent or more in the 1990, 2000 and 2010 decennial censuses [20]. In contrast, only 1/66 (1.5%) non-Appalachian counties was persistently poor [20]. Furthermore, for the two five-year periods 2005-2009 and 2006-2010 covering the duration of this study, Appalachian Kentucky had the highest poverty rate and lowest median household income among all 13 Appalachian regions [21,22].
Low uptake of colonoscopy is associated with lack of physician recommendation [8,23,24], which favorably influences screening acceptance, including in Appalachia [6,23,25-29]. However, physician recommendation may not be sufficient; trust in health professionals significantly improves screening acceptance in rural and low income populations [30,31] A general lack of trust in the healthcare system is common in the Appalachian culture, as documented extensively [32-34]. Avoidance and ineffective use of the healthcare system lead to decreased rates of cancer screening [32,35-38].
To improve CRC screening in Appalachian Kentucky, Dignan et al. [8] developed an academic detailing-based intervention, which involves face-to-face education of the provider by a trained educator [8,27,39-42], to increase patient-centered, cost-effective treatments, including screening and its recommendation [43,44]. Dignan et al. [8] observed a larger increase in screening rates over six months in practices receiving academic detailing than in control clinics without academic detailing, but the difference was not significant, although physician recommendation was significantly associated with colonoscopy completion.
The present study uses data collected from the original work of Dignan et al8 to assess factors in addition to academic detailing that may be associated with the intervention results. The goal of the present work was to examine whether any patient, provider or community characteristic enhanced or attenuated the effect of academic detailing on colonoscopy screening in Appalachian Kentucky. Few studies have investigated factors that influenced the strength (moderator) or explained the relationship (mediator) between interventions and the study population [45].
The University of Kentucky Institutional Review Board approved this project, which was conducted between 2005 and 2010. Data were collected at 62 primary care practices located in 29 counties in Appalachian Kentucky at three time points: baseline, 6 months and 18 months.8 Trained medical record reviewers checked for documented screening recommendation and completion in 60 or more randomly selected medical records of patients 50 years old or older, who had been seen in the practice during the previous 60 days and were eligible for CRC screening. Also noted were various patient and provider characteristics. Racial and ethnic information was not collected because Appalachian Kentucky is predominantly white.
Intervention design
Details of the original study design have been presented previously by Dignan et al. [8] To assess intervention efficacy, practices were randomly assigned to receive academic detailing either soon after baseline assessment (early intervention arm) or after data collection at six months (delayed intervention arm). Because the present analysis was restricted to the first six months of Dignan et al. [8] study, the early intervention practices served as the “treatment” arm and the delayed intervention practices as the “control” arm, and are referred to as such.
Measures
In addition to the standard measures collected for the original study (provider recommendation and screening completion) [8], to investigate effects of community characteristics on screening, the following information was obtained at the county level for each practice: persistent-poverty status [20], “index of relative rurality” (IRR) [46] and proportion of the population without health insurance. IRR is a continuous, multidimensional measure of rurality that varies from zero (most “urban”) to one (most “rural/remote”) [46].
Statistical analysis
The primary outcome of interest was the rate of screening colonoscopy in the context of patient, provider and community characteristics {Pc} six months after receipt of the academic detailing intervention. We first measured each characteristic’s effect on colonoscopy completion using logistic regression, adjusting for intervention type (I; treatment or control) and time of data collection (t; 0 or 6 months), to control for any secular trend. Potential positive correlated outcomes within practices were controlled by using generalized estimating equations (GEEs) to test for significance of each characteristic’s association with the outcome [8,28]. Because the amount of provider time dedicated to patient care is likely to influence colonoscopy recommendation, we combined practice size, hours worked per week and patient load into an average provider minutes per patient.
We then studied the effect of each characteristic on the intervention by including interaction terms among the characteristic, intervention and time of data collection. In particular, we modeled the third-order interaction term (I × t × Pc), which measures the effect of Pc on the intervention-attributable temporal change in screening completion. We also included all possible second-order interaction terms involving these three variables, where each interaction term assesses whether the difference in colonoscopy rate by the change in one variable differs across the other variable.
Finally, we used the Wilcoxon signed rank test to compare distributions of screening colonoscopy recommendation and completion rates at 0 and 6 months in practices, stratified by poverty status and intervention. Statistical analyses were performed in 2017-2019 using SAS 9.4® (SAS Institute, Cary, NC) and an a priori two-sided significance level of 0.05.
The patient demographic characteristics, given in Table 1, show that at baseline and six-month follow-up 3665 (1893 early and 1772 delayed intervention) and 3571 (1842 early and 1729 delayed intervention) medical records were reviewed. The age and sex distributions and number of office visits in the previous 12 months were all similar at both time points and interventions, although there were small increases in office visits at six months. Also, at baseline, all patient characteristics, including screening colonoscopy recommendation and completion rates, were similar in both arms, further indicating adequate randomization of practices. Between 0 and 6 months, the increase in colonoscopy completion was greater in the early intervention (“treatment”) arm than in the delayed intervention (“control”) arm, but not significantly so [8]. In both arms, the recommendation rate decreased modestly, and by essentially the same amount.
Table 1. Patient Characteristics, including Screening Colonoscopy Recommendation and Completion Rates, at Baseline and Six-month Follow-up for Early and Delayed Intervention Arms (Appalachian Kentucky, 2005–2010). (The early intervention arm received academic detailing soon after baseline assessment, and so served as the “treatment” arm for this study. The delayed intervention arm received academic detailing only after the 6-month follow-up assessment, and so served as the nonintervention, “control” arm for this study. At baseline and 6 months, a total of 3665 and 3571 patient charts were reviewed)
|
|
Baseline† |
Six-month follow-up† |
|
|
Early Intervention
(“Treatment”)
n=1893 |
Delayed Intervention (“Control”)
n=1772 |
Early Intervention (“Treatment”)
n=1842 |
Delayed Intervention (“Control”) n=1729 |
|
|
Mean (SD) |
Mean (SD) |
Mean (SD) |
Mean (SD) |
Patient age, years |
65.6 (10.5) |
63.9 (9.69) |
64.7 (9.90) |
63.1 (9.43) |
Number of office visits in previous year |
6.49 (4.64) |
6.41 (4.46) |
7.29 (5.41) |
6.95 (4.76) |
|
|
N (%) |
N (%) |
N (%) |
N (%) |
Patient sex |
Male |
746 (39.5) |
694 (39.4) |
765 (41.5) |
664 (38.4) |
|
Female |
1141 (60.5) |
1068 (60.6) |
1077 (58.5) |
1065 (61.6) |
Documented screening colonoscopy recommendation |
805 (42.6) |
771 (43.6) |
735 (39.9) |
698 (40.4) |
Documented screening colonoscopy completion |
542 (28.7) |
531 (30.1) |
621 (33.7) |
526 (30.4) |
†n=number of patient charts reviewed |
Table 2 summarizes the measured provider characteristics and socioeconomic indicators for the counties that the practices served. For group practices, we used the characteristics of the lead physician. Among the 62 practices, 49 reported themselves as family medicine, 9 as internal medicine and 4 as both: the latter two were grouped together as internal medicine. All provider and community characteristics were similar in the two arms, including poverty persistence rate, rurality and proportion of uninsured patients, with most practices located in persistent-poverty counties. Both uninsured rates were comparable to the 15.5 % rate in US non-metropolitan areas in 2009 [47]. The average IRRs in both arms were somewhat higher than the US average index of 0.497 in 2000 [46].
Table 2. Characteristics of Provider and Community Served by Provider (Appalachian Kentucky, 2005–2010)
Provider/community characteristic |
Mean (SD) or number (%) |
Treatment |
Control |
Number of providers in practice |
2.56 (1.90) |
3.17 (2.23) |
Hours worked per week |
51.4 (10.8) |
49.4 (12.1) |
Patients seen per day |
47.6 (30.6) |
60.7 (40.0) |
Provider time per patient, minutes |
34.8 (25.5) |
33.1 (17.1) |
Year graduated1 |
1987 (1978–1996) |
1988 (1981–1998) |
Years practiced |
13.7 (10.9) |
14.3 (10.8) |
Uninsured patients, percent |
15.8 (1.73) |
15.5 (1.83) |
Index of Relative Rurality (IRR) |
0.532 (0.112) |
0.547 (0.090) |
Practice specialty |
Family medicine |
26 (81.3) |
23 (76.7) |
Internal medicine |
6 (18.8) |
7 (23.3) |
Practice type |
Solo |
15 (46.9) |
11 (36.7) |
Group |
17 (53.1) |
19 (63.3) |
Provider sex |
Male |
20 (62.5) |
21 (77.8) |
Female |
12 (37.5) |
6 (22.2) |
Nurse practitioner or physician assistant in practice |
Yes |
16 (53.3) |
12 (44.4) |
No |
14 (46.7) |
15 (55.6) |
Practice in persistent poverty county |
No |
10 (31.3) |
9 (30.0) |
Yes |
22 (68.8) |
21 (70.0) |
1Median (interquartile range) |
The GEE analyses for screening colonoscopy completion showed that adjusting for intervention and time of data collection, patient age and number of office visits in the past year were significant, as were the presence of a nurse or physician assistant, poverty persistence and IRR (Table 3). However, when interaction terms were included none of the characteristics was significant, although average provider time per patient approached significance. Thus, no patient/provider/community characteristic modified significantly the academic detailing-attributable effect on screening colonoscopy completion. Furthermore, even when we restricted attention to the treatment arm, the increase in colonoscopy completion was not significant (p=0.060; results not shown).
Table 3. Results of Generalized Estimating Equation (GEE) Modeling: (i) Effects of Patient/Provider/Community Characteristics on Screening Colonoscopy Completion and (ii) Effects of these Characteristics on the Intervention-Attributable Temporal Change in Colonoscopy Completion (Appalachian Kentucky, 2005–2010)
|
Results of GEE modeling |
(i) p-value for regression coefficient of characteristic (Pc), adjusting for intervention type (I) and time of data collection (t) |
(ii) p-value for regression coefficient of third-order interaction term, I × t × Pc |
Patient characteristics |
Sex |
Female versus male |
0.81 |
0.11 |
Age, years |
Continuous |
0.049 |
0.91 |
Number of office visits in past year |
Continuous |
0.0002 |
0.58 |
Provider characteristics |
Practice specialty |
Internal medicine versus family medicine |
0.071 |
0.28 |
Practice type |
Group versus solo |
0.47 |
0.94 |
Years practiced |
Continuous |
0.64 |
0.57 |
Provider minutes per patient |
Continuous |
0.78 |
0.058 |
Sex of lead provider |
Male versus female |
0.41 |
0.60 |
Year graduated |
Continuous |
0.51 |
0.35 |
Nurse practitioner or physician assistant |
Yes versus no |
0.047 |
0.89 |
Community characteristics |
Persistent poverty |
No versus yes |
0.0022 |
0.46 |
Percent uninsured |
Continuous |
0.56 |
0.75 |
Index of relative rurality (IRR) |
Continuous |
0.0005 |
0.83 |
To understand why academic detailing did not affect a significant increase in colonoscopy completion and the increase was not significantly modified by any patient/provider/community characteristic, we examined the raw data, in particular screening rates at baseline and six months, controlling for persistent poverty status, because of poverty’s strong association with cancer screening [6,8,15,23,24,48,49]. Persistent poverty is especially relevant, because time is an important element in poverty, with persistent poverty being more detrimental to health than periodic bouts of poverty [50-52]. Because of the importance of physician recommendation, levels of this factor were also examined (Table 4). When stratified by persistent poverty, the patient distributions and number of practices were similar in both intervention arms at both times. Table 4 also shows that persistent poverty affected both colonoscopy recommendation and completion, academic detailing notwithstanding. In particular, after academic detailing, practices serving nonpersistent-poverty counties demonstrated significant increases in both colonoscopy recommendation (p=0.020) and completion (p=0.0059). In contrast, despite academic detailing, colonoscopy completion was essentially unchanged (p=0.74) in practices serving persistent-poverty communities, whereas, colonoscopy recommendation decreased significantly (p=0.0061). In the control arm there was no significant change in either colonoscopy recommendation or completion, irrespective of poverty status.
Table 4. Patient Distribution and Community Characteristics in Persistent- and Nonpersistent-Poverty Communities at Baseline and Six-month follow-up for Early and Delayed Intervention Arms, together with Colonoscopy Recommendation and Completion Rates (Appalachian Kentucky, 2005–2010)
|
|
Early Intervention
(“Treatment”) |
Delayed Intervention (“Control”) |
|
|
Persistent Poverty |
Persistent Poverty |
|
Time,
months |
No |
Yes |
No |
Yes |
N (%) |
N (%) |
N (%) |
N (%) |
Number of patient charts reviewed |
0 |
598 (31.6) |
1295 (68.4) |
534 (30.1) |
1238 (69.9) |
6 |
587 (31.9) |
1255 (68.1) |
498 (28.8) |
1231 (71.2) |
Number of practices |
10 (31.3) |
22 (68.8) |
9 (30.0) |
21 (70.0) |
|
Time, months |
Rate, % |
Rate, % |
Rate, % |
Rate, % |
Documented screening colonoscopy recommendation |
0 |
47.1 |
40.5 |
49.2 |
41.2 |
6 |
60.0 |
30.5 |
52.5 |
35.5 |
Documented screening colonoscopy completion |
0 |
37.7 |
24.5 |
36.4 |
27.3 |
6 |
47.9 |
27.1 |
38.6 |
27.2 |
The major result of this study on screening colonoscopy in Appalachian Kentucky is that despite academic detailing to primary care providers, persistent poverty is a barrier to colonoscopy recommendation and completion. Poverty is also associated with diminished patient acceptance of screening, even among the insured, and despite physician recommendation [6,18,53]. Thus, persistent poverty negatively modifies physician recommendation, a mediator that increases the probability of colonoscopy completion [6,8,23,25-29]. Persistent poverty is also associated with decreased probability of screening being recommended by the physician (Table 4).
Screening colonoscopy recommendation and completion: nonpersistent versus persistent poverty
When only the nonpersistent-poverty strata in the two intervention arms were considered, significantly increased screening colonoscopy recommendation and completion rates were observed in the treatment arm, but not in the control arm. These findings suggest that in the absence of persistent poverty, academic detailing significantly and positively effects screening colonoscopy recommendation and completion. In contrast, and also a noteworthy and novel finding, the treatment arm of the persistent-poverty subgroup showed a significant decrease in colonoscopy recommendation, but not the control arm. The completion rate in the treatment arm, however, increased modestly, albeit insignificantly. Although a steady increase in CRC screening was observed in the US over the ten-year period 2000-2010 [54], this secular increase appears to be an unlikely explanation in our study population, given the essentially unchanged screening rates in both poverty subgroups of the control arm (Table 4 and Figure 1).
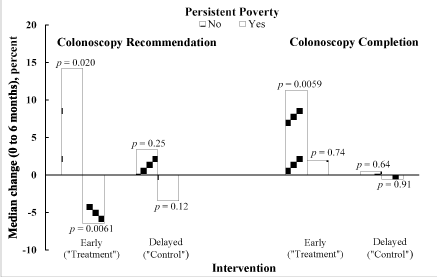
Figure 1. Wilcoxon signed-rank test results for colonoscopy recommendation and completion rates, illustrating how screening behavior changed over the six months in each intervention arm, stratified by poverty status
Nonpersistent poverty counties in Appalachian Kentucky are of moderate, and not low, poverty
The differences in screening colonoscopy recommendation and completion outcomes in the two poverty subgroups after academic detailing are worthy of especial note (Table 4), given that nonpersistent poverty in Appalachian Kentucky is not synonymous with low poverty. Indeed for the 5-year periods 2005-2009 and 2006-2010 the median poverty rates in the nonpersistent-poverty counties of our study were 19.1% and 18.5%, exceeding the poverty rates in the US (13.5 and 13.8%), Kentucky (17.4 and 17.7%) and the entire Appalachian region (15.4 and 15.6%) [55]. These poverty rates classify the nonpersistent-poverty counties as moderate (poverty rate=10-19.9%) [56], and not low poverty (poverty rate<10%) [56]. Moreover, for both five-year periods, proportionally more of the poor in the nonpersistent-poverty counties could be classified as deeply poor (income less than half the poverty line income) [57] than in the persistent-poverty counties (medians of 48.8 and 45.1% vs. 40.8 and 38.4%).
Persistence of poverty and environmental context may explain screening dichotomies
It is unlikely that the poverty rate at any point in time explains the differences in screening observed between the two subgroups; persistence of poverty is more likely the cause. This perspective is supported by the recent finding that geography interacts with poverty, and place of residence can be a strong prognosticator of life expectancy for the poor [58]. Persistent poverty imposes barriers and burdens beyond those arising solely due to individual poverty, perpetuating the poverty [51,59]. For example, inclusion of decennial poverty rates back to 1960 did not change the persistent-poverty status of any of the 29 counties in our study. Cultural expectations and resources available within the environment affect the individual’s decisions, the ability to make them, and how they are evaluated [60]. Thus in general people’s personal choices are restricted by their environmental context. Time is an important element in poverty, and longitudinal studies have shown that long-term income is more important for health than is current income and persistent poverty is more detrimental to health than is periodic bouts of poverty [50-52].
Persistent poverty-induced cultural/societal influence and culturally/racially homogeneous Appalachian Kentucky
Individual health behavior is influenced by factors at both the individual and neighborhood/community levels, with the latter interacting with and influencing the former [61]. Individual attitudes and behavior are shaped at least in part by the surroundings and cultural norm, especially in poor, rural communities [61]. Thus, social influence, for example, encouragement by friends or family to undergo screening, was found to be an important positive correlate of CRC screening uptake in Appalachian Ohio [23]. However, few studies have examined the effect of persistent poverty or of different levels of poverty (instead of just poor versus non-poor) within the same community on colorectal cancer screening, especially in predominantly white rural populations. To the best of our knowledge this is the first study to use objective data (as opposed to self-reports) to contrast screening colonoscopy use in persistent-poverty versus nonpersistent-poverty communities, within an essentially racially and culturally homogenous population such as Appalachian Kentucky, which is predominantly white, rural and poor.
Why colonoscopy recommendation to the persistently poor decreased after academic detailing
The contrast between the persistent-poverty subgroups of the two intervention arms is striking: academic detailing is not just ineffective in the persistent-poverty subgroup but may actually be detrimental with regard to colonoscopy recommendation (Figure 1). Thus, academic detailing not only failed to change physician behavior, which can be challenging [27], but also may have increased physician reluctance to recommend screening to the persistently poor. Physicians and patients are reluctant to consider screening when there is little chance of follow-up [62-64]. Screening is also not offered if the provider perceives poor patient acceptance or belief in value of prevention [18,65] common barriers in Appalachia, as discussed next.
Persistent poverty as barrier to uptake of screening, despite provider recommendation
Two major factors influencing health behavior in Appalachian Kentucky are cultural norms and poverty, entrenched for over 150 years, each of which may interact with and reinforce the other’s persistence [66]. A commonly cited barrier for CRC screening is patient failure to complete physician-recommended screening [18,63], more so among rural than urban residents [6,18,53]. Although physician recommendation improves screening acceptance, it may not be sufficient, particularly among rural and low-income populations, and trust in the primary care provider is a significant driver of screening completion [30]. A general lack of trust in the healthcare system is common in the Appalachian culture, as are self-reliance, self-diagnosis, self-treatment, and other cultural and religious barriers to receiving preventive services, including asymptomatic screening being low on the priority list [17,18,23,32,33,35,38,67]. Healthcare avoidance and its ineffective use lead to decreased cancer screening rates [32,35-38]. Appalachia residents are more likely to avoid healthcare than those living outside Appalachia [35].
Nonetheless, despite the numerous cultural obstacles endemic to Appalachian Kentucky, our results showed that academic detailing significantly increased colonoscopy recommendation and completion in nonpersistent poverty counties, suggesting that in such an environment academic detailing can overcome cultural barriers. In a culture of persistent poverty, however, academic detailing is not just ineffective, but may be detrimental, further suggesting that persistent poverty is a barrier that neutralizes the positive effect of academic detailing, perhaps by reinforcing cultural norms and beliefs.
Implications for public health
Cancer screening continues to be low among underserved populations, including poor, uninsured and rural communities [68]. Our findings highlight the importance of considering assets and barriers of the community when assessing interventions. The need for interventions beyond academic detailing to increase screening in Appalachian Kentucky is paramount, given its high cancer incidence and mortality rates, the positive impact of screening, and the numerous barriers to obtaining cancer screening in rural Appalachia [5-8,17-19,23,24,27,48,69,70]. Screening rates can only be increased if the enhancers and attenuators of academic detailing are identified and either emphasized in case of the former or addressed in case of the latter. Moreover, few studies have examined the mediators and modifiers of intervention effects (Figure 2) [45].
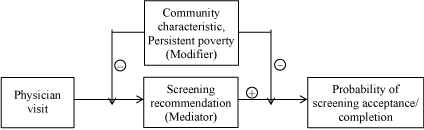
Figure 2. Mediator-modifier model for the effects of interaction between persistent poverty and provider screening recommendation on probability of colonoscopy completion
Study limitations and concluding remarks
This study is a secondary exploratory analysis of a completed project on whether a patient population with specific characteristics affects screening. Results show that even within a poor, rural, underserved and racially and culturally homogeneous community such as Appalachian Kentucky there are significant disparities between the persistent- and nonpersistent-poverty subgroups. This important finding requires further research for confirmation and understanding at the patient level. We realize that conclusions of this study, although randomized controlled trial in design, are derived from an essentially ecological analysis, because of the use of poverty data at the county level. Yet an ecological study of this type is a necessary first step to identify areas warranting further investigation. Our study strongly suggests that the characteristics of a community influence the type of healthcare it receives and accepts, especially with regard to preventive services such as cancer screening. We also realize that the characteristics of the lead provider may not be representative of all of the providers in the practice. However, since there were 62 practices in the study, the effect of lead provider characteristics is likely distributed broadly across intervention and control practices.
This work was supported by the National Institutes of Health, National Cancer Institute (RO1 CA113932 and P30 CA177558) and Centers for Disease Control and Prevention (U48 DP000039). The first author (KR) was supported in part by the American Cancer Society through a Physician Training Award in Cancer Prevention and Control (ACS Grant PTAPM-11-074-01). We thank Drs. Steven Browning, Angela Dearinger, David Mannino and April Young of the University of Kentucky, Drs. Paul Falzer and Michael Wininger of VA CT/Yale University and Dr. Patricia Parsons-Wingerter of NASA Glenn Research Center for helpful discussions. The authors thank an anonymous reviewer for helpful comments.
- World Health Organization (2018) International Agency for Research on Cancer. Colorectal Cancer. [Accessed 20 June 2020].
- American Cancer Society (2020) Cancer Facts & Figures 2019. [Accessed 21 June 2020].
- Siegel R, Desantis C, Jemal A (2014) Colorectal cancer statistics, 2014. CA Cancer J Clin 64: 104-117. [Crossref]
- US Preventive Services Task Force, Bibbins-Domingo K, Grossman DC, Curry JS, Davidson KW, et al. (2016) Screening for Colorectal Cancer: US Preventive Services Task Force Recommendation Statement. JAMA 315: 2564-2575. [Crossref]
- Edwards BK, Ward E, Kohler BA, Eheman C, Zauber AG, et al. (2010) Annual report to the nation on the status of cancer, 1975-2006, featuring colorectal cancer trends and impact of interventions (risk factors, screening, and treatment) to reduce future rates. Cancer 116: 544-573. [Crossref]
- Mone, A., Mocharla, R., Avery, A., Francois, F., 2013. Issues in Screening and Surveillance Colonoscopy. In: Bustamante, M. ed. Colonoscopy and Colorectal Cancer Screening - Future Directions Ch.2.
- Nishihara R, Wu K, Lochhead P, Morikawa T, Liao X, et al. (2013) Long-term colorectal-cancer incidence and mortality after lower endoscopy. N Engl J Med 369: 1095-1105. [Crossref]
- Dignan M, Shelton B, Slone SA, Tolle C, Mohammad S, et al. (2014) Effectiveness of a primary care practice intervention for increasing colorectal cancer screening in Appalachian Kentucky. Prev Med 58: 70-74. [Crossref]
- Klabunde CN, Lanier D, Nadel MR, McLeod C, Yuan GG, et al. (2009) Colorectal Cancer Screening by Primary Care Physicians Recommendations and Practices, 2006-2007. Am J Prev Med 37: 8-16. [Crossref]
- American Cancer Society (2014) Colorectal cancer screening – state and federal coverage laws. [Accessed 29 March 2020].
- CDC Newsroom (2013) Colorectal cancer screening rates remain low. [Accessed 5 July 2020].
- Lian M, Schootman M, Yun S (2008) Geographic variation and effect of area-level poverty rate on colorectal cancer screening. BMC Public Health 8: 358. [Crossref]
- Anderson AE, Henry KA, Samadder NJ, Merrill RM, Kinney AY (2013) Rural vs urban residence affects risk-appropriate colorectal cancer screening. Clin Gastroenterol Hepatol 11: 526-533. [Crossref]
- Colditz GA, McGowan LD, James AS, Bohlke K, Goodman MS (2014) Screening for colorectal cancer: using data to set prevention priorities. Cancer Causes Control 25: 93-98. [Crossref]
- Faruque FS, Zhang X, Nichols EN, Bradley DL, Reeves-Darby R, et al. (2015) The impact of preventive screening resource distribution on geographic and population-based disparities in colorectal cancer in Mississippi. BMC Res Notes 8: 423. [Crossref]
- Klabunde CN, Joseph DA, King JB, White A, Plescia M (2013) Vital Signs: Colorectal Cancer Screening Test Use - United States, 2012. MMWR Morb Mortal Wkly Rep 62: 881-888. [Crossref]
- Kelly KM, Phillips CM, Jenkins C, Norling G, White C, et al. (2007) Physician and staff perceptions of barriers to colorectal cancer screening in Appalachian Kentucky. Cancer Control 14: 167-175. [Crossref]
- Shell R, Tudiver F (2004) Barriers to cancer screening by rural Appalachian primary care providers. J Rural Health 20: 368-373. [Crossref]
- Appalachian Regional Commission (2017) Creating a culture of health in Appalachia. Key Findings: Appalachian Kentucky. [Accessed 21 June 2020].
- US Department of the Treasury Community Development Financial Institutions Fund. Persistent Poverty Counties. [Accessed 14 June 2020].
- Jacobsen LA, Lee M, Pollard K (2013) Household wealth and financial security in Appalachia. Chapter 4. Trends in Household Income and Poverty in Appalachia. Appalachian Regional Commission. [Accessed 13 June 2020].
- Pollard KJ, Jacobsen LA (2012) The Appalachian Region: A Data Overview from the 2006-2010 American Community Survey Chartbook. [Accessed 13 June 2020].
- Paskett ED, Llanos AA, Young GS, Pennell ML, Lee CJ, et al. (2013) Correlates of colorectal cancer screening among residents of Ohio Appalachia. J Community Health 38: 609-618. [Crossref]
- Curry WJ, Lengerich EJ, Kluhsman BC, Graybill MA, Liao JZ, et al. (2011) Academic detailing to increase colorectal cancer screening by primary care practices in Appalachian Pennsylvania. BMC Health Serv Res 11: 112. [Crossref]
- Wackerbarth SB, Tarasenko YN, Joyce JM, Haist SA (2007) Physician colorectal cancer screening recommendations: an examination based on informed decision making. Patient Educ Couns 66: 43-50. [Crossref]
- Janz NK, Lakhani I, Vijan S, Hawley ST, Chung LK, et al. (2007) Determinants of colorectal cancer screening use, attempts, and non-use. Prev Med 44: 452-458. [Crossref]
- Rutledge W, Gibson R, Siegel E, Duke K, Jones R, et al. (2006) Arkansas Special Populations Access Network perception versus reality--cancer screening in primary care clinics. Cancer 107: 2052-2060. [Crossref]
- Greiner KA, Engelman KK, Hall MA, Ellerbeck EF (2004) Barriers to colorectal cancer screening in rural primary care. Prev Med 38: 269-275. [Crossref]
- McLachlan SA, Clements A, Austoker J (2012) Patients' experiences and reported barriers to colonoscopy in the screening context--a systematic review of the literature. Patient Educ Couns 86: 137-146. [Crossref]
- Gupta S, Brenner AT, Ratanawongsa N, Inadomi JM (2014) Patient trust in physician influences colorectal cancer screening in low-income patients. Am J Prev Med 47: 417-423. [Crossref]
- Behringer B, Friedell GH (2006) Appalachia: where place matters in health. Prev Chronic Dis 3: A113. [Crossref]
- Behringer B, Friedell GH, Dorgan KA, Hutson SP, Naney C, et al. (2007) Understanding the challenges of reducing cancer in Appalachia: Addressing a place-based health disparity population. Californian J Health Promotion 5: 40-49.
- McMillan SJ, Haley E, Zollman-Huggler P, Avery EJ, Winchenbach MG, et al. (2007) Breast health education for working women in Appalachia: insights from focus group research. Cancer Control 14: 265-276. [Crossref]
- McGarvey EL, Leon-Verdin M, Killos LF, Guterbock T, Cohn WF (2011) Health disparities between Appalachian and non-Appalachian counties in Virginia USA. J Community Health 36: 348-356. [Crossref]
- Vanderpool RC, Huang B (2010) Cancer risk perceptions, beliefs, and physician avoidance in Appalachia: results from the 2008 HINTS Survey. J Health Commun 15: 78-91. [Crossref]
- Simmons LA, Huddleston-Casas CA, Morgan KA, Feldman D (2012) Mixed methods study of management of health conditions in rural low-income families: implications for health care policy in the USA. Rural Remote Health 12: 1879. [Crossref]
- Spleen AM, Lengerich EJ, Camacho FT, Vanderpool RC (2014) Health care avoidance among rural populations: results from a nationally representative survey. J Rural Health 30: 79-88. [Crossref]
- Hutson SP, Dorgan KA, Phillips AN, Behringer B (2007) The mountains hold things in: the use of community research review work groups to address cancer disparities in Appalachia. Oncol Nurs Forum 34: 1133-1139. [Crossref]
- Shankaran V, Luu TH, Nonzee N, Richey E, McKoy JM, et al. (2009) Costs and cost effectiveness of a health care provider-directed intervention to promote colorectal cancer screening. J Clin Oncol 27: 5370-5375. [Crossref]
- Lane DS, Messina CR, Cavanagh MF, Chen JJ (2008) A provider intervention to improve colorectal cancer screening in county health centers. Med Care 46: S109-116. [Crossref]
- Ganz PA, Farmer MM, Belman MJ, Garcia CA, Streja L, et al. (2005) Results of a randomized controlled trial to increase colorectal cancer screening in a managed care health plan. Cancer 104: 2072-2083. [Crossref]
- Walsh JM, Salazar R, Terdiman JP, Gildengorin G, Perez-Stable EJ (2005) Promoting use of colorectal cancer screening tests. Can we change physician behavior? J Gen Intern Med 20: 1097-1101. [Crossref]
- Foley KL, Pockey JR, Helme DW, Song E, Stewart K, et al. Integrating evidence-based tobacco cessation interventions in free medical clinics: opportunities and challenges. Health Promot Pract 13: 687-695. [Crossref]
- Horvath AR (2013) From evidence to best practice in laboratory medicine. Clin Biochem Rev 34: 47-60. [Crossref]
- Rawl SM, Menon U, Burness A, Breslau ES (2012) Interventions to promote colorectal cancer screening: an integrative review. Nurs Outlook 60: 172-181. [Crossref]
- Waldorf B (2006) A continuous multi-dimensional measure of rurality: moving beyond threshold measures. [Accessed 19 June 2020].
- DeNavas-Walt C, Proctor BD, Smith JC (2011) US Census Bureau, Current Population Reports, P60-239, Income, Poverty, and Health Insurance Coverage in the United States: 2010. [Accessed 15 June 2020].
- Fisher JL, Engelhardt JL, Stephens JA, Smith BR, Haydu GG, et al. (2008) Cancer-related Disparities among Residents of Appalachia Ohio. J Health Disparities Res Pract 2: Article 4.
- Bennett KJ, Pumkam C, Bellinger JD, Probst JC (2011) Cancer screening delivery in persistent poverty rural counties. J Prim Care Community Health 2: 240-249. [Crossref]
- Benzeval M, Judge K (2001) Income and health: the time dimension. Soc Sci Med 52: 1371-1390. [Crossref]
- Farrigan T (2020) Rural Poverty & Well-being. Geography of Poverty. United States Department of Agriculture. Economic Research Service. [Accessed 18 June 2020].
- Aue K, Roosen J, Jensen HH (2016) Poverty dynamics in Germany: Evidence on the relationship between persistent poverty and health behavior. Soc Sci Med 153: 62-70. [Crossref]
- Doubeni CA, Jambaulikar GD, Fouayzi H, Robinson SB, Gunter MJ, et al. (2012) Neighborhood socioeconomic status and use of colonoscopy in an insured population--a retrospective cohort study. PLoS One 7: e36392. [Crossref]
- Centers for Disease Control and Prevention (2012) Cancer screening - United States, 2010. MMWR Morb Mortal Wkly Rep 61: 41-45. [Crossref]
- Appalachian Regional Commission (2020) Data Reports. Socioeconomic Data Profile by County. [Accessed 13 June 2020].
- Ren C, Morrow-Jones H (2014) Understanding Poverty Rate Dynamics in Moderately Poor Urban Neighborhoods: A Competitive Perspective. Adv Appl Sociol 4: 40-52.
- Farrigan T (2014) Poverty and deep poverty increasing in rural America. United States Department of Agriculture. Economic Research Service. [Accessed 19 June 2020].
- Chetty R, Stepner M, Abraham S, et al. (2016) The Association Between Income and Life Expectancy in the United States, 2001-2014. JAMA 315: 1750-1766. [Crossref]
- Bishaw A (2011) Areas with concentrated poverty: 2006-2010. United States Census Bureau Report Number ACSBR/10-17. [Accessed 18 June 2020].
- Dakin AL (2011) Self determination: The conceptualization of choice and decision-making by homeless women: Social Work., University of Illinois at Chicago; Fall 2011.
- Beard JR, Tomaska N, Earnest A, Summerhayes R, Morgan G (2009) Influence of socioeconomic and cultural factors on rural health. Aust J Rural Health 17: 10-15. [Crossref]
- Gupta S, Sussman DA, Doubeni CA, Anderson DS, Day L, et al. (2014) Challenges and possible solutions to colorectal cancer screening for the underserved. J Natl Cancer Inst 106: dju032. [Crossref]
- Meissner HI, Klabunde CN, Breen N, Zapka JM (2012) Breast and colorectal cancer screening: U.S. primary care physicians' reports of barriers. Am J Prev Med 43: 584-589. [Crossref]
- O'Malley AS, Beaton E, Yabroff KR, Abramson R, Mandelblatt J (2004) Patient and provider barriers to colorectal cancer screening in the primary care safety-net. Prev Med 39: 56-63. [Crossref]
- Wee CC, McCarthy EP, Phillips RS (2005) Factors associated with colon cancer screening: the role of patient factors and physician counseling. Prev Med 41: 23-29. [Crossref]
- Elam C (2002) Culture, poverty and education in Appalachian Kentucky. Educ Culture XVIII: 10-13.
- Presley C (2013) Cultural Awareness: Enhancing Clinical Experiences in Rural Appalachia. Nurse Educ 38: 223-226. [Crossref]
- Katz ML, Reiter P, Fickle D, Heaner S, Sim C, et al. (2011) Community involvement in the development and feedback about a colorectal cancer screening media campaign in Ohio Appalachia. Health Promot Pract 12: 589-599. [Crossref]
- Paskett ED, Fisher JL, Lengerich EJ, et al. (2011) Disparities in Underserved White Populations: The Case of Cancer-Related Disparities in Appalachia. Oncologist 16: 1072-1081. [Crossref]
- Davis TC, Dolan NC, Ferreira MR, Tomori C, Green KW, et al. (2001) The role of inadequate health literacy skills in colorectal cancer screening. Cancer Invest 19: 193-200. [Crossref]
Editorial Information
Editor-in-Chief
Bingling Wang
Qingdao Institute for Preventive Medicine, China
Article type
Research Article
Publication History
Received: August 03, 2020
Accepted: September 01, 2020
Published: September 08, 2020
Copyright
©2020 Radhakrishnan K. This is an open-access article distributed under the terms of the Creative Commons Attribution License, which permits unrestricted use, distribution, and reproduction in any medium, provided the original author and source are credited.
Citation
Radhakrishnan K, Slone S, Shelton B, Jarrett T, Pearce K, et al. (2020) Persistent poverty reduces effectiveness of academic detailing in increasing screening colonoscopy in Appalachian Kentucky. Arch Epid Pub Health 2: DOI: 10.15761/AEPH.1000119.