Introduction: There are several measures towards reducing the burden of paediatric HIV/AIDS globally. However, Sub-Saharan Africa and most importantly Nigeria account for a significant burden of children living with HIV with approximately a quarter of the children being on ARTs.
In order to end the Paediatric HIV epidemic, there is need to continue to evaluate the treatment outcome, so as strengthen existing measures and develop new effective strategies. This study aimed to review the treatment outcome of children enrolled at the Nigerian Institute of Medical Research [NIMR] HIV treatment and care centre in Lagos.
Methodology : A retrospective study design to evaluate, treatment outcomes among children living with HIV who had received care between 2006 and 2017 at NIMR a foremost quaternary health care centre and pacesetter in the management of and research into HIV. Detailed information on the children was retrieved from the electronic medical records of the HIV care centre over a 12 year period [January 2006-December 2017]. Data obtained were analyzed using the statistical package for social science [SPSS] version 22.0.
Results: A total of 1,079 children were enrolled in care over the twelve-year period with a M: F ratio of1.1:1, 62.9% of the cases were children aged 0-4 years and 64.7% of the children presented with WHO stage 1&2 disease state. At the end of the review period, 508 (47.1%) remain in care, while 33.8% and 6.8% of the children enrolled were lost to follow-up and dead respectively. Unfavorable outcome was characterized by malnutrition anaemia, (Hb < 11.0 g/dL), WHO Stage 4 disease, HIV RNA viral load ≥ 100,000 copies/ml and Hepatitis co-morbidity at enrollment.
Conclusion: In children with HIV in Lagos, Nigeria, malnutrition, anaemia and advanced disease stage at presentation are associated with an unfavorable outcome. Loss to follow up remains a significant concern and every effort should be made to track and retain children in care for optimal outcome.
Paediatric human immunodeficiency virus (HIV) infection is of global concern with approximately 1.7 million [1.3-2.2 million] children living with HIV worldwide. Ninety percent of the affected children residing in sub Saharan Africa [1].
Several measures have been initiated to reduce the burden of paediatric HIV/AIDS; This includes increased coverage of prevention-of-mother-to child-transmission [PMTCT] [provision of ARTs to pregnant &breastfeeding mothers, Nevirapine prophylaxis for perinatal exposed newborns] [2], increased availability and accessibility of antiretroviral therapy [ART] to children living with HIV [3]. Other measures include integrating HIV care services into the algorithm of primary and secondary level of care in the country [4], among other survival and health promoting strategies. These efforts combined with improved adherence has contributed to achieving virological suppression as well as reduce the burden of paediatric HIV.
Nigeria has the second largest HIV epidemic in the world and one of the highest rates of new infection in sub-Saharan Africa. An estimated 220,000 children (0-14 years) living with HIV and about 1.8 million children were orphaned by AIDS, with far reaching devastating impact on health, safety and well-being of the Nigerian populace, with vertical transmission being the commonest route of HIV acquisition in children [5]. Strengthening the PMTCT programme has been shown to significantly reduce new paediatric HIV infections to almost zero, however, Nigeria still has the highest burden of childhood HIV and approximately only 26% are on ART treatment [6].
In order to attain the 90:90:90 goal of HIV care set by UNAIDS in 2014 [5], there is a need to review the treatment outcome of the paediatric HIV in the country. This would assist in the process of strengthening existing measures and developing new and effective strategies to end the Paediatric HIV epidemic.
This study aims to determine the treatment outcome of children enrolled in the NIMR HIV treatment and care centre in Lagos.
Study design: A retrospective cohort study design to evaluate the treatment outcomes among children living with HIV who had received care between 2006 and 2017.
Study setting: The data was collected from the data base of the clinical sciences department of the Nigerian Institute of Medical Research [NIMR]. Nigerian Institute of Medical Research is a foremost quaternary health care centre and pacesetter in the management and research into HIV care in Nigeria. The HIV care and management started at NIMR in 2002 but the Paediatric HIV care services started in 2004. The institute has since then been at the fore front of channeling the path for the care of people living with HIV.
The electronic medical data base of all enrolled HIV infected children between January 2006 and December 2017 were reviewed. Data extracted included sex, age at HIV diagnosis, socio-economic class, parental HIV status, orphan status and clinic outcomes (still in care, dead or lost to follow up (LTFU), referred/transferred out).
Treatment Outcome could be classified as favourable or unfavourable. Favourable outcome was defined as children still in current care while unfavourable outcome was defined as children who had died or been lost to follow up. The children who were transferred out and with voluntary withdrawal were excluded from analysis of treatment outcome. Lost to follow-up was defined as children who failed to return back to care after 6 months of first visit.
Study population: All HIV-infected children below 15 years of age who were enrolled into the program from 2006 and followed up to 2017 were included in the analysis.
Data analysis: Retrieved data were analyzed using the Statistical Package for Social Sciences (SPSS) version 22.0. Descriptive statistics (mean and median) were used to summarize quantitative variables (age of study participants, age at HIV diagnosis). Student t-test and Analysis of Variance (ANOVA) were used to compare the means of continuous variables while Chi-square and Fisher’s exact tests were used to test for significant association of categorical variables. All statistical tests where p-value was less than 0.05 considered statistically significant.
Social-demographic characteristics
A total of 1,079 children were enrolled within the 12 year period (2006-2017), out of which 558 (51.7%) were males while 521 (48.3%) were female. Majority of children enrolled were between the age 0-4 years (62%), were in the lower socioeconomic classes of 3-5 (75.4%) and both parents alive (65.7%). There was a decreasing trend of enrollment over the study period (Figure 1) (Table 1).
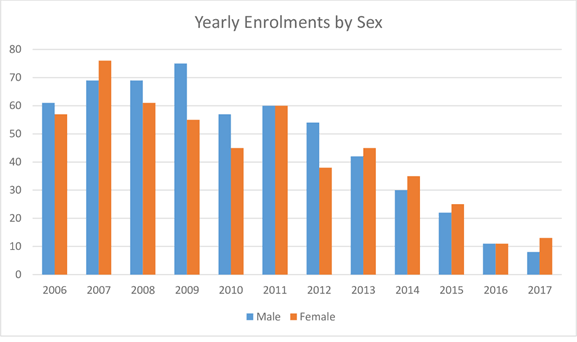
Figure 1. Pattern of children enrollment over 12 years
Table 1. Socio-demographic characteristics of children enrolled
CHARACTERISITICS |
FREQUENCY n (%)
N=1079 |
AGE DISTRIBUTION [YEARS]
0-4
5-9
10-14 |
679 (62.9%)
267 (24.8%)
133 (12.3%) |
GENDER
MALE
FEMALE
MALE: FEMALE RATIO |
558 (51.7%)
521 (48.3%)
1.1:1 |
SOCIO-ECONOMIC CLASS [PARENTS]
I & II
III
IV & V |
266 (24.6%)
416 (38.6%)
397 (36.8%) |
ORPHAN STATUS
Double
Maternal
Paternal
Both Parents Alive |
71 (6.6%)
183 (17%)
116 (10.7%)
709 (65.7%) |
Clinical and laboratory characteristic at enrollment
At enrollment,majority of the children were at WHO clinical stages 1 and 2 (64.7%), with viral load ≥100,00 copies/ml (58.4%), CD4 lymphocyte count ≥ 500 cells/mm3 (58.5%), and haemoglobin {Hb} less than 11 g/dl (83.4%) (Table 2).
Table 2. Clinical and laboratory characteristics of enrolled children
Characteristic |
Frequency (%)/Median (IQR) |
WHO Clinical Stage:
Median (IQR)
WHO Stage Groups:
1 & 2
3 & 4
Total |
2 (2-3)
348 (64.7)
190 (35.3)
538 (100.0) |
Viral Load (copies/ml):
Median (IQR)
VL Groups:
<100,000
≥100,000
Total |
158,054 (23,701-572,050)
278 (41.6)
390 (58.4)
668 (100.0) |
CD4 Count (cells/µL):
Median (IQR)
CD4 Groups:
<500
≥500
Total |
613 (316.5-10618.5)
381 (41.5)
538 (58.5)
919 (100.0) |
CD4 %:
Median (IQR)
CD4% Groups
<15%
≥15%
Total |
15.8 (9.2-24.5)
345 (46.4)
398 (53.6)
743 (100.0) |
Hb (g/dL):
Median (IQR)
Hb Groups:
<11
≥11
Total |
9.5 (8.5-10.5)
826 (83.4)
164 (16,6)
990 (100.0) |
Hepatitis Coinfection:
HBV
HCV |
23/555=4.1%
10/542=1.8% |
Enrollment characteristic with respect to age group
Children aged ≥ 5-years were significantly more likely to be from lower socioeconomic class, orphaned, present with more severe disease (HIV RNA VL ≥ 100,000 copies/ml, and CD4 count less than 500 cells/µL), while children aged ≤ 4-years were significantly more likely to present with anaemia (Hb < 11 g/dL). There was no significant difference in level of disease severity [viral load, CD4] and nutritional status among the children (0-4) year and (5-14) year age groups. However, children aged 10-14 years (adolescents) were significantly more likely to be undernourished, enrolled in severe disease state compared to those aged 5-9 years (OR 2.4 [95% CI = 1.5 - 2.7], p = 0.0001 and OR 2.9 [95% CI = 1.4 - 6.1], p = 0.003 respectively). Adolescents were also significantly more likely to present with severe disease compared to younger children aged less than 5 years (OR 2.0 [95% CI = 1.0-3.8], p = 0.04 (Tables 3 and 4).
Table 3. Enrollment characteristics with respect to age
Characteristic |
Age Group (years) |
OR (95% CI) |
P value |
0 – 4 |
5 – 14 |
Sex:
Male
Female
Total |
362 (53.3)
317 (46.7)
679 (100.0) |
196 (49.4)
204 (50.6)
400 (100.0) |
1.2 (0.9 – 1.5) |
0.17 |
Socioeconomic Class:
I & II
III - V
Total |
54 (29.7)
128 (70.3)
182 (100.0) |
11 (13.9)
68 (86.1)
79 (100.0) |
2.6 (1.3 – 5.3) |
0.007 |
Orphan Status:
Yes
No
Total |
42 (22.7)
143 (77.3)
185 (100.0) |
51 (54.2)
37 (45.8)
88 (100.0) |
0.2 (0.1 – 0.4) |
<0.0001 |
Nutritional Status:
Well nourished
Undernourished
Total |
390 (64.6)
214 (33.4)
604 (100.0) |
263 (69.6)
115 (30.4)
378 (100.0) |
0.8 (0.6 – 1.0) |
0.10 |
WHO Disease Stage:
1 & 2
3 & 4
Total |
134 (52.3)
122 (47.7)
256 (100.0) |
79 (53.7)
68 (46.3)
147 (100.0) |
0.9 (0.6 – 1.4) |
0.78 |
Table 4. Enrollment characteristics with respect to age
Characteristic |
Age Group (years) |
OR (95% CI) |
P value |
0 – 4 |
5 – 14 |
HIV RNA VL (copies/ml) :
<100,000
≥100,000
Total |
141 (34.9)
263 (65.1)
404 (100.0) |
137 (51.9)
127 (48.1)
264 (100.0) |
0.5 (0.4 – 0.7) |
<0.0001 |
CD4 Count (cells/µL):
<500
≥500
Total |
153 (27.1)
412 (72.9)
565 (100.0) |
228 (64.4)
126 (35.6)
354 (100.0) |
0.2 (0.2 – 0.3) |
<0.0001 |
Hb (g/dL):
<11
≥11
Total |
535 (87.0)
80 (13.0)
615 (100.0) |
291 (77.6)
84 (22.4)
375 (100.0) |
1.9 (1.4 – 2.7) |
0.0001 |
Outcome of children enrolled
As at the end of December 2017; 47.1% were in care, while 120 (10.6%), 74 (6.8%), 12 (1.1%), and 365 (33.8%), have been transferred, died, requested voluntary withdrawal and lost to follow up (LTFU) respectively. Figure II.
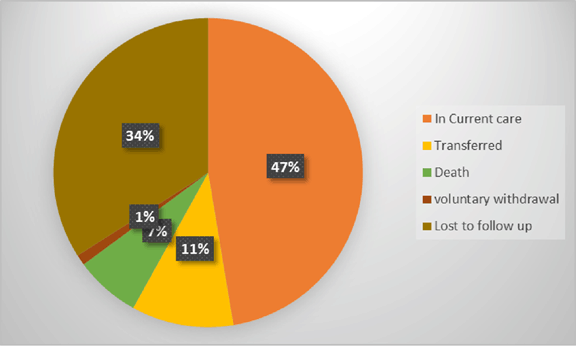
Figure 2. Treatment outcomes
One hundred and fourteen of the 120 children were transferred to other centres while 6 (5%) were adopted outside the country. Seventy-five of the 508 children in care have transited to the adult ART service of our facility.
Table 5 depicts the outcome of enrolled children was broadly classified as favourable or unfavourable. Unfavourable outcome was associated with malnourished status, anaemia (Hb< 11.0 g/dL), WHO stage 4, HIV RNA viral load ≥ 100,000 copies/ml and Hepatitis co-morbidity.
Table 5. Outcome of enrolled children
Characteristic |
Favourable |
Unfavourable |
OR (95% CI) |
P value |
Sex:
Male
Female
Total |
270 (52.5)
244 (47.5)
514 (100.0) |
224 (51.1)
214 (48.9)
438 (100.0) |
1.1 (0.8 – 1.4) |
0.67 |
Age Group (years):
0- 4
5 - 9
10 -14
Total |
316 (61.5)
141 (27.4)
57 (10.1)
514 (100.0) |
282 (64.4)
101 (23.1)
55 (12.5) [Ref]
438 (100.0) |
0.8 (0.6 – 1.1) |
0.15 |
Socioeconomic Class:
I & II
III - V
Total |
49 (24.4)
152 (73.6)
201 (100.0) |
17 (25.4)
50 (74.6)
67 (100.0) |
0.9 (0.5 – 1.8) |
0.87 |
Orphan Status:
Yes
No
Total |
69 (32.4)
144 (67.6)
213 (100.0) |
19 (30.2)
44 (69.8)
63 (100.0) |
1.1 (0.6 – 2.0 |
0.74 |
Nutritional Status:
Well nourished
Undernourished
Total |
328 (71.1)
133 (28.9)
461 (100.0) |
232 (58.0)
168 (42.0)
400 (100.0) |
1.8 (1.3 – 2.4) |
<0.001 |
WHO Disease Stage:
1 - 3
4
Total |
188 (95.9)
8 (4.1)
196 (100.0) |
141 (87.0)
21 (13.0)
162 (100.0) |
3.5 (1.5 – 8.1) |
0.002 |
HIV RNA VL (copies/ml) :
<100,000
≥100,000
Total |
148 (45.7)
176 (53.3)
324 (100.0) |
94 (36.4)
164 (63.6)
258 (100.0) |
1.5 (1.0 – 2.1) |
0.02 |
CD4 Count (cells/µL):
<500
≥500
Total |
185
277
462 (100.0) |
154
185
339 (100.0) |
0.8 (0.6 – 1.1) |
0.13 |
CD4%:
<15
≥15
Total |
169 (45.1)
206 (54.9)
375 (100.0) |
146 (48.0)
158 (52.0)
304 (100.0) |
0.9 (0.7 – 1.2) |
0.44 |
Hb (g/dL): <10
≥10
Total |
293
211
504 (100.0) |
237
120
357 (100.0) |
0.7 (0.5 – 0.9) |
0.01 |
HIV/Hepatitis Comorbidity:
Yes
No
Total |
12 (4.3)
269 (95.7)
281 (100.0) |
19 (8.8)
197 (91.2)
216 (100.0) |
0.4 (0.2 – 0.9 |
0.04 |
In this 12-year review, the age and sex distribution of paediatric HIV in this study did not differ from previous works with children aged ≤ 5 years and male commonly affected [7-11]. This finding could be explained by the rapid progression of HIV in younger children and therefore children are more likely to be enrolled into care after they have developed AIDS [12].
The reduced client enrollment at the centre over the years is in keeping with the declining incidence of HIV in Nigeria and globally [5,13]. This could also a reflection of decentralization of care for people living with HIV as more centres are now equipped with capacity for management of HIV in children, in addition to the effectiveness of the prevention of mother-to-child transmission [PMTCT] programs among other initiatives implemented towards combating the scourge of HIV/AIDS.
At enrollment the median laboratory parameters were haemoglobin level, viral load and CD4 count of 9.5 g/dl, 158,054 copies/ml and 613 cells/µl respectively. These features at entry are understandable because most children are commonly brought into clinic when symptoms and signs are present. This is in conformity with previous works in Africa and beyond [8,9,14]. Although our centre provides essentially outpatient services, other facilities with in-patient paediatric HIV services have reported appalling clinical and immunological manifestations [7,10,11,15].
The low haemoglobin levels in children predominantly those below 5 years at presentation is in unison with prior reports depicting anaemia as a common haematological manifestation in HIV/AIDs irrespective of age in resource-limited setting [16,17]. The association between low socioeconomic class, orphan children and severe disease is in concordance with previous findings [18-21]. This buttresses the bidirectional association between HIV and socio-economic class; HIV/AIDS is submerged within social and economic inequity with high burden among children, families and societies with low socio-economic status. The individual or families in the low socio-economic background have limited access to health information including HIV care services among other challenges facing them [22-24]. Furthermore, the socio-economic status remains a key factor in predicting the quality of life and outcomes of people living with the disease.
Delayed diagnosis and presentation in severe disease state among the adolescents in this study is in concordance with report from previous studies [25,26]. In addition, challenges with acceptance of their HIV status, the need for life long ART treatment and the questionable prospect of future outcomes with respect to their health, education, social and relationship status remains an evolving obstacle for adherence to care [27].
The retention of children in our facility was 47.1%, this low retention rate could be alluded to the absence of in-patient services. Other reasons include the multi-centre diversity of HIV care in Lagos and decentralization policy on HIV treatment. However, the present retention rate is low compared to 65.3% reported by Ubesie et al. [28] in South East Nigeria, 56% by Mutanga et al. [29] in Zambia, 84.7% - 94.8% [30] in Uganda and 78-96% reported by McNairy et al. [31] in a four country national review involving Kenya, Mozambique, Rwanda and Tanzania. The retention rate in these facilities were alluded to the robust and comprehensive nature of their services, presence of technical support and the adoption of a general model by the countries evaluated.
The magnitude of loss to follow-up [LTFU] 33.8% is reflective of our low retention rate. The clinical outcomes of these children are unknown, though a significant proportion of the client might have moved close to their residence during the decentralization process or an ample proportion of the children might actually be dead considering the associated characteristics of anaemia, severe HIV disease (WHO Stage 4) and co-morbidities. Contact tracing was not successful to ascertain reasons why the children defaulted from care. The finding in this review is in concordance with 2.6-57% recorded by Zurcher et al. [32] in an extensive review in sub- Saharan Africa. However, our finding is higher compared to 23.7% reported by Ubesie et al. [28] in Southeast Nigeria and 22% by McNairy et al. [31] in a review of four other African countries receiving support from ICAP. While McNairy et al. [31] alluded low LTFU rate to the robust nature of the program in a small population of children living with HIV; thus ensuring time for active patient follow-up. Ubesie et al. [28] claimed low LTFU could be a direct reflection of the population of client reviewed (555 children living with HIV) which was lower compared to our centre. On the contrary a higher LTFU rate of 50% was reported by Yu et al. [33], in Malawi, though within reported attrition LTFU rates across sub Saharan Africa with death being the major reason for the high rate upon contact tracing of the children.
The attrition due to confirmed death is approximately 7% in the present 12-year review. The reason for the low mortality rate reported by our centre could be because our services are essentially out-patient care, thus, the high incidence of children LTFU whom the primary cause could have been to death could not be ascertained. This finding is in consonance with mortality trends of between 5-7% documented by Mutanga et al. [29] in Zambia, McNairy et al. [31] in a four nations’ review, Brophy et al. [34] in Malawi and by Ahmed and Lemma [35] in a systemic review and meta-analysis of mortality among paediatric patients in sub-Saharan Africa. However, a higher death rate of 18.2% was reported in Kano Northern Nigeria by Obiagwu et al. [7] whom the children living with HIV at enrollment were predominantly in-patient with worse clinical presentations. Furthermore, in this current study the mortality burden of 7% is in discordance with 4.2% documented in Southeast Nigeria over a 10-year review, [29] The reason for the variance could be alluded to the reduced number of children living with HIV in the report from Southeast Nigeria.
The transfer of children living with HIV from our centre is a reflection of the plethora of available HIV care centres in the Lagos environs. In addition to the ongoing decentralization of care for people living with HIV, more centres are equipped with capacity for management of HIV in children and the relocation of caregiver for variable reasons. However, the number of children transferred out of care in our centre is higher when compared to 6.8%, 9%, by Ubesie et al. [28] in Southeast Nigeria in a 10-year review and Minn et al. [36] in Myanmar in a 12-year cohort analysis respectively. Although, higher transfers [20%] were reported in Zambia by Mutanga et al. [29], the reason alluded to this transfers were because the nations’ Ministry of Health has a policy that encourages people to seek care at the closest health facility to their homes.
In conclusion, the review shows a reduction in the prevalence of HIV over the years with low retention of children in care and a significant proportion of children transferred out of care to other centres. LTFU remains a challenge in the care of children living with HIV.
Our sincere appreciation to the Nursing team, Pharmacy unit, Counselling unit, Data & Medical records team, colleagues at the Centre for Human Virology & Genomic [CHVG] and the Clinical Diagnostic Laboratory [CDL] of the Institute for their immense contribution towards the success of the paediatric HIV care services over the years.
References
- Global and regional trends July 2019-UNICEF DATA. https://data.unicef.org/topic/hivaids/global-regional-trends/. Assessed November 2019.
- WHO Antiretroviral Drugs for treating women and preventing HIV infection in infants: recommendation for a public health approach. Geneva: WHO; 2010.
- Brady MT, Oleske JM, Williams PL, Elgie C, Mofenson LM, et al. (2010) Declines in mortality rates and changes in causes of death in HIV-1 infected children during HAART era. Pediatric AIDS Clinical Trials. J Acquir Defic Syndrome 53: 86-94.
- UNAIDS Report on the global HIV/AIDS epidemic 2002. Geneva: UNAIDS;2002.
- NACA (2017) National strategic framework on HIV and AIDS: National agency for control of AIDS. 2017-2021.
- UNAIDS. HIV Factsheet 2015. Available at http://www.unaids.org/sites/default/files/media_asset/20150714_FS_MDG6_Report_en-pdf/.
- Obiagwu PN, Hassan-Hanga F, Ibrahim M (2013) Paediatric HIV in Kano, Nigeria. NJCP 16: 521-525.
- Sando D, Spiegelman D, Machumi L, Mwanyika-Sando M, Aris E, et al. (2015) Time trends of baseline demographics and clinical characteristics of HIV infected children enrolled in care and treatment service in Dar es Salaam, Tanzania. BMC Infectious Diseases 15: 1-6.
- Adedimeji A, Edmonds A, Hoover D, Shi Q, Sinayobye J, et al. (2017) Characteristics of HIV-infected children at enrollment into care and at antiretroviral therapy initiation in central Africa. PLoS ONE 12: e0169871
- Oniyangi O, Awani B, Iregbu KC (2006) Pattern of Paediatric HIV/AIDs as seen at the National Hospital Abuja, Nigeria. NJCP 9: 153-158.
- Onankpa B, Awede L, Ibitoye P, Idowu P (2008) Pattern of paediatric HIV/AIDs: A five-year experience in a tertiary hospital. Natl Med Assc 100: 821-825.
- Spiral R, Lepage P, Msellati P, Van De Perre P, Leroy V, et al. (1999) Natural history of human immunodeficiency virus type 1 infection in children. A five-year prospective study in Rwanda mother-to-child HIV1: Transmission group. Paediatric.
- UNAIDS (2018) Global AIDS Update: Miles to go-closing gaps, breaking barriers, righting injustices; July 2018. Joint United Nations Programme on HIV/AIDS; Core Epidemiology Slides July 2018. http//aidsinfo.unaids.org/.
- Poudel P, Pokharel R, Chitalinga M, Chuadhary S (2004) Profile of HIV infected children: A Hospital based study in Eastern Nepal. Asian Pac J Trop Dis 4: 169-175.
- Ogunbosi BO, Oladokun RE, Brown BJ, Osinusi KI (2011) Prevalence and clinical pattern of paediatric HIV infection at the University College Hospital, Ibadan, Nigeria: a prospective cross-sectional study. Italian Journal of Paediatrics 37: 1-6.
- Ahumareze RE, Rankin J, David A, Wapmuk A, Disu E, et al. (2016) Prevalence of anaemia and the relationship between haemoglobin concentration and CD4 count in HIV positive children on highly active antiretroviral therapy (HAART) in Lagos, Nigeria. Curr Pediatr Res 20: 29-36.
- Calis JCB, van Hensbroek MB, de Hann RJ, Moons P, Brabin BJ, et al. (2008) HIV-associated anemia in children: a systemic review of global perspective. AIDS.
- Oladokun R, Brown B, Aiyetan P, Ayodele O, Osinusi K (2009) Comparison of socio-demographic and clinical characteristics of orphans and non-orphans among HIV-positive children in Ibadan, Nigeria. International Journal of Infectious Diseases 13: 462-468.
- Chauhan RC, Singh N (2014) Socio-demographic profile of HIV infected children assessing care at the pediatric clinic of a tertiary hospital in North India. Int J Contemporary Pediatrics 1: 20-23.
- Onyire NB, Onyinye UA, Daniyan OW, Orji ML (2016) Socio-demographic characteristics of pediatric human immunodeficiency virus-positive patients in Federal Teaching Hospital, Abakaliki, Ebonyi State, Nigeria. Afr J Med Sci 15: 46-49.
- HIV/AIDS and Socioeconomic Status. Publication by American Psychological Association. Available at http://www.apa.org/pi/ses/resources/publication/factsheet-hiv-aids-aspx. Assessed Nov 2019.
- Social Inequalities Associated with late HIV Diagnosis and Delayed HIV treatment -European study. Available from http://www.aidsmap.com/Social-inequalities-associated-with-late-HIV-diagnosis-and-delayed-HIV-treatment-European-study.
- Young S, Wheeler AC, McCoy SI, Weiser SD (2014) A review of role of food security in adherence to care and treatment among adult and pediatric populations living with HIV and AIDS. AIDS and Behaviour 18: S505-S515.
- Pellowski JA, Kalichman SC, Mathew KA, Adler N (2013) A Pandemic of the poor: Social disadvantage and the US HIV epidemic. American Psychologist 68: 197-209.
- Hu X, Liang B, Zhou C, Jiang J, Huang J, et al. (2019) HIV late presentation and advanced HIV disease among patients newly diagnosed HIV/AIDS in Southwestern China: a large-scale cross-sectional study. AIDS Res Ther 16: 1-10.
- Lowenthal ED, Bakeeera-Kitaka S, Maurkutira T, Chapman J, Goldrath K, et al. (2014) Perinatally acquired HIV infection in adolescent from sub-Saharan Africa: a review of emerging challenges. Lancet Infect Dis 14: 627-639.
- Naswa S, Marfatia YS (2010) Adolescent HIV/AIDs: Issues and challenges. Indian J Sex Transm Dis AIDS 31: 1-10.
- Ubesie AC, Iloh KK, Ayuk CA, Ibeziako SN, Emodi JI, et al. (2017) Outcomes of Paediatrics HIV care at the University of Nigeria Teaching Hospital, Ituku-Ozalla, Enugu after ten years of service. Niger J Paediatr 44: 22-25.
- Mutanga JN, Mutembo S, Ezeamama AE, Song X, Fubisha RC, et al. (2019) Long-term survival outcomes of HIV infected children receiving antiretroviral therapy: an observational study from Zambia (2003-2015). BMC Public Health 19: 1-12.
- Massavon W, Lundin R, Costenaro P, Penazzato M, Namisi PC, et. al. (2013) Attrition and loss to follow-up Among Children and Adolescents in a Community Home-Based Care HIV Programme in Uganda. Pediat Therapeut 3: 1-7.
- McNairy ML, Lamb MR, Carter RJ, Fayorsey R, Tene G, et al. (2013) Retention of HIV-infected children on antiretroviral treatment in HIV care and treatment programs in Kenya, Mozambique, Rwanda and Tanzania. J Acquir Immune Defic Syr 62: e70-e82
- Zurcher K, Mooser A, Andreregg N, Tymejczyk O, Couvillon MJ, et al. (2017) Outcome of HIV-positive patient loss to follow-up in African treatment programmes. Trop Med Int Health 22: 375-378.
- Yu JKL, Chen SCC, Wang KY, Chang CS (2007) Treatment outcomes for patient on antiretroviral therapy who are “lost to follow-up” in Malawi. Bulletin of the World Health Organization 85: 550-554.
- Brophy JC, Hawkes MT, Mwinjiwa E, Mateyu G, Sodhi SK, et al. (2016) Survival outcomes in a paediatric antiretroviral treatment cohort in southern Malawi. PLoS One 11: e0165772.
- Ahmed I, Lemma S (2019) Mortality among pediatric patients on HIV treatment in sub-Saharan African countries: a systemic review and meta-analysis. BMC Public Health 19: 1-13.
- Minn AC, Kyaw NTT, Aung TK, Mon OM., Htun T, et al. (2018) Attrition among HIV positive children enrolled under integrated HIV care programme in Myanmar: 12 years cohort analysis. Global Health Action 11: 1-11.