Abstract
A movement-based learning treatment, called coordination dynamics therapy (CDT), was developed with which it is possible to partly repair the injured, malfunctioning or degenerating CNS. With five case reports it is demonstrated that spinal cord and brain injuries can partly be repaired by administering CDT. This treatment became possible because of a new development in human electro-neurophysiology with which it was possible to analyze the CNS self-organization of neuronal networks at the neuron level under physiologic and pathologic conditions. By using the System Theory of Pattern Formation, a correlation between neural network organization patterns at the neuron level and movement patterns became possible. CDT repairs CNS functioning by improving the impaired phase and frequency coordination of neuron firing when exercising on a special CDT device and by plasticity which means that other brain parts take function over from the damaged ones by exercising movement automatisms and other specific movements. This neural repair treatment is that powerful that even a coma patient who lost approximately 50% of his brain tissue could be brought out of coma with five years of CDT.
Keywords
Human, brain repair, movement-based learning, single-nerve fiber action potential recording method, single-motor unit surface electromyography, System Theory of Pattern Formation
Introduction
It has been shown that coordination dynamics therapy (CDT) can improve or repair central nervous system (CNS) functioning after stroke, traumatic brain injury, spinal cord injury, cerebellar injury, cerebral palsy, hypoxic brain injury, in Parkinson’s disease, spina bifida (myelomeningocele) and scoliosis [1-19]. Speech had been induced and improved in a patient with severe cerebral palsy and urinary bladder functions were repaired in patients with spinal cord injury [1,16]. In patients with cancer, especially breast cancer, cancer growth inhibition could be achieved via CDT [24]. A partial repair of the brain in a coma patient who lost approximately 50% of the brain is given in case report 5. The beginning of therapy of the coma patient was given in [25]. Details of human neurophysiology and movement-based learning for repairing the neural networks of the human central nervous system (CNS) have been summarized in three books and an extended abstract [1-3,19]. A short introduction to the theory of CDT is given in the Method.
With the development of a new recording technique, the single-nerve fiber action potential recording method [20] and a further development of the surface electromyography (sEMG), it became possible to analyze human CNS functioning at the neuron and muscle levels under natural conditions. A classification scheme of human peripheral nerve fibers was constructed to allow the identification of the nerve fibers from which was recorded [21]. Animal classifications do not hold in human. Three kinds of premotor spinal oscillators were found, which contribute to the understanding of tremor in patients with Parkinson’s disease. The most important finding was that the self-organization of human neuronal networks is taking place by phase and frequency coordination [22]. By correlating the electro-neurophysiologic measurements to the System Theory of Pattern Formation, the quality of CNS functioning can be measured by a single-value, the coordination dynamics value [23]. The quality of CNS functioning can thus be measured non-invasively in patients with CNS injury when they exercise on a special CDT device. Repair improvements can be followed up with therapy by a single value.
With every injury, degeneration or malformation the phase and frequency coordination become impaired. This impairment of CNS organization can be improved when the patient is exercising on a special CDT device. CDT repairs the injured or malfunctioning networks by improving the phase and frequency coordination and by plasticity in the way that healthy networks parts take function over from the damaged ones. This plasticity is induced by training automatisms, like creeping, crawling, walking and running, old-learned movements and other specific patterns. Since the CNS can be seen as a large neuronal network, there is learning transfer from movements to vegetative functions like urinary bladder and higher mental functions [15].
In five case reports the power of CDT to repair the human CNS is demonstrated. In a girl with spinal cord injury walking and urinary bladder functions were partly repaired [16]. A cerebral palsy girl learned to walk, write and speak better, and her higher mental functions improved. Two patients with severe traumatic brain injury improved their brain functioning to be able to walk and run again and finish their university studies. In the last case report it is shown that with CDT, administered at the limit for five years, a patient who lost 50% of his brain tissue and being in the permanent coma could be brought out-of-coma [26].
Method
Coordination dynamics therapy
Treatment strategy in medicine: New treatment in medicine often starts with the anatomy, followed by the clarification of the physiologic and pathologic functioning, in this case of the nervous system, and hopefully is finished then by the development of treatment to cure. Progress in treatment is further often achieved when new recording methods are developed. In this case the treatment of patients with spinal cord and brain injury was developed on the basis of knowledge achieved mainly with the single-nerve-fiber action potential recording method. The ‘phase and frequency coordination of human CNS organization’ and the ‘oscillatory firing of premotor spinal oscillators’ was found when analyzing natural impulse patterns at the single-neuron level. Identifying the natural activity patterns in a set of single afferent and efferent fibers under physiologic and pathophysiologic conditions, treatment to repair CNS injury could be developed. A very short introduction to this human neurophysiology will be given.
Anatomy of the lower human spinal cord: The development of the single-nerve fiber action potential recording method was possible because of the unique anatomical landscape of the human spinal canal. Because of the Ascensus of the spinal cord, the lumbosacral nerve roots became very long and form the cauda equina (Figure 1,2). Since the caudal sacral nerve roots are very thin and nerve roots are only ensheathed by a thin layer of cells, they are ideal for recording single-nerve fiber action potentials (APs) from undissected nerve roots with two pairs of platin wire electrodes. Since humans have no tail, continence (mainly S2 to S5) and sexual functions are mainly located in the conus medullaris only. Those functions are therefore represented in the lower sacral nerve roots and they are not intermingled with tail functions as they are for example in rats, cats and dogs.
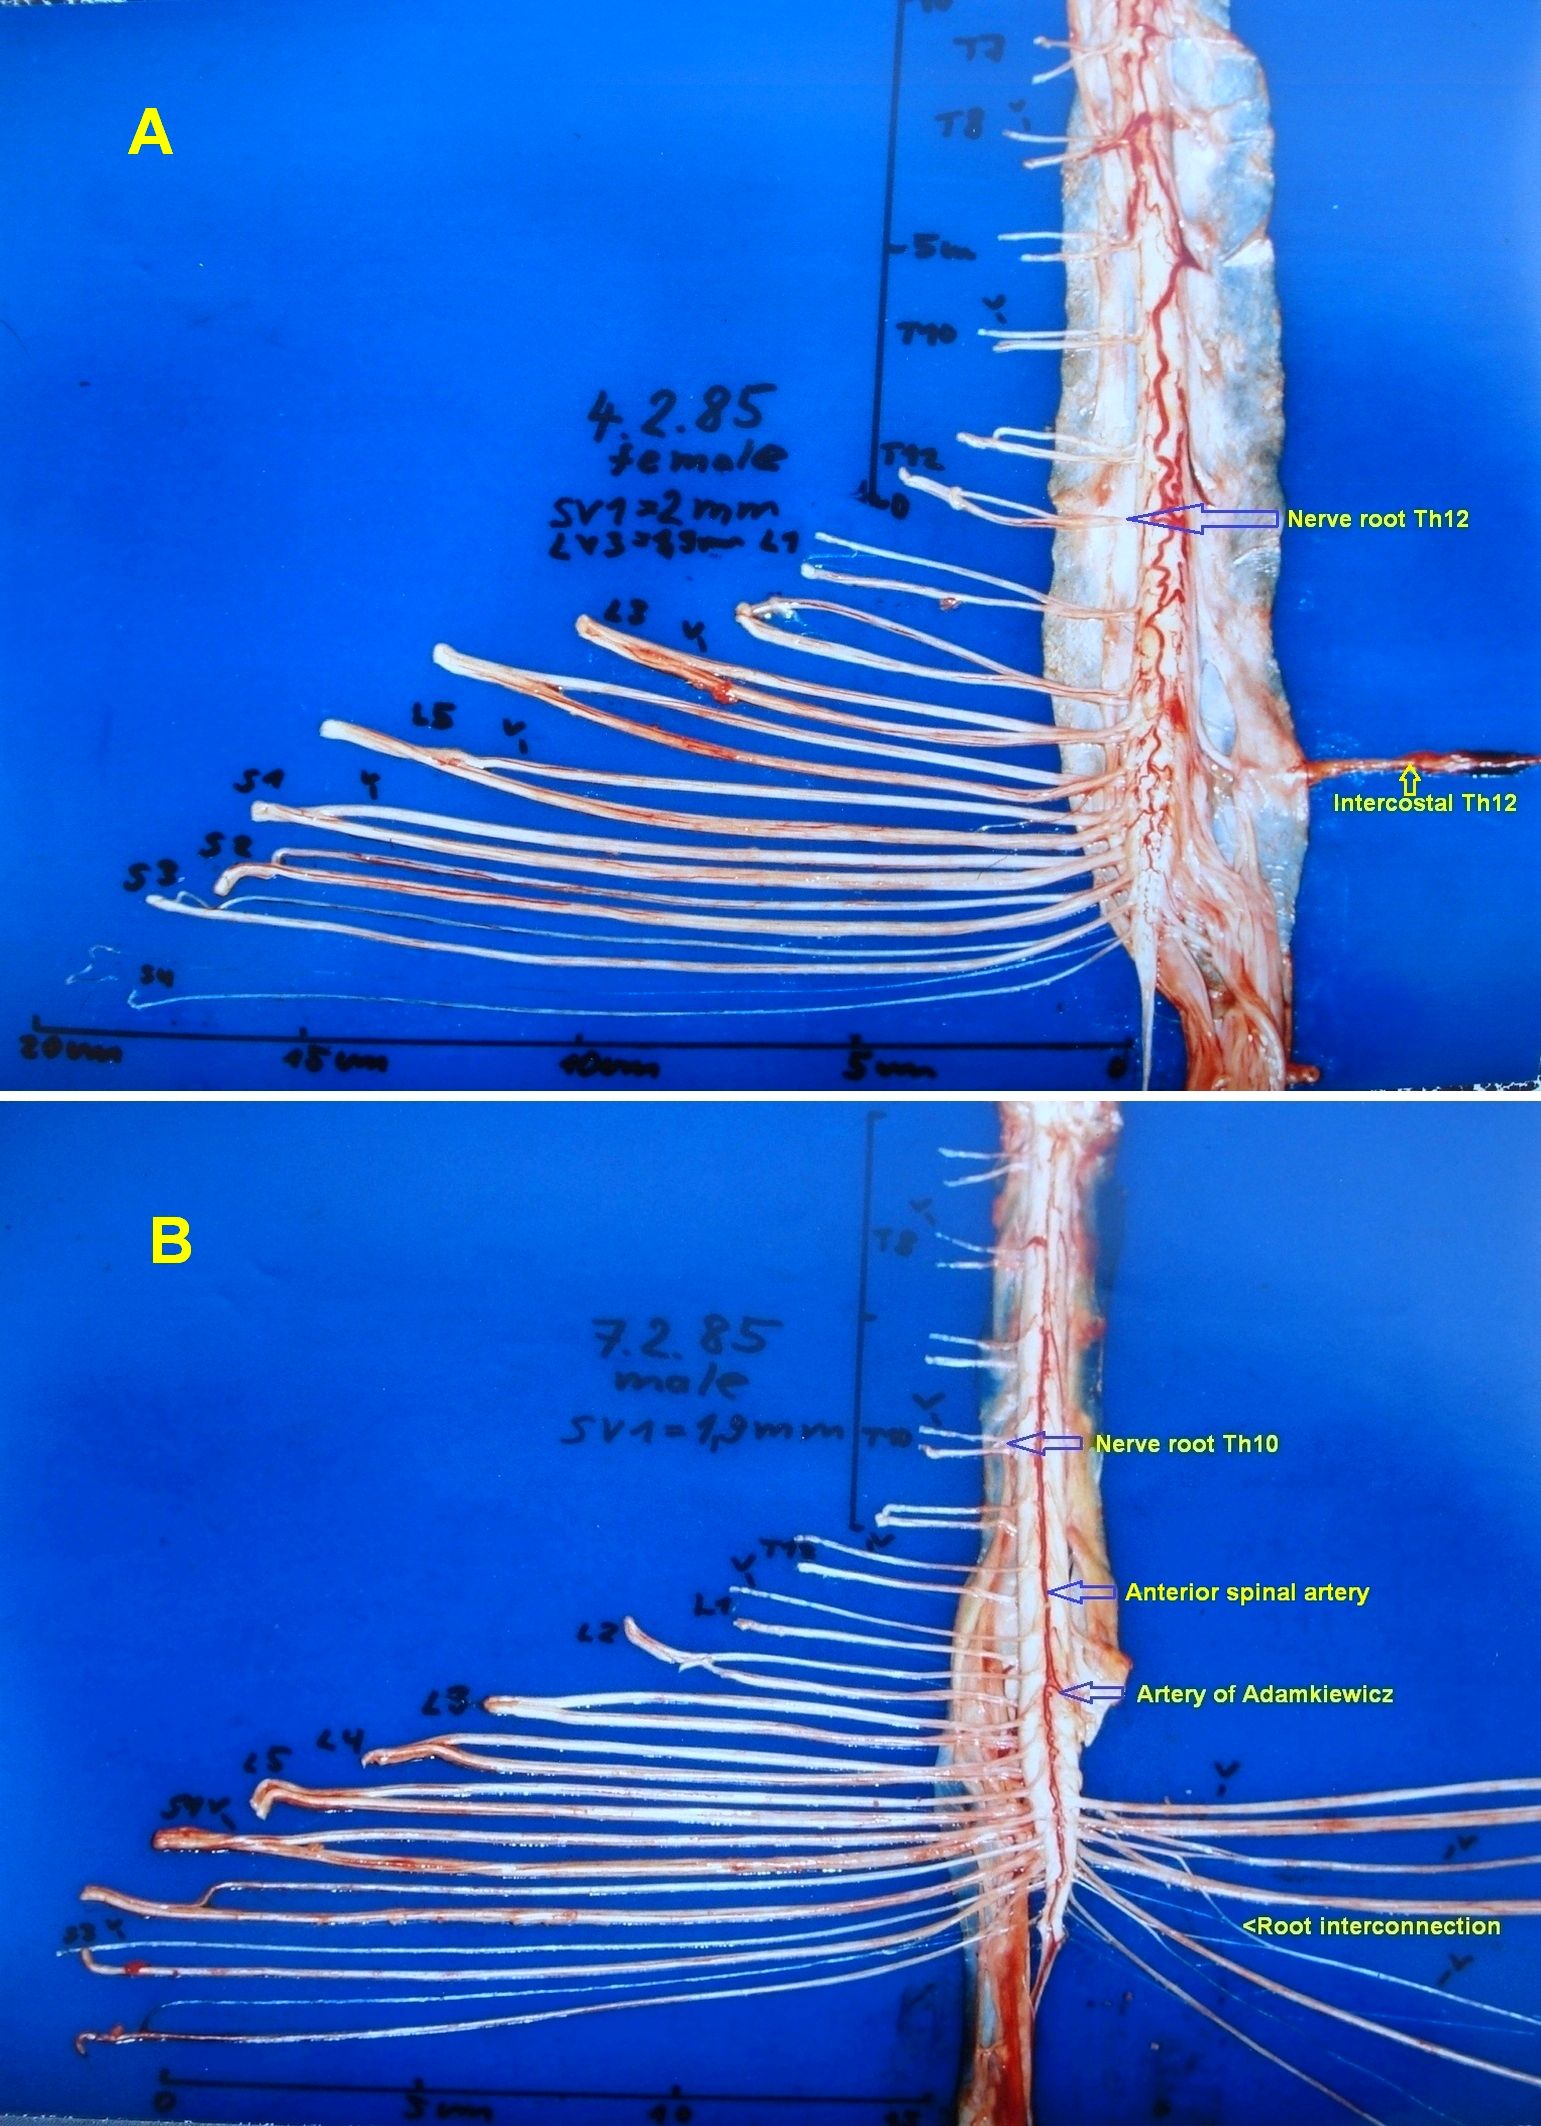
Figure 1. A. The human dorsal spinal cord, the cauda equina nerve roots, the dura mater and the intercostal nerve XII removed and split up. The roots are cut at the dura mater. Note that the caudal ventral roots are very thin and thinner than the dorsal roots. B. The ventral spinal cord and the cauda equina nerve roots. The passage of the artery spinalis magna (Artery of Adamkiewicz) and the anterior spinal artery are indicated. Note the root interconnections on the right side.
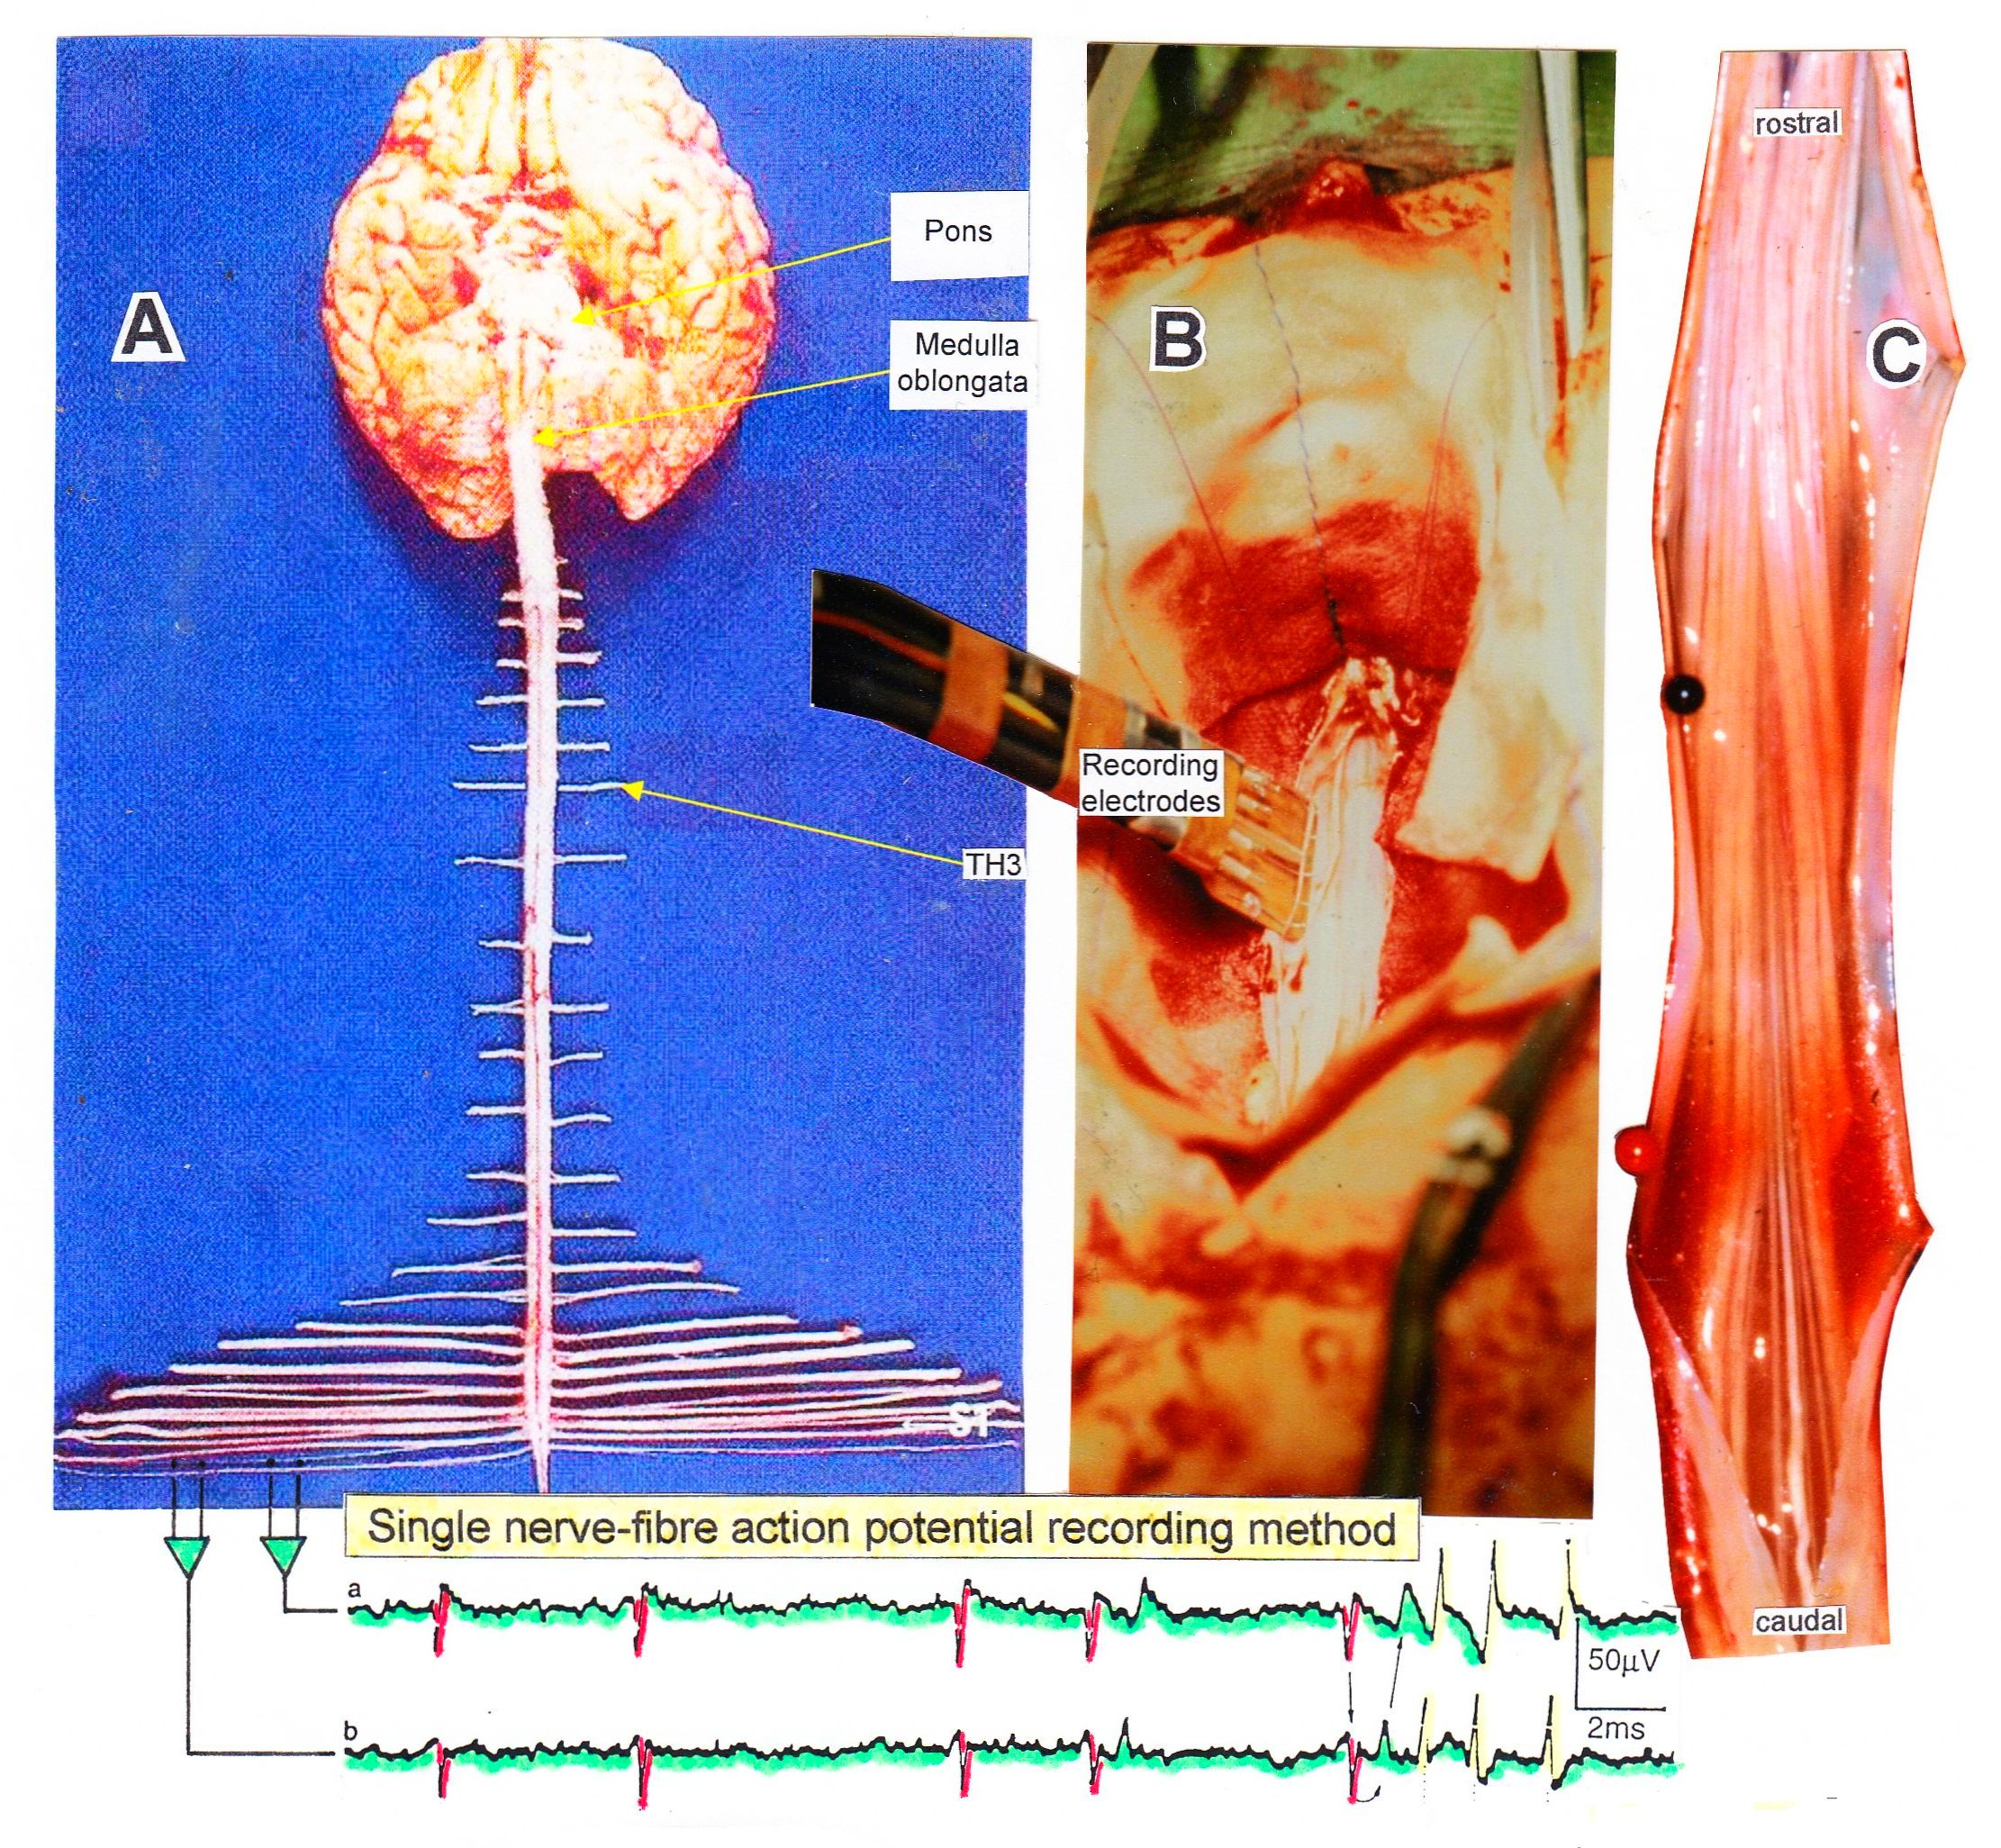
Figure 2. Layout of the recording of single-nerve fiber action potentials to analyze the self-organization of neuronal networks of the human CNS under physiologic and pathophysiologic conditions. By recording with two pairs of platinum wire electrodes (B) from sacral nerve roots (cauda equina, C) containing between 200 and 500 myelinated nerve fibers, records were obtained in which single-nerve fiber action potentials (APs) were identified from motoneurons (main AP phase downwards) and afferents (main AP phase upwards). By measuring the conduction times and with the known electrode pair distance of 10 mm, conduction velocity distribution histograms were constructed in which the myelinated nerve fiber groups larger than 3.5mm could be characterized by group conduction velocity values. After the recording, morphometry was performed.
Layout for recording single-nerve fiber action potentials
The arrangement to record single-nerve fiber action potentials during an operation is shown in Figure 2B. To obtain natural impulse patterns simultaneously from several single afferent and efferent nerve fibers to analyze CNS functioning, the summed impulse traffic was split into the impulse patterns of single fibers. The splitting is achieved by recognizing the APs from certain single fibers on the basis of wave form comparisons on the two recording traces and the conduction time which an AP needs to travel from one electrode pair to the other one (10mm) and selecting these APs out. The splitting of the skin afferent activity upon touch or pin-prick into the natural impulse patterns of the different single touch and pain receptors is shown in Figure 5. Such messages inform the CNS about changes in the periphery.
Classification for human peripheral nerve fibers
For the analysis of CNS functioning the kind of nerve fibers from which the recordings were taken must be identified. A classification scheme of human peripheral nerve fibers is needed.
Conduction velocities of single nerve fibers were calculated from the conduction distance (electrode pair distance = 10 mm) and the conduction times (the time difference of a certain AP between the traces from two pairs of wire electrodes). Velocity distributions of afferent and efferent fibers were constructed, and distribution peaks were correlated to certain nerve fiber groups. The nerve roots from brain dead and surgical patients could be removed, fixated, embedded and stained. Mean nerve fiber diameters could be measured, and nerve fiber diameter distributions constructed (morphometry). By correlating the identified conduction velocity peaks with nerve fiber diameter peaks, a classification scheme for the human Peripheral Nervous System was constructed, in which individual groups of nerve fibers are characterized by group conduction velocities and group nerve fiber diameters (Figure 3,4). This classification scheme is still incomplete and only holds for nerve fibers thicker than approx. 3.5µm. The classification schemes for animals do not apply to humans and their accuracy is low. For example, conduction velocities in rats, cats and dogs (max » 120 m/s) are much higher than those in humans (max » 70 m/s).
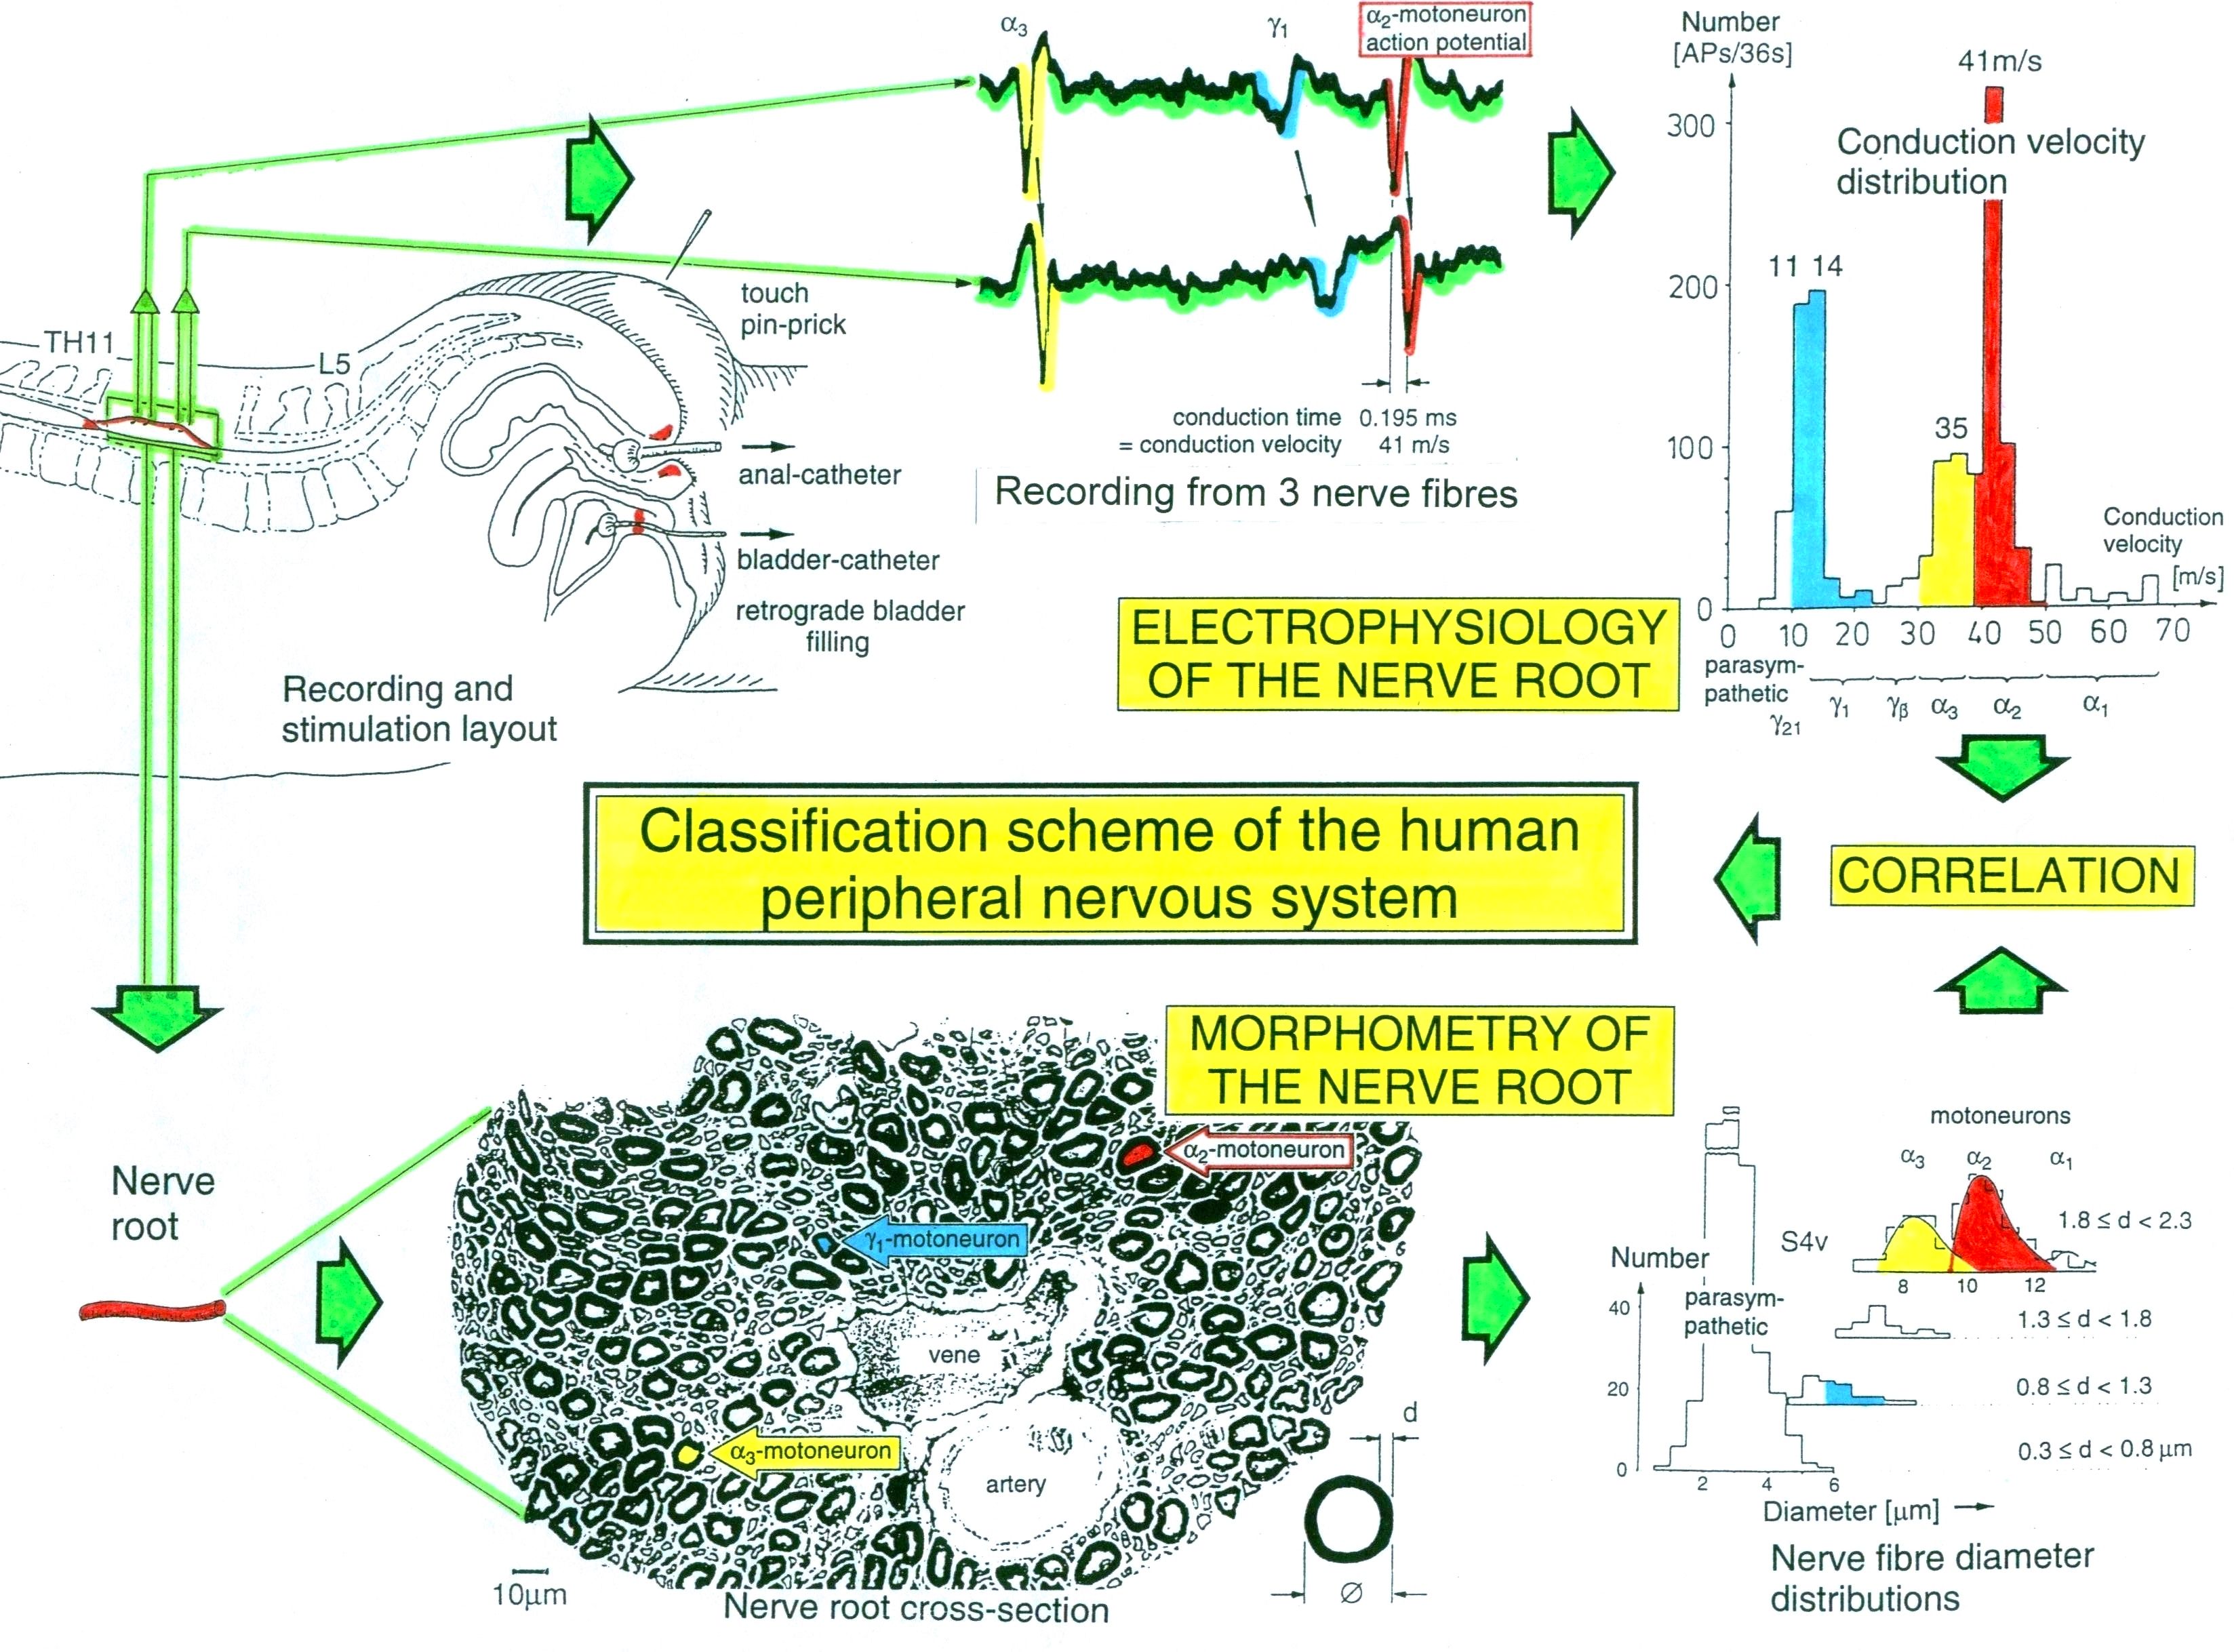
Figure 3. Development of a classification scheme for human peripheral nerve fibers. Conduction velocities (V) and nerve fiber diameters (Æ) of afferent and efferent nerve fiber groups in normal humans and in patients with a traumatic spinal cord injury for 0.5 to 6 years.
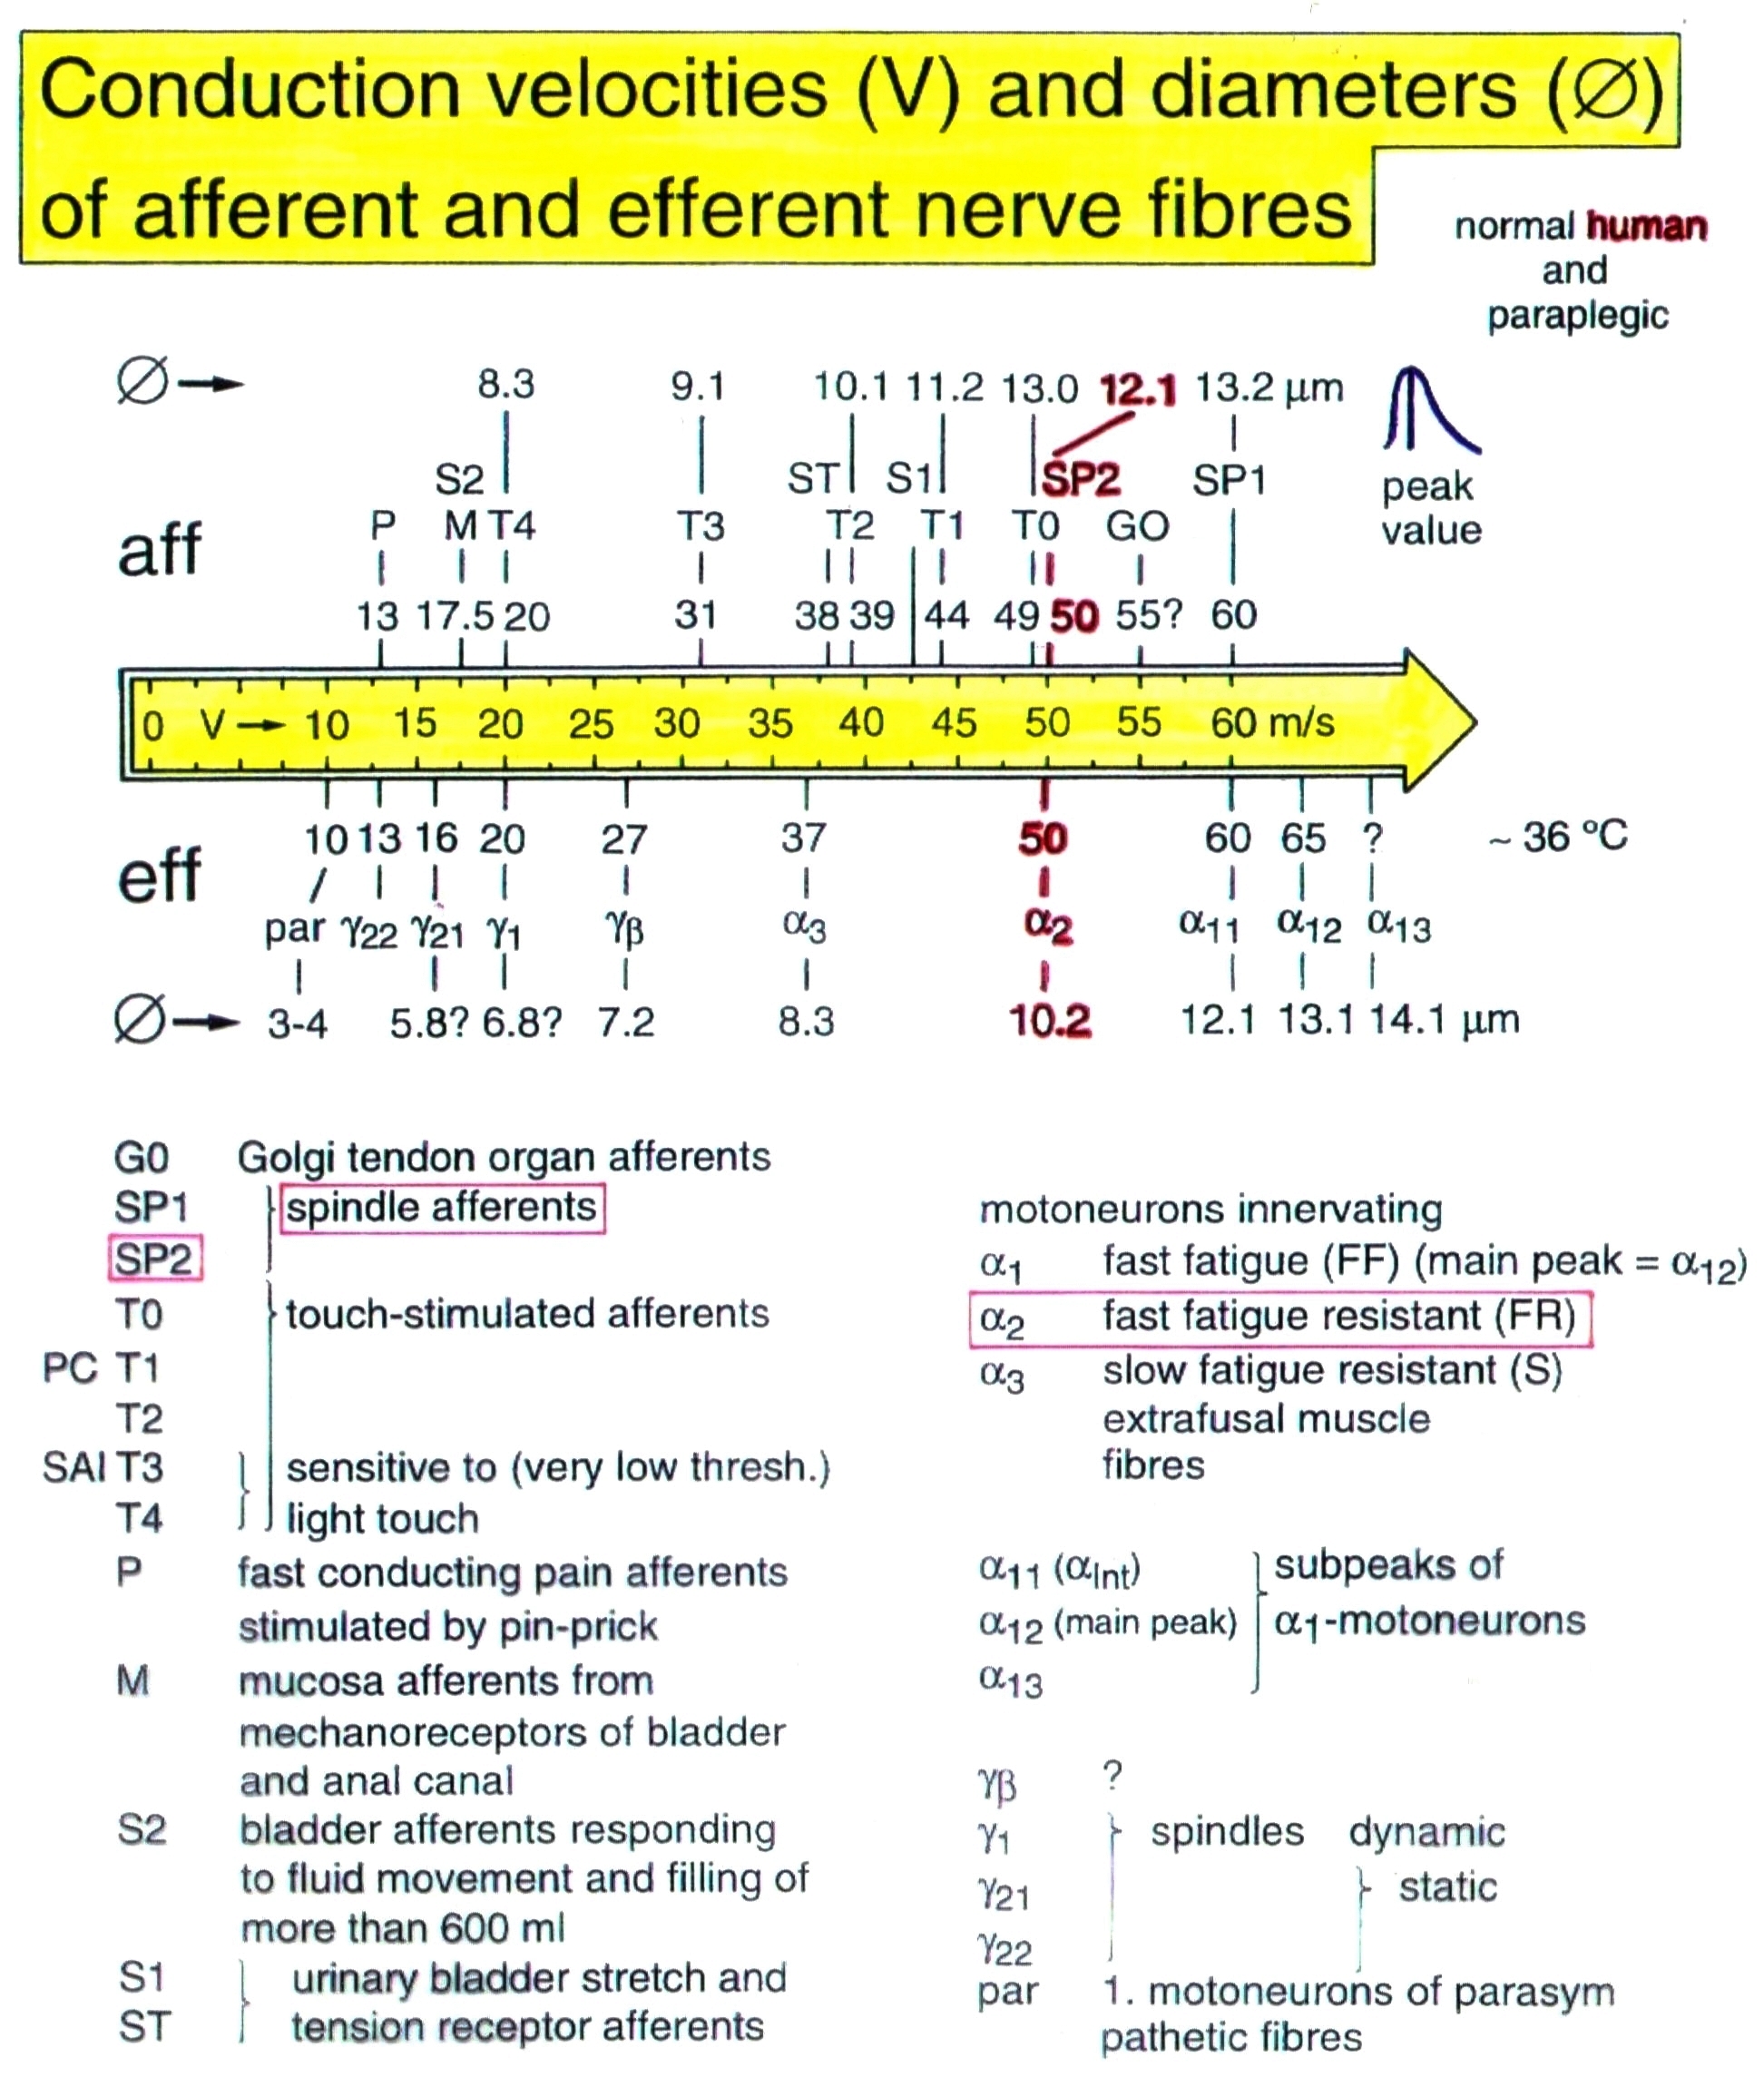
Figure 4. Classification scheme for human peripheral nerve fibers. Conduction velocities (V) and nerve fiber diameters (Æ) of afferent and efferent nerve fiber groups in normal humans and in patients with a traumatic spinal cord lesion for 0.5 to 6 years. The splitting of the a1-motoneurons into the 3 subgroups, a11, a12, a13, has not yet been confirmed.
Self-organization mechanism of the human CNS: With the human nerve fiber classification scheme, it will thus become possible to record natural impulse patterns simultaneously from identified single afferent and efferent nerve fibers (motoneuron axons) and to analyze self-organizing mechanisms of the human CNS under physiologic and pathologic conditions. As we can measure simultaneously the natural impulse patterns, generated by certain identified single receptors in the periphery by touch, pin-prick, urinary bladder filling or other stimulations, which run into the spinal cord (CNS) and those patterns which leave the cord, it becomes possible to analyze the integrative properties of the largely unchanged CNS of brain-dead humans (HTs) and patients with a damaged CNS at the cellular level (Figure 5).
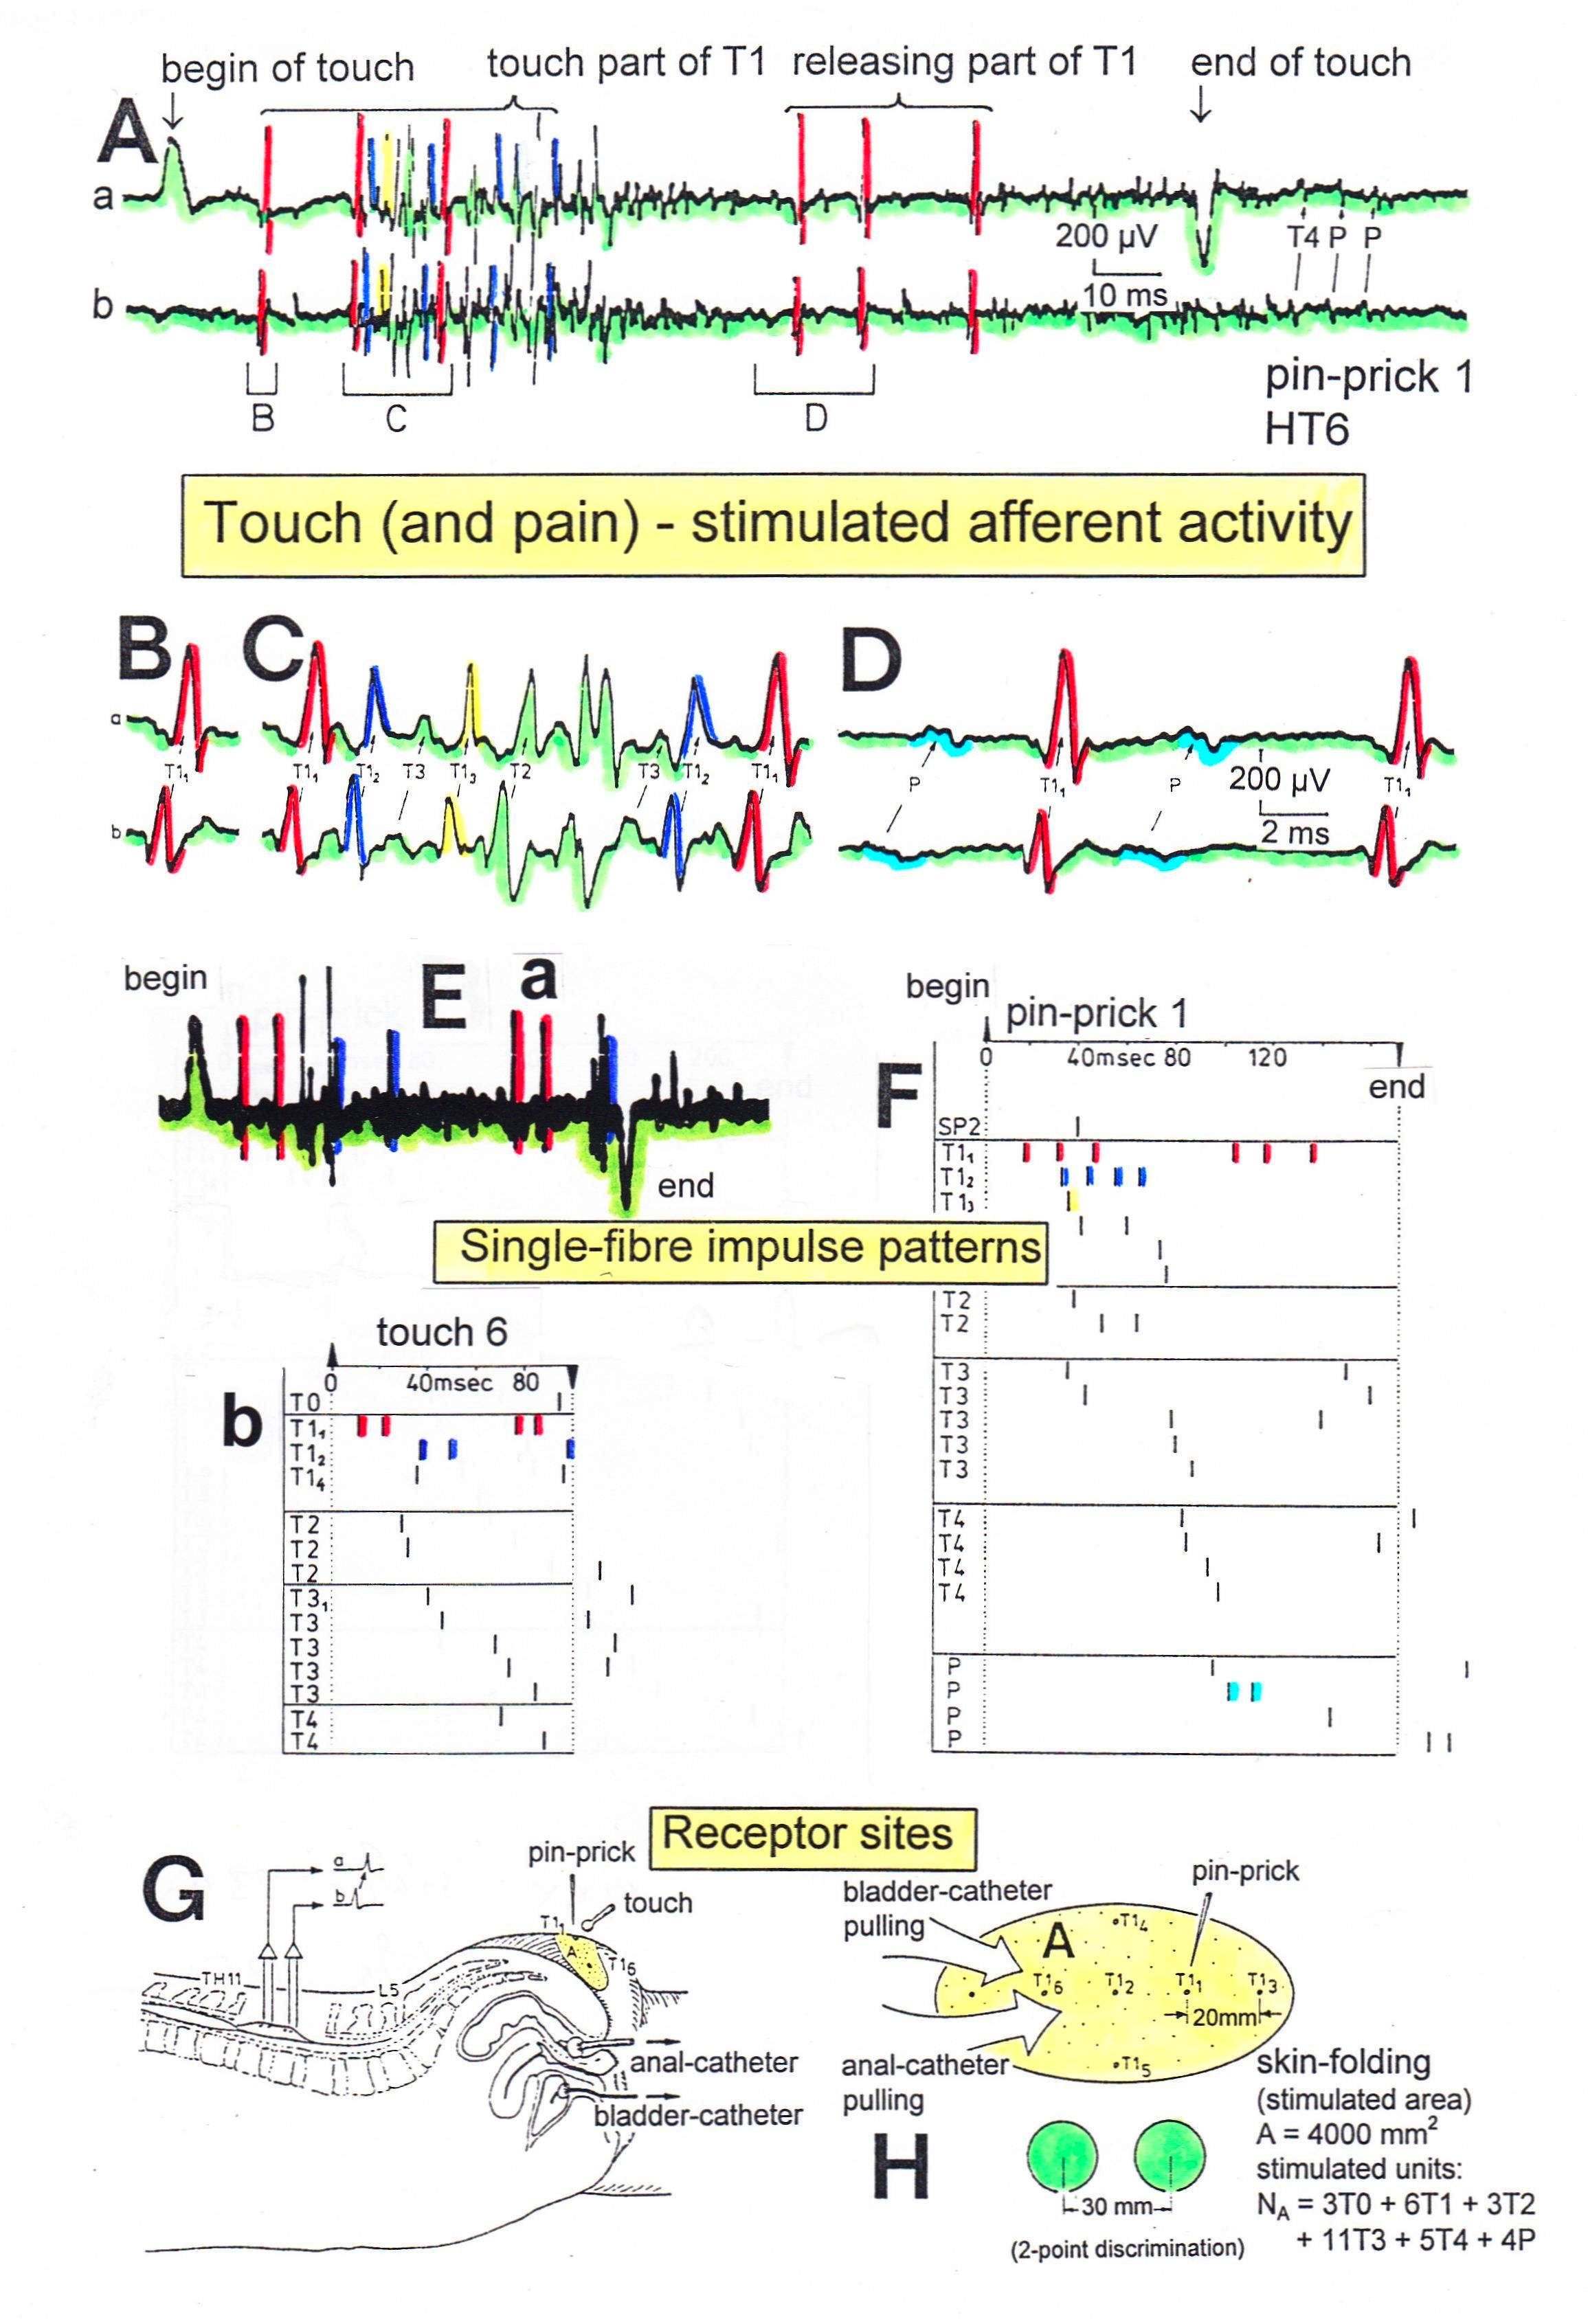
Figure 5. Touch (and pain)-stimulated afferent activity. Touch and pain activity stimulated by pin-pricking (A) and touching (Ea) at S5 or Co dermatomes and recorded extracellularly from a dorsal coccygeal root (brain-dead human HT6). T1, T2, T3, T4, P = mark action potentials (APs) from single touch and pain fibers. Subscripts 1, 2, 3-mark single fibers.
A- Whole sweep following pin-prick 1 shown at a slow time base. The large upward artifact on trace ‘a’ marks electronically the beginning of the pin-prick. The large downward artifact on trace ‘a’ marks the end of the pin-prick. Note that 2 intervals of high activity of large APs occur, one after the beginning of the pin-prick with 1 AP in front, and a second before the end of the pin-prick; potentials with small amplitude follow potentials of large amplitude. Time intervals B, C and D are shown in a time-expanded form in Figures B, C and D.
B, C, D- Time expanded sweep pieces of A. Identified APs are indicated. Note that the APs from the T11 touch unit can be safely identified by the waveforms in B, C, D.
Eb, F- AP occurrence patterns of single touch and pain fibers following short touch 6 and pin-prick 1. No pain afferents are stimulated upon touch 6. Upon pin-prick 1, the single-fiber AP activity of the different touch and pain groups is identified by the AP waveforms on traces ‘a’ and ‘b’, and by the conduction times. The single touch afferents of the T1 group are marked with subscripts. One active secondary muscle spindle afferent fiber (SP2) could always be identified in F. Note that for pin-prick 1, touch and pain afferents are stimulated whereas for touch 6 only touch afferents.
G- Recording and stimulation arrangement for simultaneous recording of several single touch and pain units. A = area stimulated by skin folding, drawn in H in more detail. T11, T16 = suggested touch points of the T11 and T16-units.
H- Drawing of the very approximate skin area stimulated by skin folding. T11-6 = suggested focal T1 touch points. Two-point discrimination indicated for the sake of comparison. NA = number of stimulated units in the dorsal coccygeal root. Skin tractions evoked by anal and bladder-catheter pulling are indicated by the large open arrows.
This also means that the changes in function, caused by a CNS injury, can be identified. The use of this new electrophysiological recording technique has brought new understanding to the functioning of the human CNS and has allowed for much greater opportunity in identifying techniques for its repair.
Two important findings of CNS self-organization with respect to repair are the phase and frequency coordination and the oscillatory firing of premotor spinal oscillators of which the motoneuron is probably a part (Figure 6,7). Following CNS injury, the phase and frequency and the oscillatory firing of the sub-network oscillators become impaired and have to be repaired. Apart from the improvement of phase and frequency coordination and the oscillatory firing of sub-networks other brain parts have to take function over of the damaged CNS parts during repair. The phase and frequency coordination is improved when the patient exercises on the special CDT device (Figure 15) and the premotor spinal oscillators are partly repaired to fire more rhythmically when jumping on spring-board (Figure 19). Further, automatisms like crawling, walking and running and other movements have to be trained, so that other brain parts can take over functions by movement-based learning.
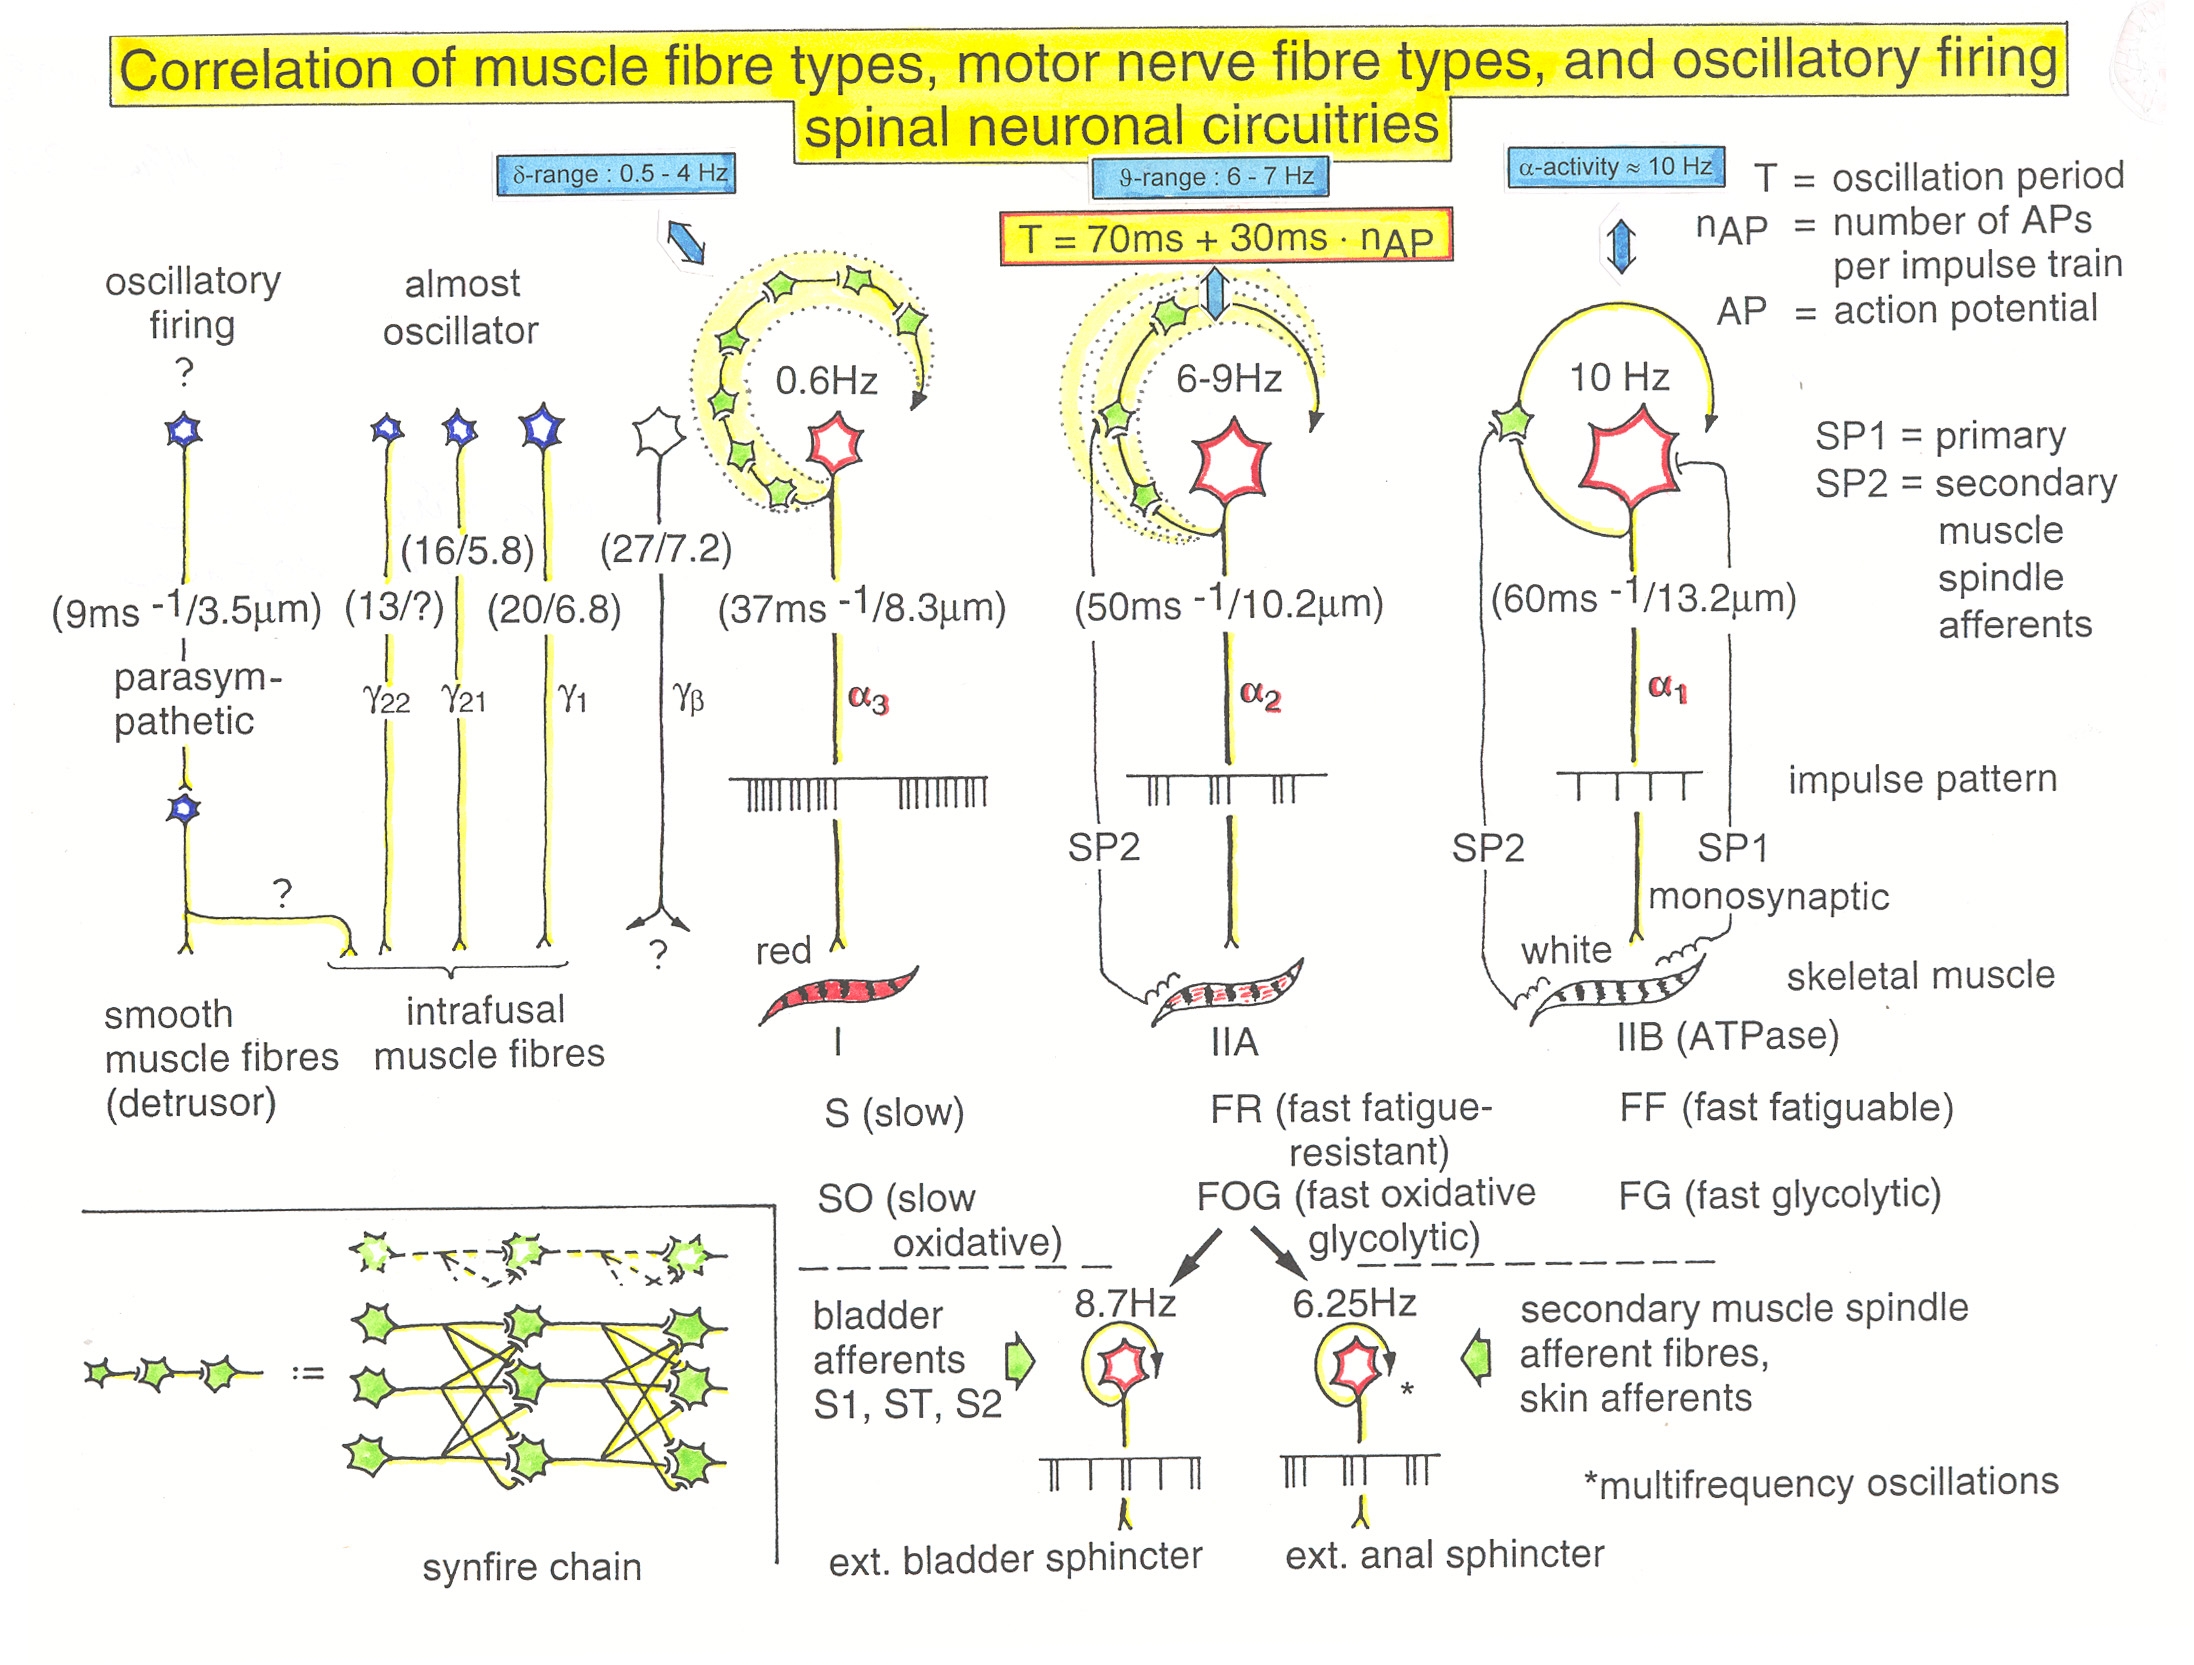
Figure 6. Correlation of muscle fiber types, motor nerve fiber types, and oscillatory firing spinal neuronal networks, based on histochemical, morphological and physiological properties. This Figure provides a simplified correlation between muscle fiber, motoneuron and sacral oscillator types. a = motoneuron, g1, g2 = dynamic and static fusimotors, parasympathetic = parasympathetic preganglionic motoneuron. S1, ST, S2 = stretch, tension and flow receptor afferents.
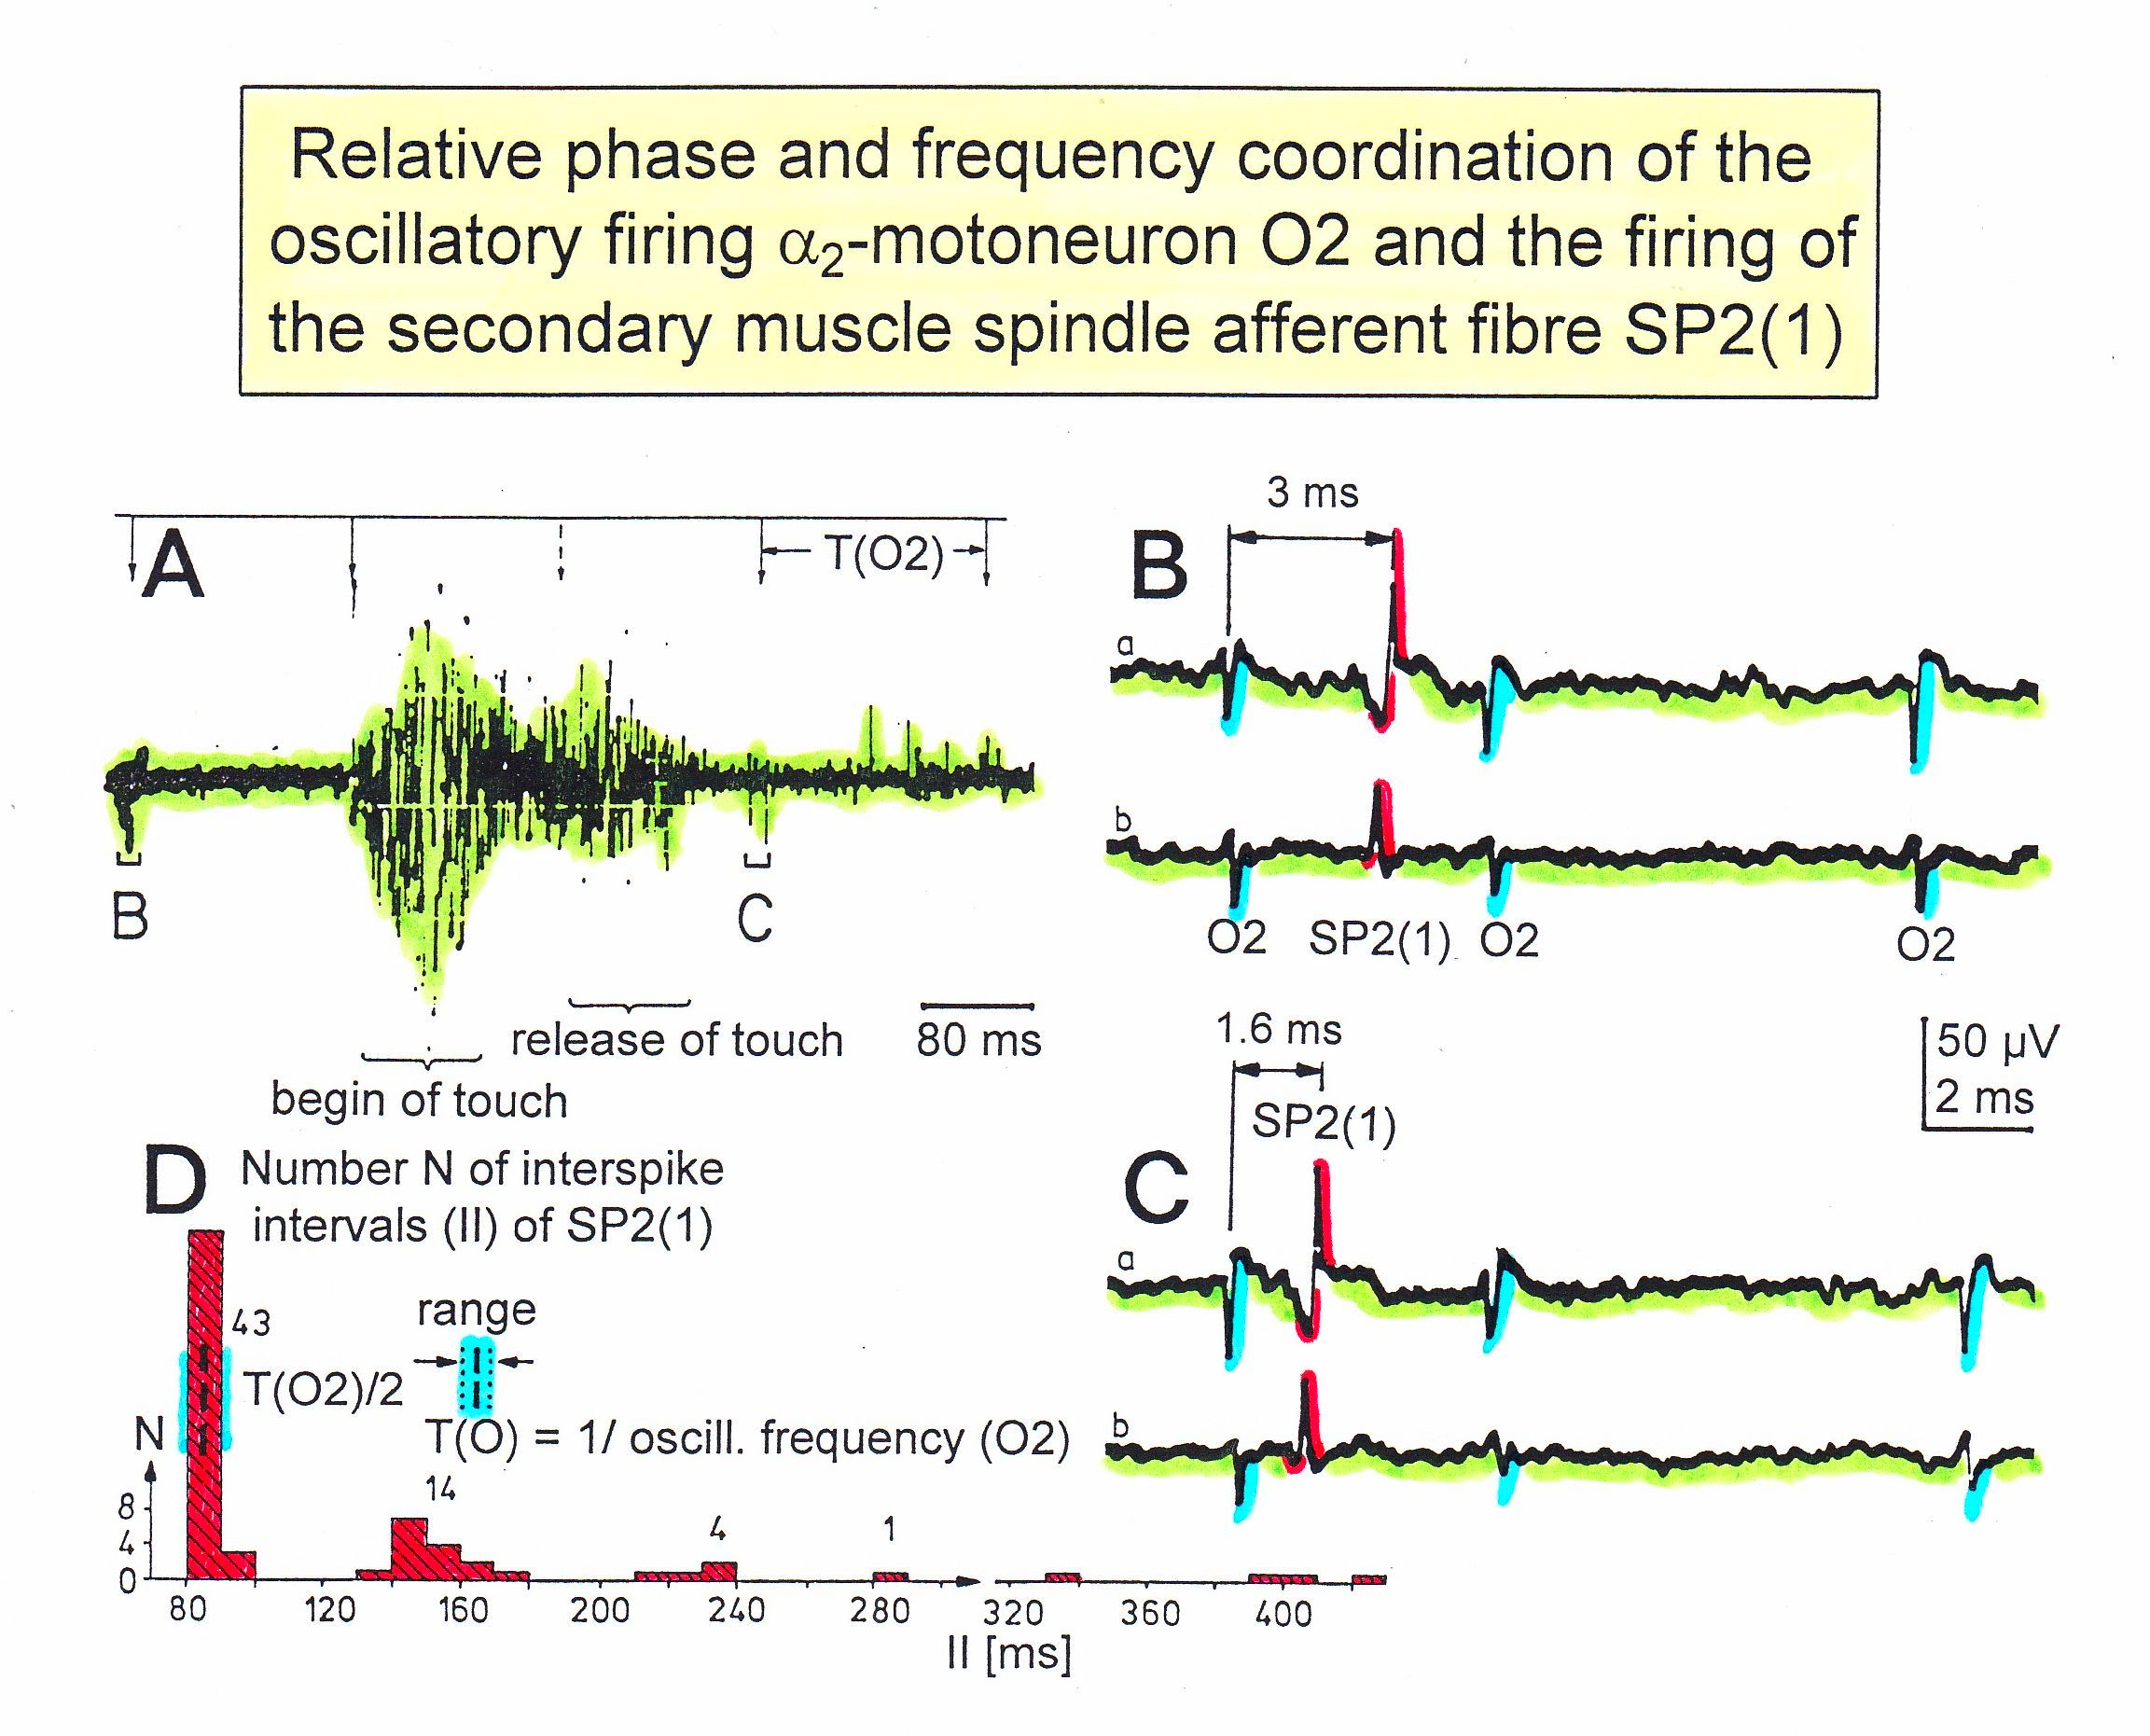
Figure 7. Time relation between the occurrence of the action potentials (APs) of oscillatory firing a2-motoneuron O2 and the firing of the secondary muscle spindle afferent fiber SP2(1). Brain-dead human HT6. S4 dorsal root recording. A. Overall view of the used sweep piece; only trace “a” shown. Four oscillation cycle periods of motoneuron O2 are indicated (T(O2)). The APs of the impulse trains can be recognized only partly, because of the slow time base and poor digitalization. One impulse train (dashed arrow) is lost in the touch stimulated activity, which consists of a touch (large overall activity) and a release part (lower overall amplitude). B, C. Sweep pieces from A, time stretched. In B, motoneuron impulse train APs is marked O2, spindle afferent APs are marked SP2(1). Note that the APs of the spindle afferent fiber are not time-locked to the first AP of the impulse train of the rhythmically firing motoneuron (relative phase coordination). Digitalization 4 times better than in A, but still rather poor, as can be seen from the low amplitudes of the motoneuron APs on trace “b” in C. D. Occurrence of interspike intervals of the secondary muscle spindle afferent fiber SP2(1). The numbers give the amount of IIs in each distribution peak. The oscillation period of motoneuron O2 (and the range of variation) and the half period are indicated by short dashed lines. Note that the IIs of fiber SP2(1) are very similar to the oscillation period (or the half of it) of a2-motoneuron O2 (relative frequency coordination).
Premotor spinal oscillators: Typical firing patterns of motoneurons can be observed when motoneurons are activated with increasing strength of adequate afferent input. With low afferent input, the motoneurons fire occasionally. With increasing input, they fire intermittently in an oscillatory manner and then continuously in an oscillatory manner. The demonstration that neurons of the CNS, in this case motoneurons, can fire both in an oscillatory manner and non-oscillatory manner is very important for the understanding of the functioning of the human CNS. To describe the functioning of the CNS merely by reflex pathways and loops or coupling of rigid oscillators (of cellular or network origin) is in contradiction to empirical human data, namely that premotor spinal oscillators self-organize as was concluded from measurements of simultaneous natural impulse patterns of afferent and efferent fibers. In what follows, we shall concentrate mainly on the oscillatory firing of motoneurons, which takes place for high activation. In this high activation mode, they can also be used as a reference basis when defining phase relations and thus phase and frequency coordination can be measured among neuron firing. For high and rather constant afferent input it was found that a-motoneurons fire repeatedly with impulse trains according to their type (Figure 6). The a1-motoneurons (FF) fire rhythmically at around 10 Hz (range 8 to 30) with an impulse train consisting of 1 AP; a2-motoneurons (FR) fire at approx. 6 to 9 Hz with 2 to 5 APs per impulse train, and a3-motoneurons (S) fire with a frequency in the range of 1 Hz and with long impulse trains consisting of up to 40 APs (and more). The rhythmic firing patterns of a-motoneurons are probably generated by local neuronal networks of the spinal cord since oscillatory firing can be recorded from motoneurons of the disconnected spinal cord. It may be that the motoneuron is a part of the spinal oscillator. The oscillation period (T) is roughly related to the number of action potentials (APs) per impulse train (nAP), and this can be expressed by the formula: T = 70ms + 30ms · nAP. A typical premotor a2-oscillator fires with 3 APs every 160ms (T = 70ms + 30ms · 3 = 160ms), and can change its firing pattern to 2 APs every 130ms for less activation or to 4 APs every 190ms for higher activation. The tremor in patients with Parkinson’s disease is generated by the a2-oscillators when synchronizing due to missing inhibition.
The a1-oscillators respond very dynamically but have few oscillator network properties. Their firing is absolutely correlated to the firing of primary spindle afferent fibers. The a2-oscillators respond less dynamically, have strong oscillatory properties and self-organize by the adequate afferent input patterns from several kinds of receptors including secondary muscle spindle and urinary bladder afferents. The behavior of a3-motoneurons is more static and their input is polymodal. The dynamics of responding to inputs increases from a3 to a2 to a1-oscillators in accordance with the dynamics of the 3 muscle fiber types the a-motoneurons innervate. The slow (S), medium fast (FR) (fast fatigue-resistant) and fast contracting muscle fibers (FF) (fast fatigable) have their own corresponding premotor networks in the spinal cord, namely that in which the a1, a2 and a3-networks are integrated in (Figure 6).
Phase and frequency coordination - neuron level
Relative phase and frequency coordination between the APs of an oscillatory firing a2-motoneuron (O2) and a secondary muscle spindle afferent fiber SP2(1) can directly be seen in the original recording in Figure 7. The firing of the oscillator and the sweep pieces which are shown time-expanded are indicated at the summary trace. Figures 7B and 7C show the AP-impulse train of oscillator O2 in connection with one of its driving spindles afferent AP. Because of the duration of the phase relation of around zero milliseconds between the firing of the driving SP2(1)-fiber (firing mostly every 80ms) and the impulse train of the oscillatory firing motoneuron O2 (T(O2) ≈ 160ms), the SP2(1)-fiber AP (every second AP) appeared at a similar time as the impulse train of the oscillatory firing motoneuron. Because the AP of the spindle afferent fiber had a characteristic waveform, it was easy to extract its impulse pattern from the summed impulse traffic of this S4 dorsal root. During touch-induced skin afferent activity, the activities of the motoneuron and the spindle afferent fiber were covered by the skin afferent activity (Figure 5). After the cessation of the skin afferent activity the afferent and efferent APs were found again at their expected time positions of the regular firings. The phase coordination between the firings of the oscillatory firing motoneuron O2 and the secondary muscle spindle afferent fiber SP2(1) at the time when records B and C were taken, was 1.6ms (3ms - 1.4ms), (Figure 7B,C). In Figure 7D, the relative frequency coordination between the firings of the SP2(1)-fiber and the impulse train of the oscillator is indicated. For the time period evaluated, the correlation between the firing of the motoneuron and the spindle afferent fiber was in the range of between 3 and 5ms (Figure 7D).
The fact that neurons fire in a relatively coordinated way of up to a few milliseconds is used for re-organizing the injured CNS by re-learning phase and frequency coordination between neuron firings when exercising arm and leg movements coordinated with an exactness of up to a few milliseconds, using a special coordination dynamic therapy device, i.e. by instrumented supervised phase and frequency re-learning (Figure 15).
In Figure 8, considerations concerning the relative frequency coordination is extended to the activity of further afferent fibers and g-motoneurons of the same root. “G” of Figure 8 shows sweep pieces of the original recordings; A through F shows the interspike interval distributions of spindle afferents and g-motoneurons. It can be seen from the overlapping of the oscillator frequency T(O2) and T(O2)/2 distribution ranges and the interspike interval distributions of the afferents that, from the viewpoint of frequency coordination, fiber SP2(1) contributed strongly to the drive of oscillator O2, whereas there was a weaker contribution from other afferents, i.e. less overlapping between the distributions of the afferents and the range of the basic frequency or the first harmonic of the oscillator. Also, g-motoneurons showed only little frequency correlation at that time period.
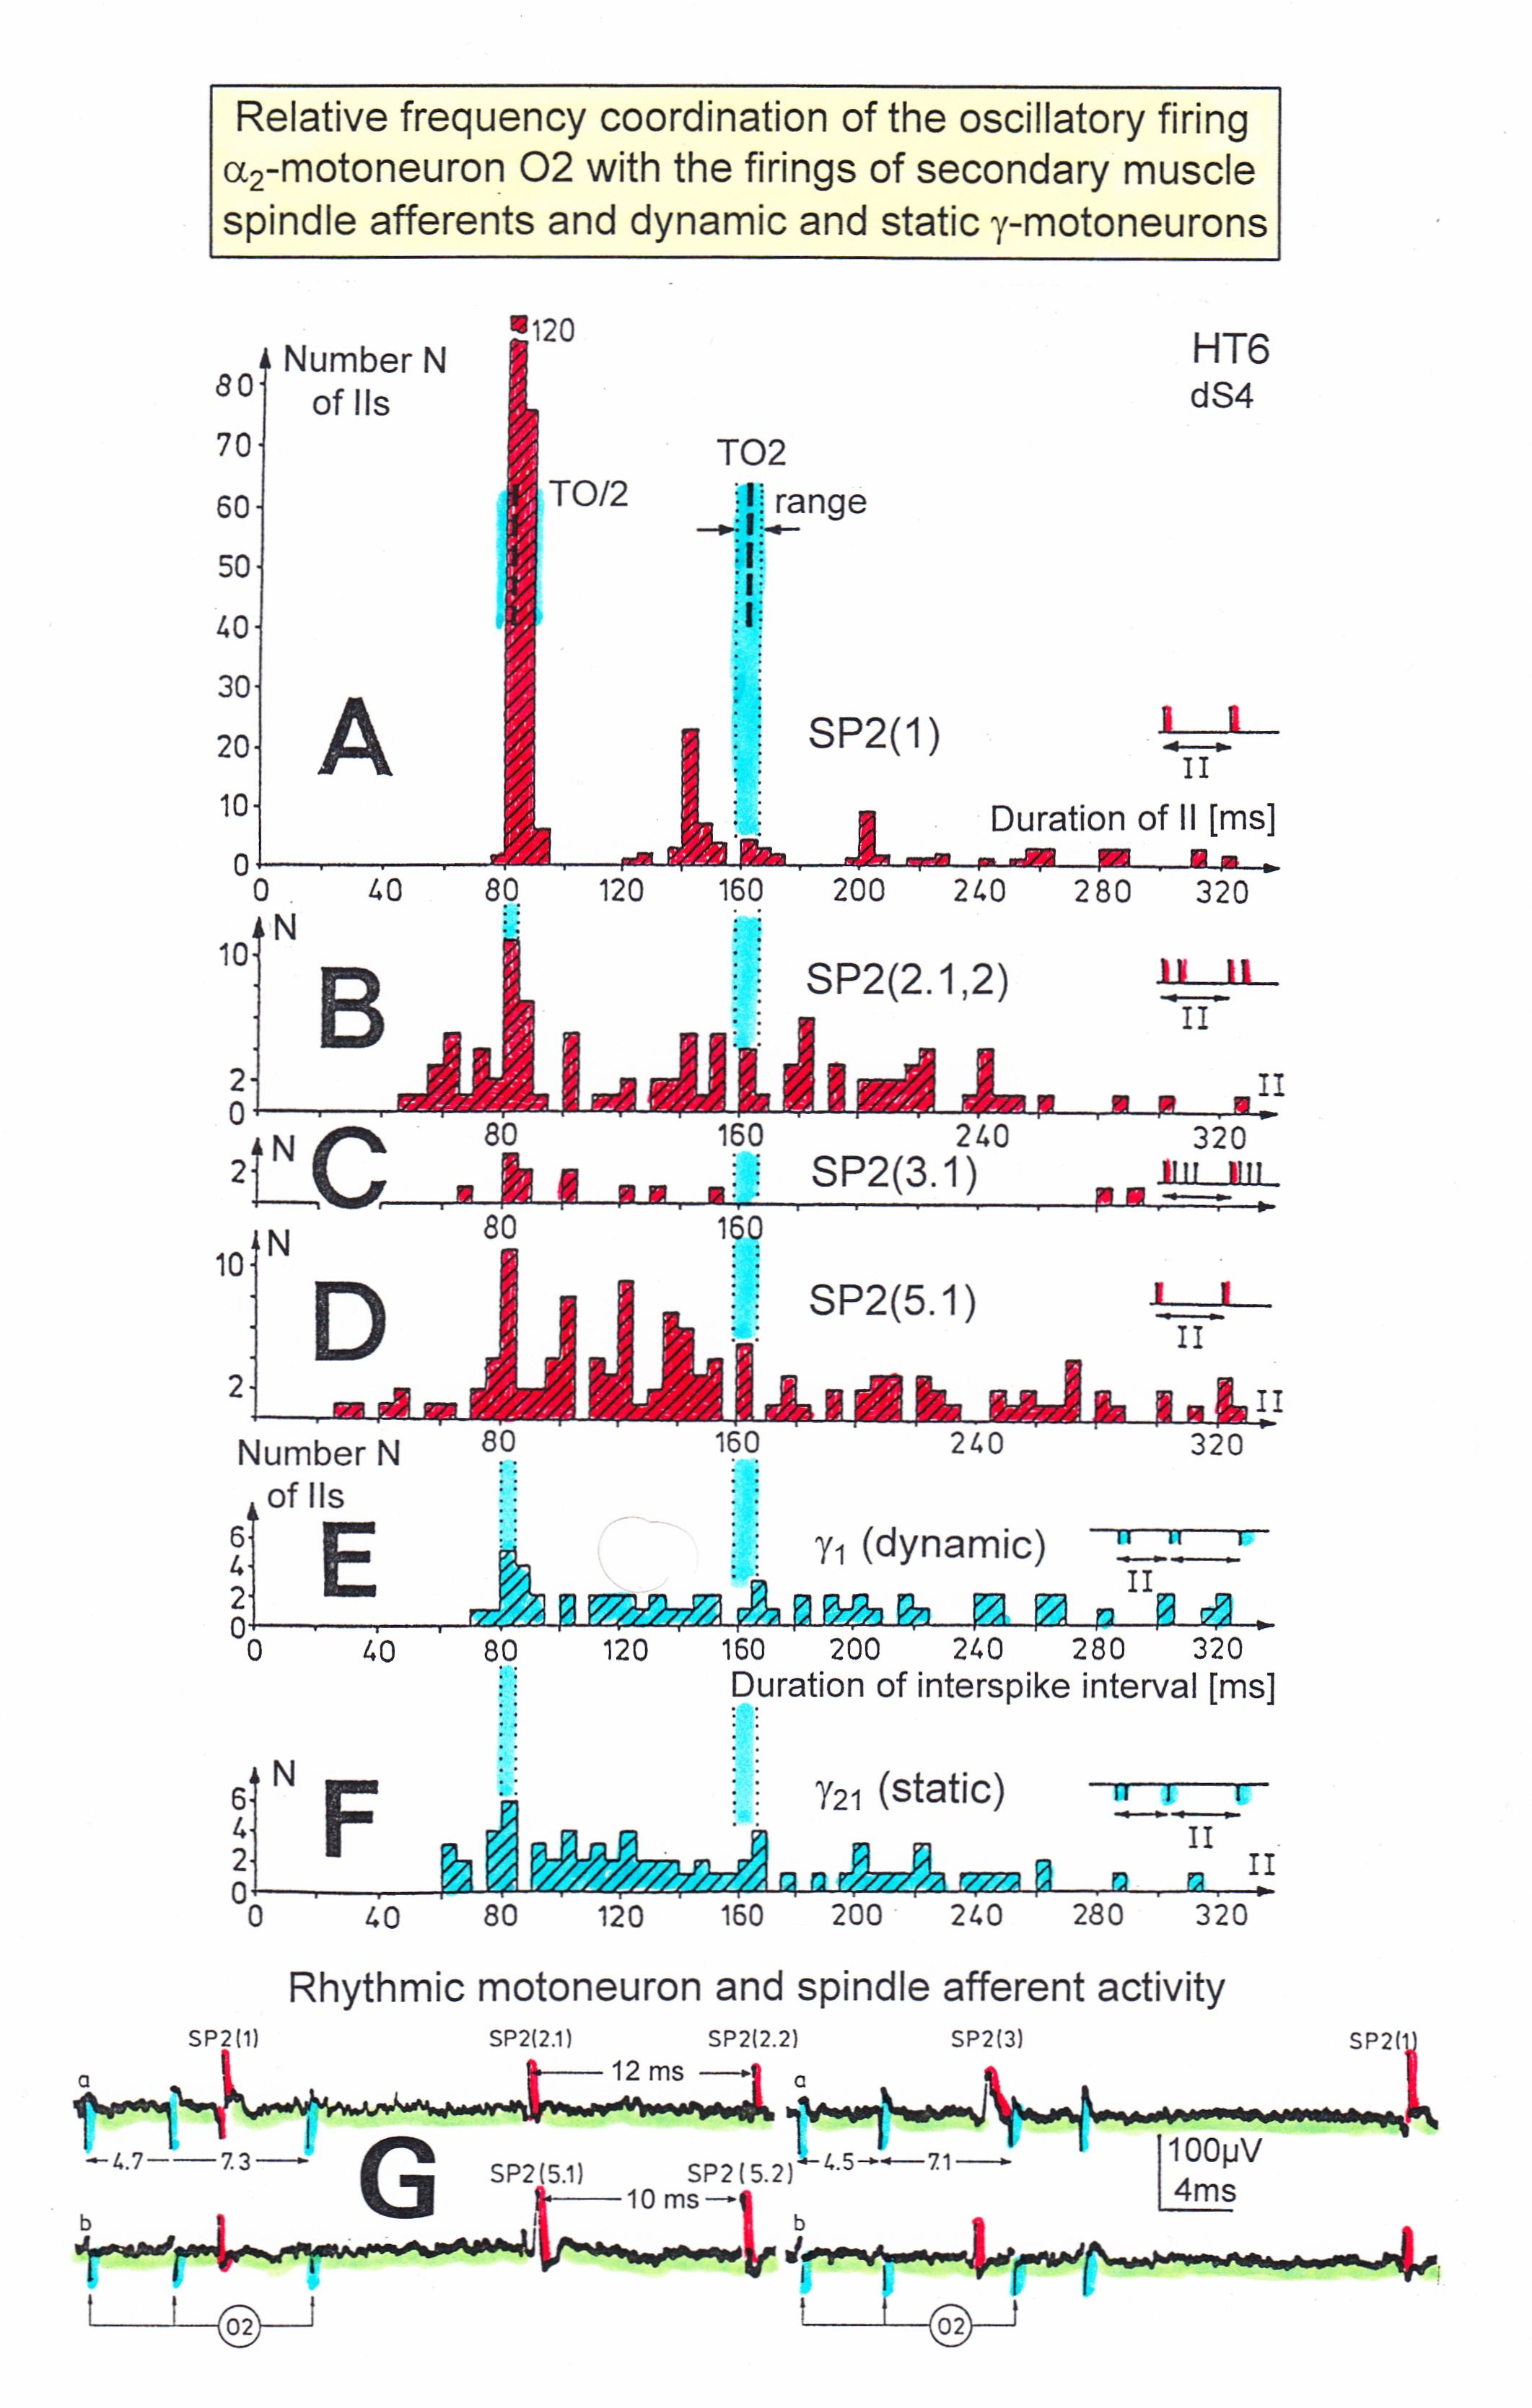
Figure 8. Interspike interval distributions of single endings of four secondary muscle spindle afferents (SP2) and two g-motoneurons, recorded simultaneously. In A, the oscillation period TO2 (impulse train length = 3 APs) with its range of simultaneously recorded oscillatory firing a2-motoneuron O2 (see G) is drawn for comparison; also, the halves of the oscillation period TO2/2 are indicated. Note that the interspike interval distributions of spindle afferents and g-motoneurons have shortest interspike interval, nearly identical to the half of the oscillation period (relative frequency coordination). The schematic impulse pattern in A to F shows the procedure for measuring the interspike intervals. Original records of the firing patterns of a2-motoneuron O2 and the secondary muscle spindle afferents SP2(1), SP2(2), SP2(3) and SP2(5) are shown in G. Brain-dead human HT6, dS4 root.
As will be shown below, phase and frequency coordination among α1-motoneuron firings can directly be seen in recordings of single-motor unit surface electromyography. But pathologic synchronization leads to tremor.
Relative phase and frequency coordination between the firings of a and g-motoneurons and secondary muscle spindle afferents recorded with the single-nerve fiber action potential recording method
To demonstrate the complexity of phase and frequency coordination between different neurons, a recording from a dorsal S4 root of a brain-dead human is shown schematically in Figure 9. Of the summed afferent and efferent impulse traffic, the natural impulse patterns of one a2-motoneuron, a dynamic (g1) and a static g-motoneuron (g21) and two to three secondary muscle spindle afferent fibers could be extracted. The natural stimulations performed were pin-pricking (pain) of sacral dermatomes inside the continence automatism zone and urinary bladder catheter pulling (Figure 5) [1,2]. It can be seen from Figure 9 that the a2-motoneuron (a2(O2)) fired in an oscillatory manner with 2 to 3 impulses per impulse train and sometimes there was a break in the oscillatory firing. The impulse train for a1-motor units consisted of only one action potential. Phase coordination’s between the a2-motoneuron, the g-motoneurons and the secondary muscle spindle afferent fibers are indicated by different arrows and dotted and dashed lines. It can be seen from Figure 9 that there were many coordination’s between the different neurons. The relative phase and frequency coordination seems to hold for all neurons and is an integrative mechanism for the self-organization of the neuronal networks of the human CNS.
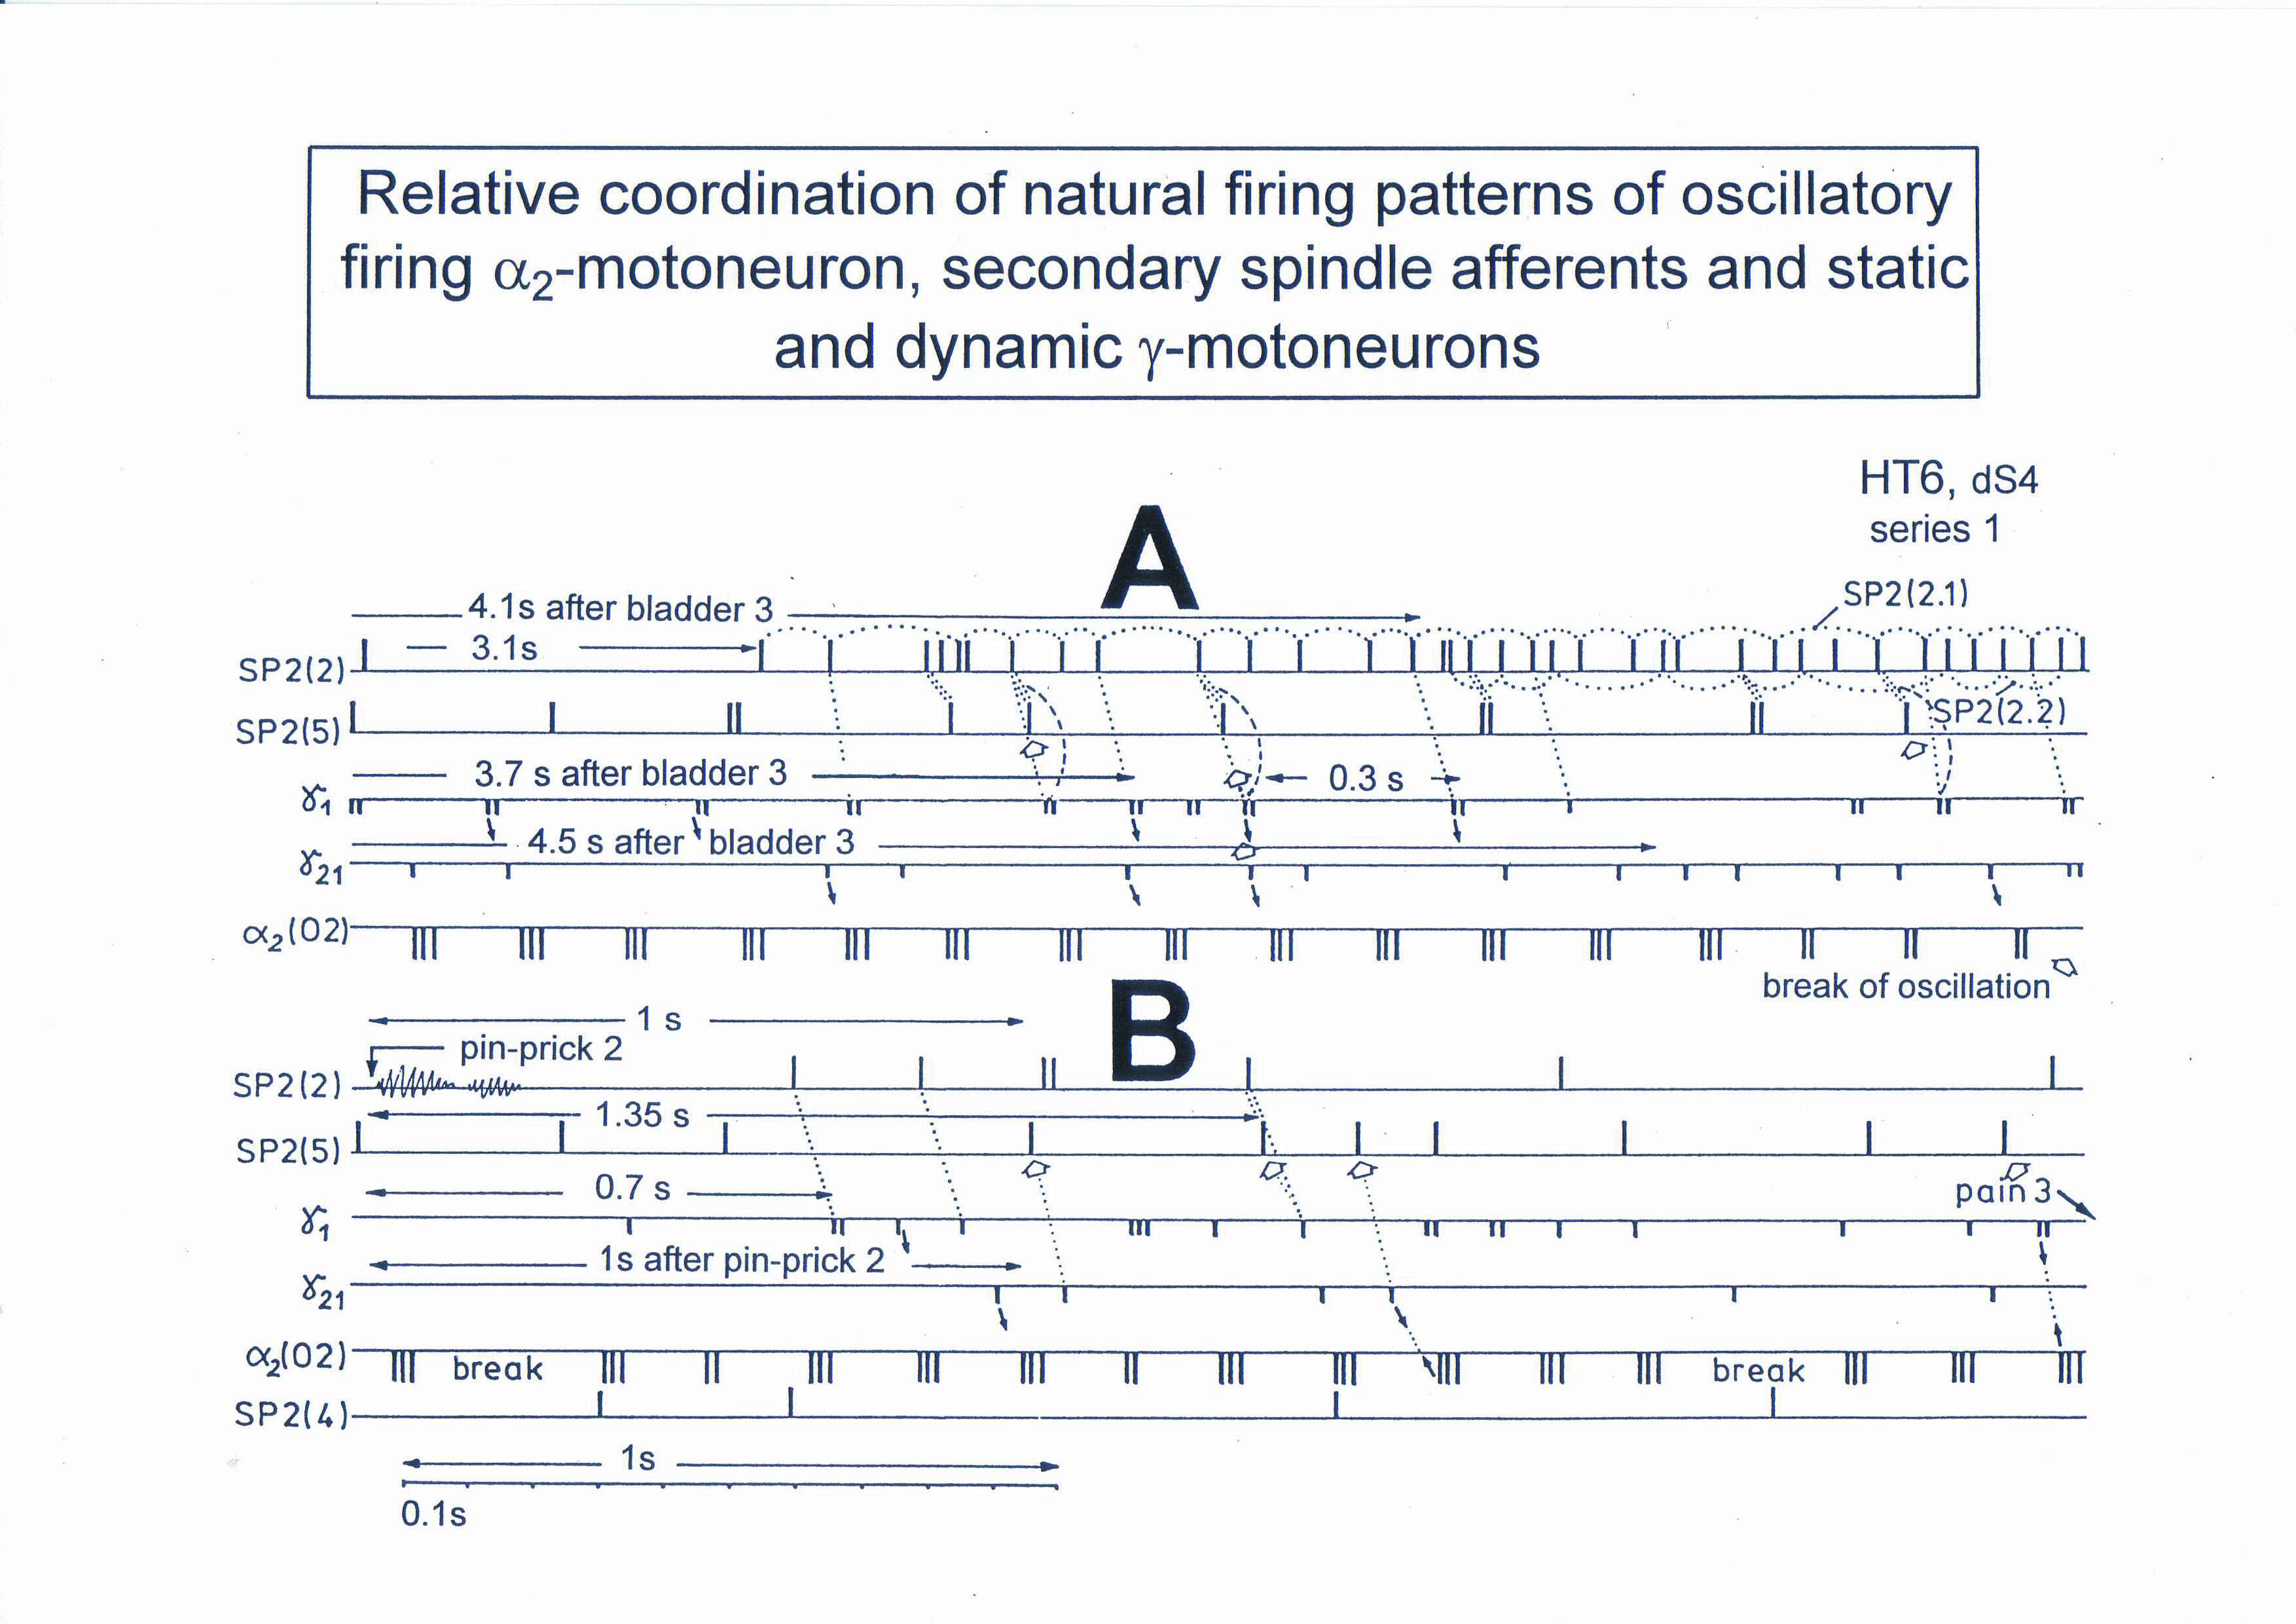
Figure 9. Phase and frequency coordination between the extracellular recorded action potentials of simultaneously recorded g-motoneurons (g1 and g21), secondary spindle afferent fibers (SP2(2), SP2(4), SP2(5)) and oscillatory firing a2-motoneuron O2 following bladder catheter pulling (bladder 3) (A) and pin-prick 2 (B). B was recorded before A. In A the impulse patterns of the 2 encoding sites SP2(2.1) and SP2(2.2) of the single parent fiber SP2(2) are indicated by the dotted curves. Times to the activity increases of g-motoneurons and secondary spindle afferents following stimulation are indicated. Similar time intervals of the occurrence of g-motoneuron APs and SP2(5) fiber APs (phase coordination) are indicated by the open arrows, and the similar time intervals of g-motoneuron APs and a-motoneuron APs are indicated by small arrows. Similar time intervals of the APs of fibers SP2(2) and SP2(5) are indicated by the double dotted lines, those of g1-APs and the SP2(2) fiber APs by a dotted line, and those of g1-APs and the SP2(2)-SP2(5) correlation by a curved dashed line. HT6; dS4-root.
Because of importance, before going on to the impairment of phase and frequency coordination following CNS injury, malformation or degeneration, phase and frequency coordination among motoneurons will be demonstrated by surface electromyography (sEMG). It will also be shown below that with sEMG the same impulse patterns are recorded for motor units as was obtained with the single-nerve fiber action potential recording method for the motoneuron axons.
Surface Electromyography
Another human electro-physiologic tool to measure natural impulse patterns of neurons is the surface electromyography (sEMG). With the same recording system used to record singe-nerve fiber APs, just replacing the wire electrodes with EMG surface electrodes, single-motor unit firing and motor programs were recorded non-invasively.
When surface EMG is performed from a healthy person or child, coordinated motor programs can be recorded from the different muscles. The patterns of recruitment of motor units cannot be seen in such motor programs, because the number of activated motor units is so high that single motor units cannot be followed. However, when only a few motor units can be activated in a certain muscle (in a patient with a spinal cord injury), then the pattern of activation of the motor units and the coordination between them can be seen. If the CNS of the patient is functioning rather physiologically as a result of a long lasting intensive coordination dynamics therapy, then an analysis of the generation of the motor program becomes possible based on single-motor unit firing.
Oscillatory firing of motoneurons and motor units
In Figure 10, the different frequency patterns of oscillatory firing of motoneurons are shown. Original records were taken with the single-nerve fiber action potential recording method from motoneuron axons and surface electromyography (sEMG) from single motor units. a1-Motoneurons innervate FF-type muscle fibers and fire rhythmically with impulse trains consisting of 1 action potential in the order of 10Hz (Figure 6). a2-Motoneurons innervate FR-type muscle fibers and fire rhythmically with impulse trains consisting of 2 to 5 action potentials in the range of 4 to 7 Hz. The amplitude of the extracellular action potential of the a2-motoneurons (axon group diameter = 10.2µm, axon group conduction velocity = 50m/s) is on average smaller than that of the a1-motoneurons (axon group diameter = 13.1µm, axon group conduction velocity = 65m/s), depending on the position of the axon in the nerve root with respect to the recording electrodes (Figure 4). FR-type motor unit potentials have much smaller amplitudes than the motor unit potentials of FF-type muscle fibers. The a3-motoneurons (axon group diameter = 8.3µm, axon group conduction velocity = 37m/s) innervate S-type muscle fibers and fire oscillatory at a frequency of around 1 Hz with long impulse trains (up to 50 action potentials per impulse train). The motor unit firing of single S-type muscle fiber motor units could not safely be identified by sEMG because their amplitudes are still smaller than those of FR-type motor units and are thus difficult to identify. The impulse patterns of oscillatory firing motoneurons obtained with sEMG are similar or the same as those obtained with the single-nerve fiber action potential recording method [1]. This confirms the accuracy of the single-nerve fiber action potential recording method. Since sEMG is a non-invasive recording method, oscillatory firing can be recorded easily when using appropriate patients.
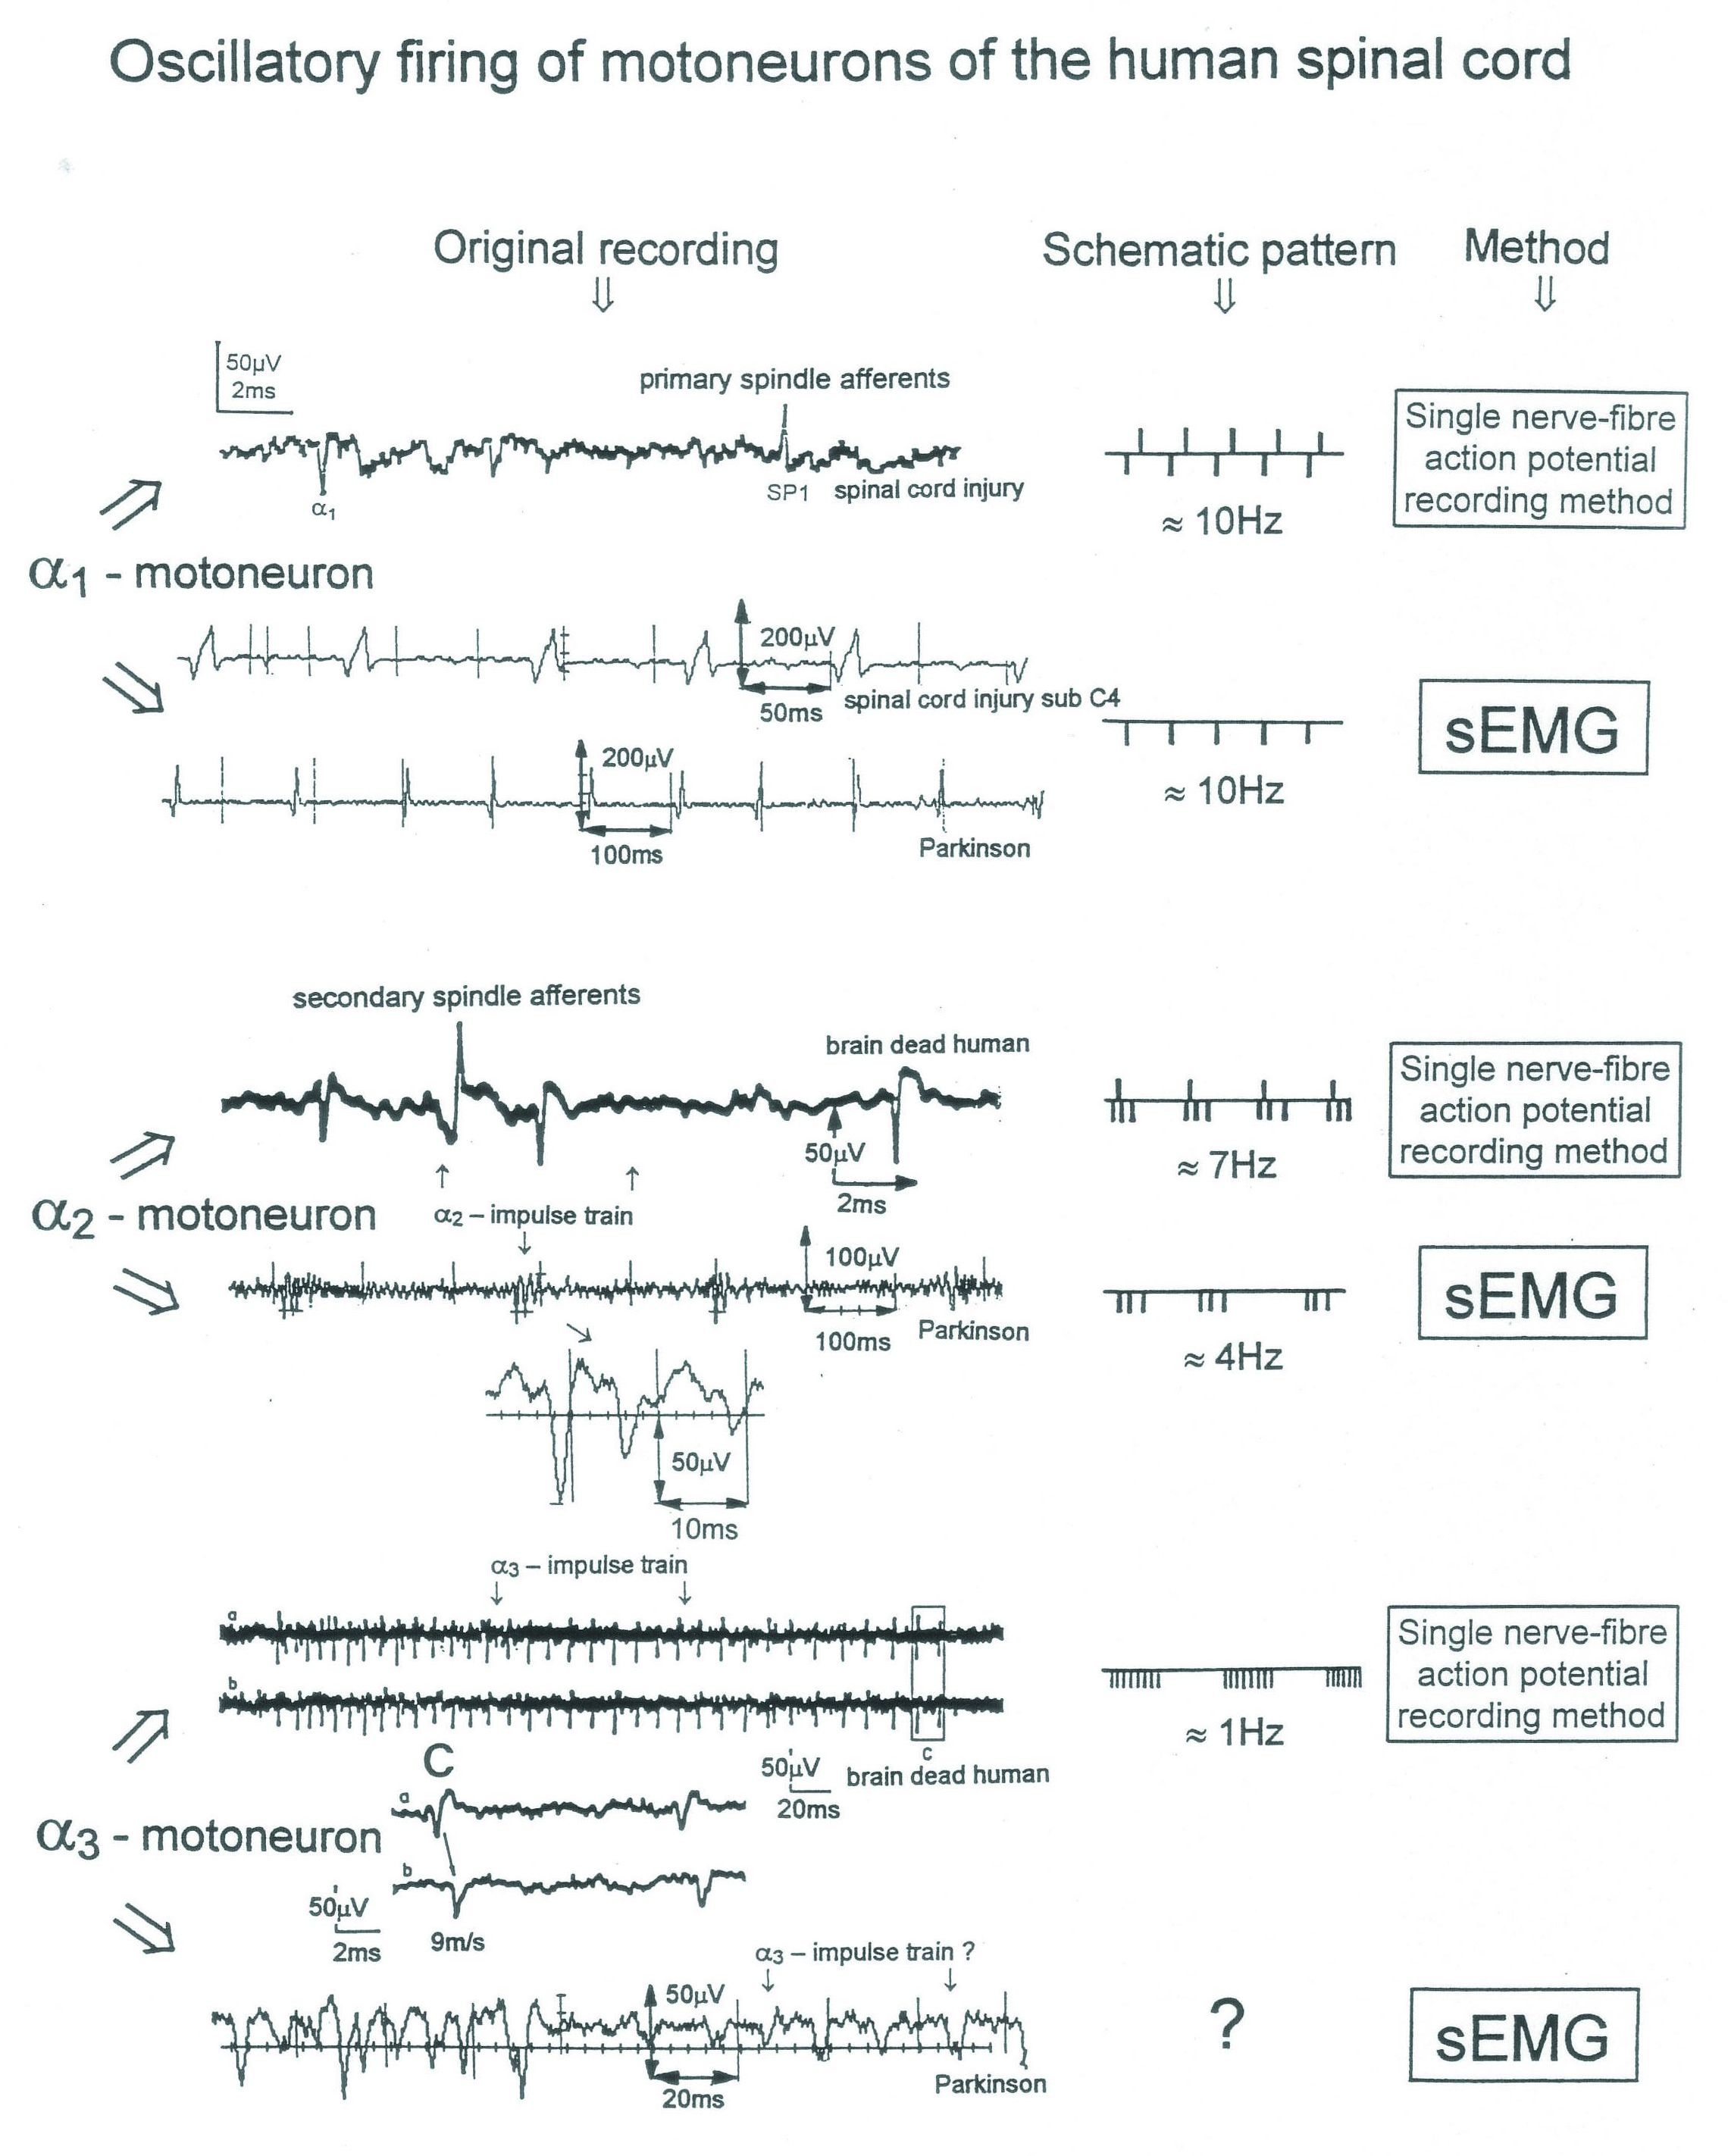
Figure 10. Oscillatory firing patterns of a1, a2, and a3-motoneurons recorded from motoneuron axons with the single-nerve fiber action potential recording method and by surface electromyography (sEMG) from FF, FR, and S-type motor units. The left panel shows original recordings, the middle panel the schematic patterns; the recording methods are indicated on the right side. The recordings were taken from patients with spinal cord injury and Parkinson’s disease and from brain-dead humans. Note that the single-nerve fiber action potentials are much shorter than the motor-unit action potentials.
Motor program generation, oscillatory firing and coordination among a1-motor units (FF-type)
It can be seen from Figures 11 and 12 how the CNS generates a motor program in a muscle, if only a few a1-motor units can be activated in that muscle. By increasing the load on the special CDT device (in Newton’s), more muscle power is required to perform the movements and the motor unit firing rates increase in that the motor units start to fire more rhythmically and with increasing frequency (Figure 15). Motor units coordinate their firing in order to avoid tremor.
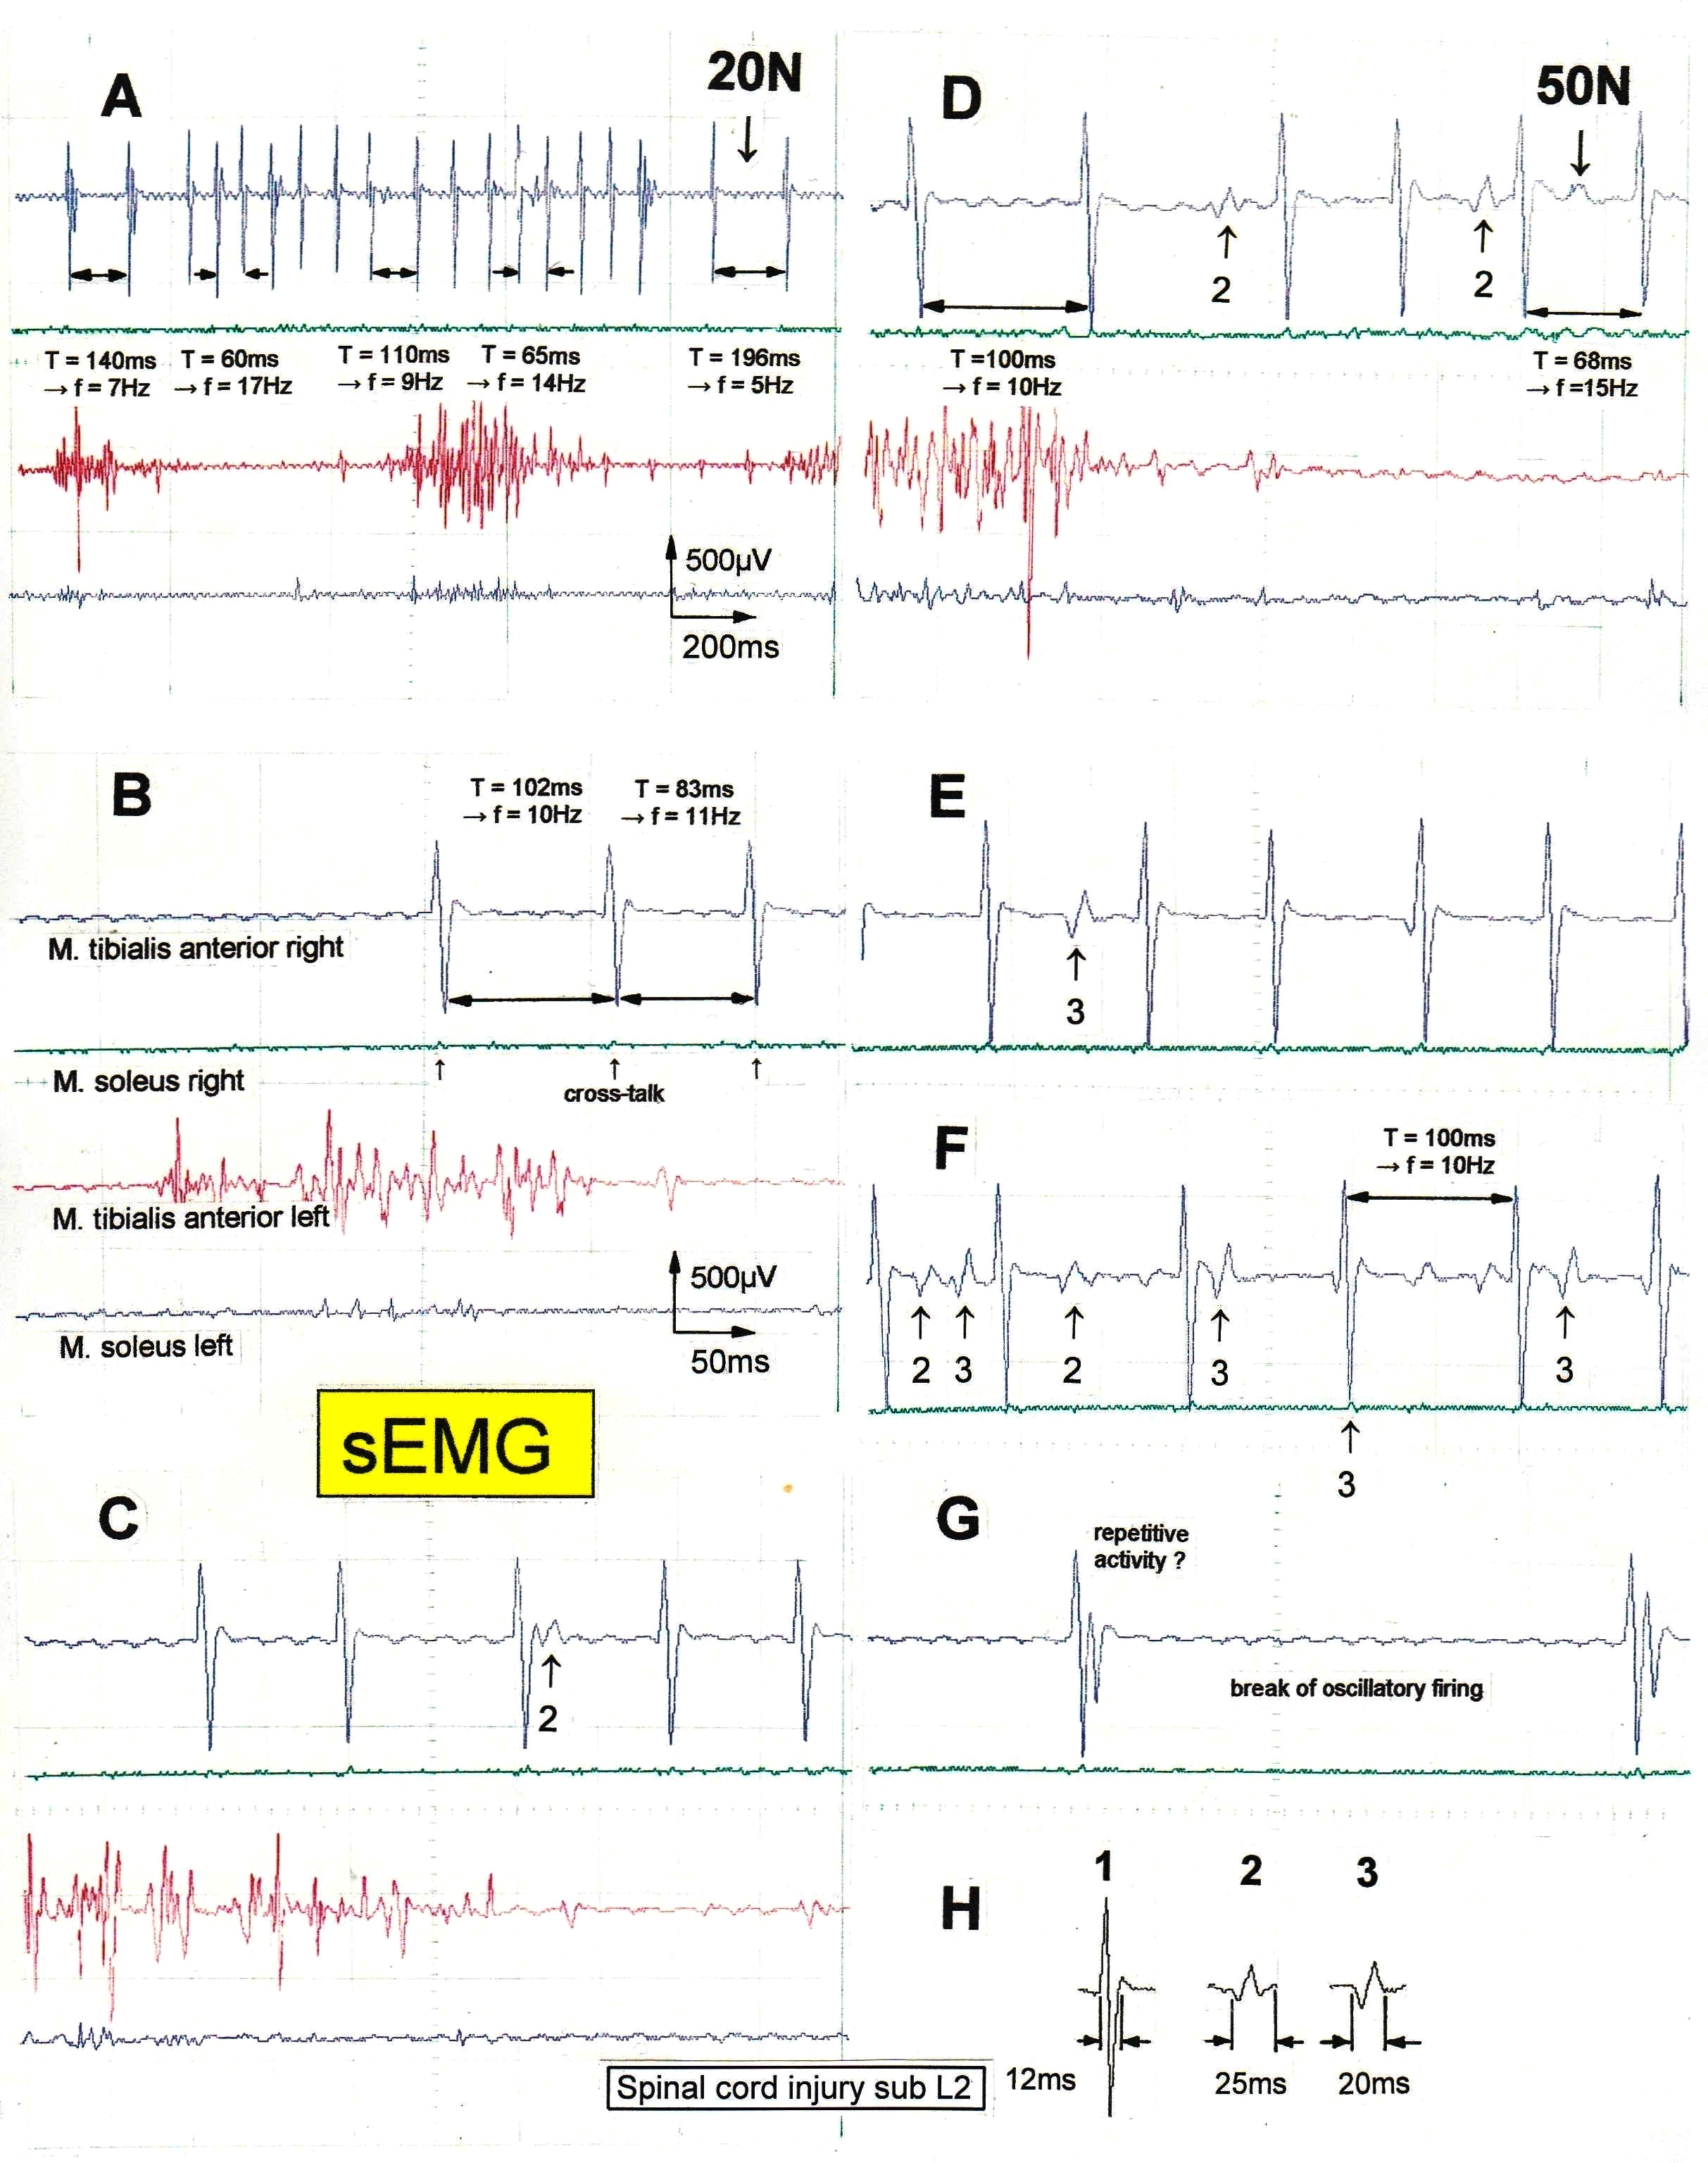
Figure 11. Non-synchronous partly coordinated firing of FF-type motor units of the right tibialis anterior muscle from a patient with spinal cord injury sub L2 suffered in an accident, measured by surface EMG; the firing was activated by exercising on the special coordination dynamics therapy device at the loads of 20 and 50N. Oscillation periods (T [ms]) and oscillation frequencies (f [Hz]) of oscillatory firing motor unit 1 are partly indicated. The waveforms of 3 motor units are identified in the right tibialis anterior muscle (top trace) and are shown in ‘H’. Motor units 2 and 3 are marked in ‘A’ through ‘G’; the identification of large amplitude motor unit 1 is obvious. The left tibialis anterior muscle (third trace) shows already a motor program; little activity in the soleus muscles for this low-load activation.
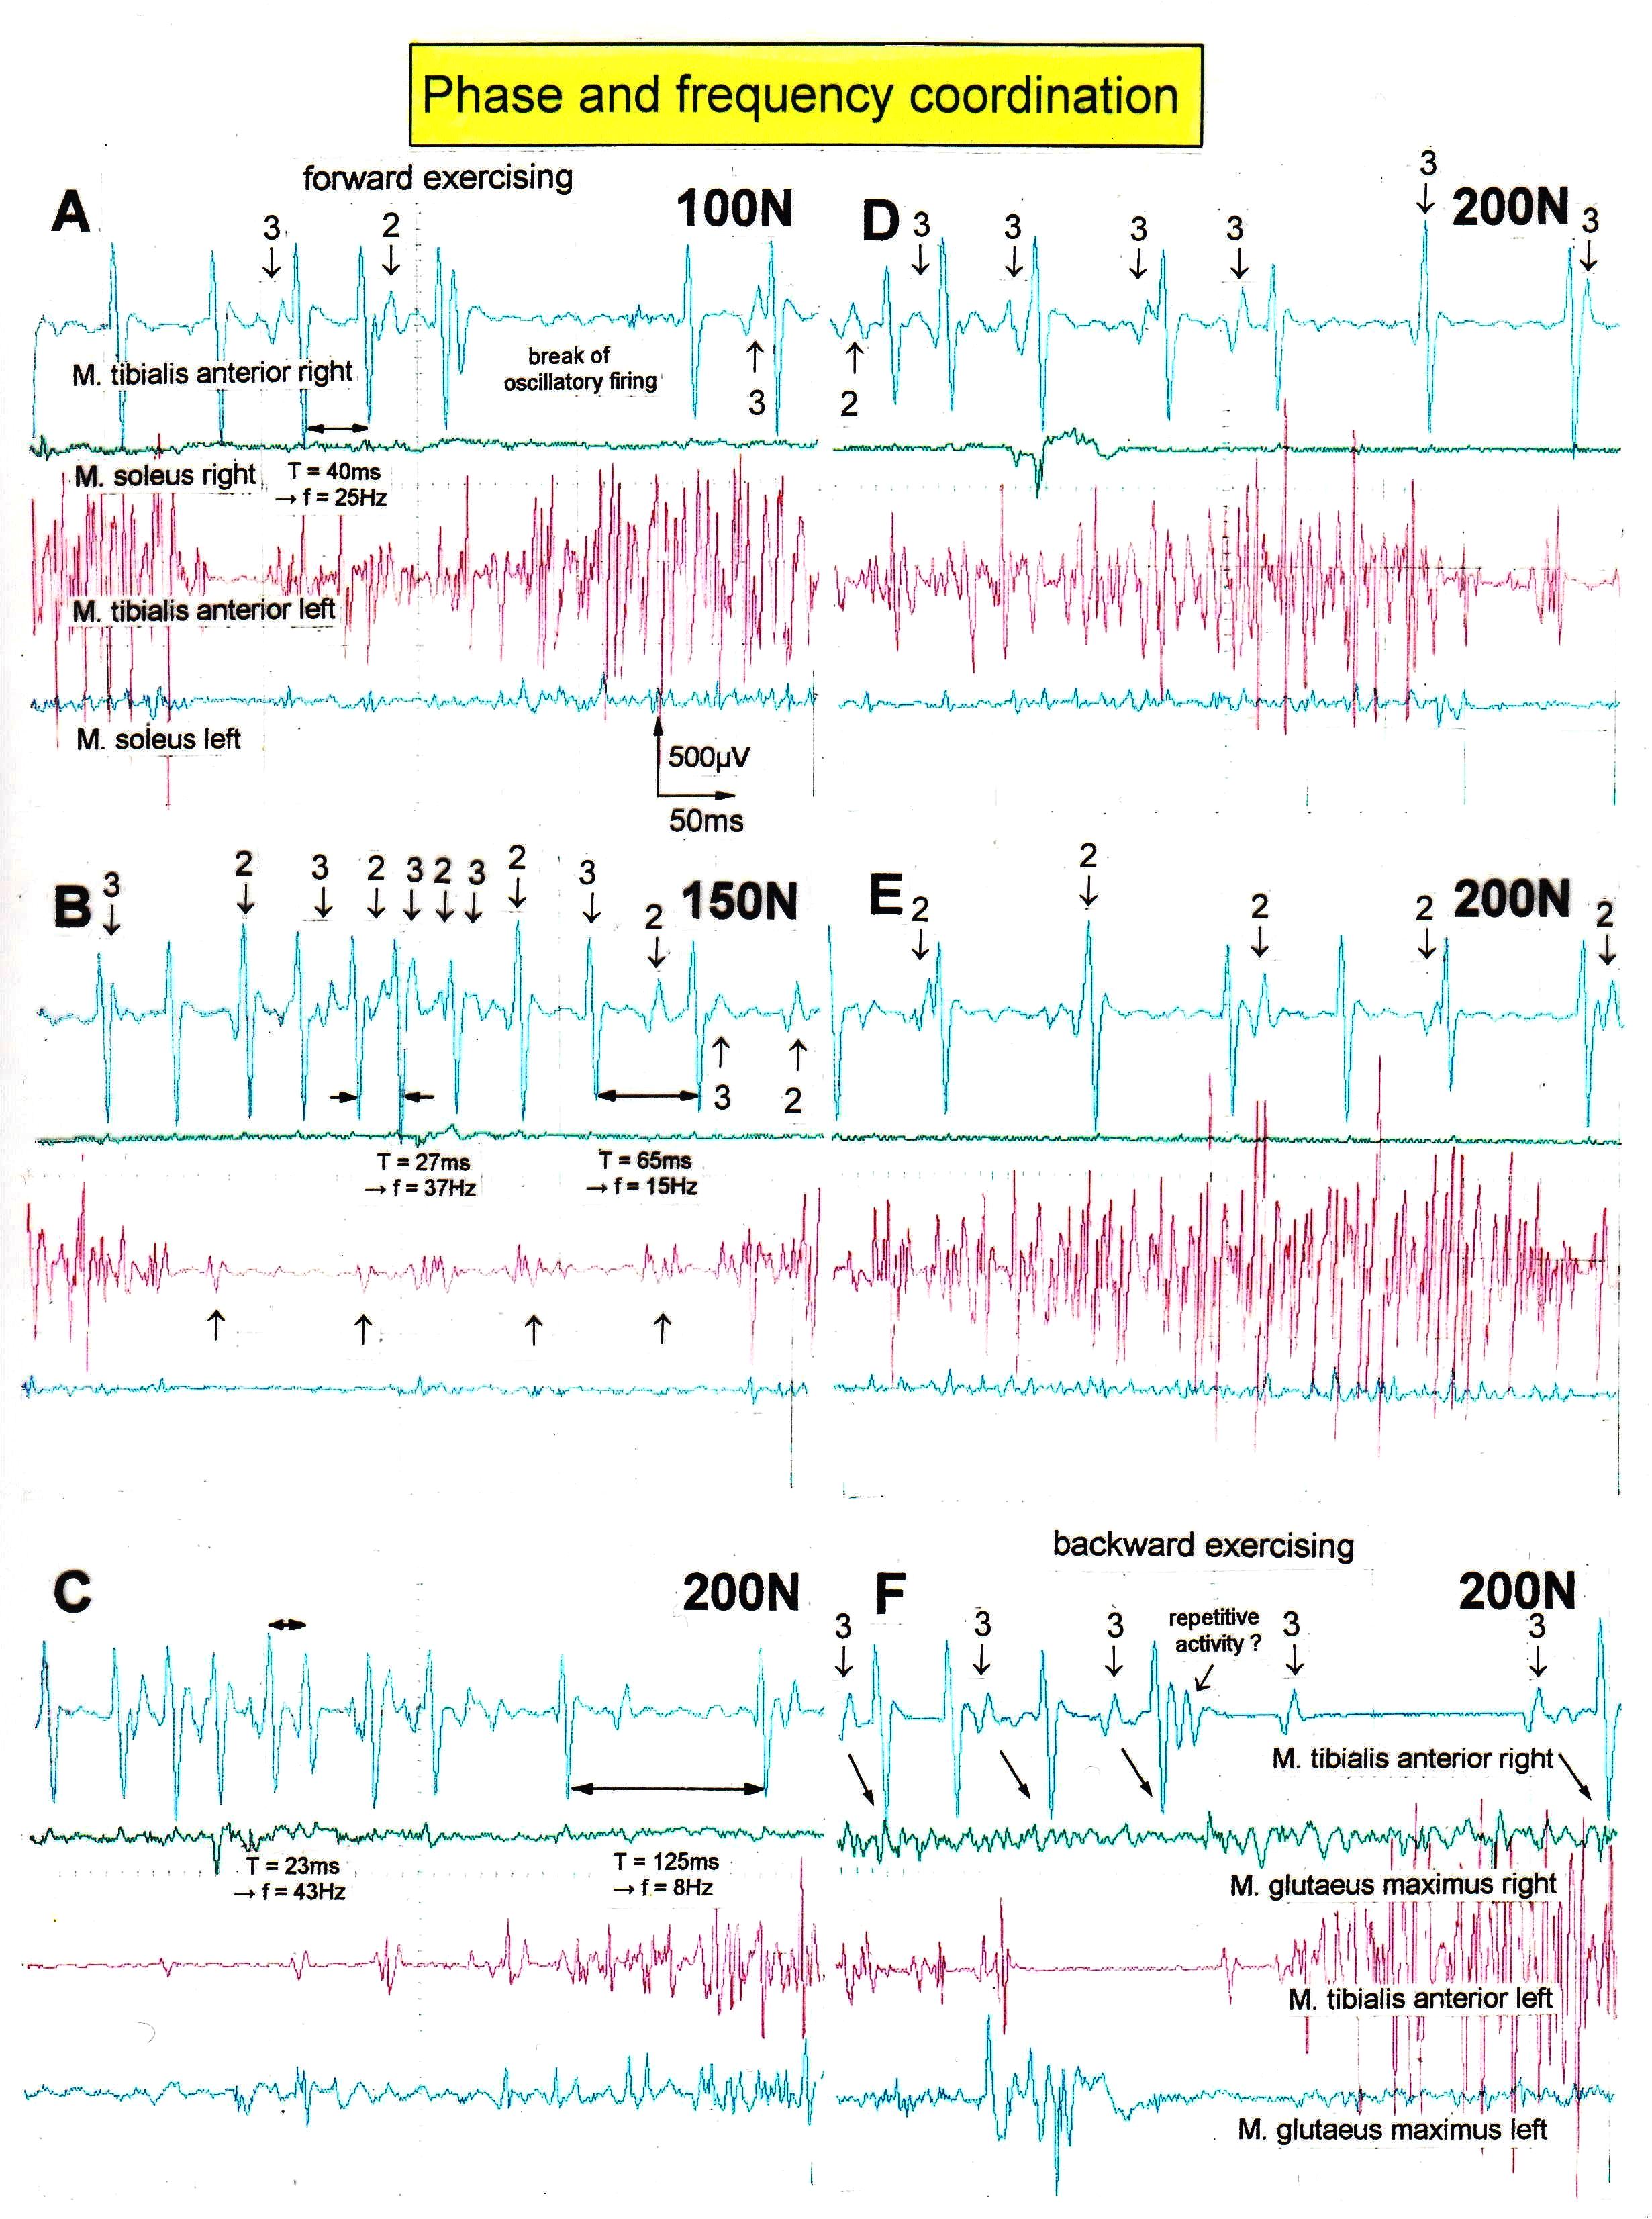
Figure 12. Phase and frequency coordination between oscillatory firing motor units (FF-type) during the generation of a motor program during exercise on the special coordination dynamics therapy device at loads increasing from 100 to 200N. Oscillation periods (T) and oscillation frequencies (f [Hz]) of oscillatory firing motor unit 1 are partly indicated. ‘A,B,D,E’ same recording situation as in Figure 11; ‘C,F’ soleus electrodes shifted to gluteus muscles to check early re-innervation upon therapy. The waveforms of the 3 identified FF-type motor unit potentials ‘1’, ‘2’, and ‘3’ are the same as in Figure 11; motor units ‘2’ and ‘3’ are partly marked. In ‘F’, some coordination’s between motor unit ‘3’ and ‘1’ are marked.
In a patient with a spinal cord injury (injury level sub L2 following an accident), the left tibialis anterior muscle (third trace in Figure 11) was already strongly re-innervated after two years of treatment. The overlapping of the motor unit potentials was so strong that single motor unit firing could only be seen occasionally. In the right tibialis anterior muscle (top trace in Figures 11 and 12) however, oscillatory and coordinated firing of mainly 3 single a1-motor units could be identified. Figure 11H shows the wave forms of the 3 different motor unit potentials (1, 2, and 3). Motor unit 1 had the lowest threshold and the largest amplitude. In the majority of cases, the motor units can be identified safely, though not always. It is especially difficult when the motor units fire simultaneously or nearly simultaneously. It will now be shown how the firing frequencies and coordination between a1-motor units firing (FF-type) changes for different movements and loads.
Firing frequency increases with increasing load
In Figure 11A, motor unit 1 fired oscillatory for a certain period of time to generate a motor program when the patient exercised at the load of 20N on the special CDT device. The frequency fluctuated between 5 and 17Hz. Quite often, the frequency of this motor unit 1 was in the order of 10Hz for low load exercising at 20 or 50N (Figure 11). Motor units 2 and 3 fired mostly only occasionally. In Figure 11F, motor unit 3 fired transiently oscillatory at the frequency of approximately 6Hz.
For exercising at higher loads, the firing frequencies of the motor units increased. At 100N, motor unit 1 reached 25Hz (Figure 12A); the corresponding values at 150N and 200N being 37 Hz (Figure 12B) and 43 Hz (Figure 12C). Also, motor units 2 and 3 increased their firing rates. They started to fire also rhythmically with increasing frequencies for increasing load. At 150N (Figure 12B), motor unit 2 and 3 reached the frequency of 22Hz and 25Hz respectively. Exercising at 200N is a rather high load, even for a healthy person. The lowest frequencies measured at 200N were 9Hz and 10.5Hz for motor unit 2 (Figure 12E) and 3 (Figure 12F), respectively. For some time, motor unit 1 stopped firing oscillatory (Figure 12F).
Motor program development
In the left tibialis anterior muscle, motor unit activity was recorded when muscle power was needed, and none or nearly none was recorded when no muscle power was needed, in some similarity to the physiologic motor programs (Figures 11,12, third trace). In the right tibialis anterior muscle (top trace) the activation pattern was different. When the muscle had to be activated the motor units were more activated and when no muscle power was needed, less activity was recorded (Figures 11A,12B) (Figures 11B,G,12E,F). The activity of the motor units increased and decreased. For high load exercising, the motor units fired rhythmically with increasing and decreasing frequencies. During low load exercising, the motor units fired rhythmically with low frequencies or stopped firing in an oscillatory manner and fired only occasionally. The activity changes from motor unit firing to no motor unit firing during the motor program were not as pronounced in the right tibialis anterior muscle, where only a few motor units could be activated, as in the left tibialis anterior muscle. It was as if inhibition were missing. Inhibition is necessary to give motor unit firing patters their structure. If the mutual inhibition among motoneurons is missing, the motoneurons synchronize their firing and tremor occurs as in patients with Parkinson’s disease. As measured earlier, the high activity mode of α-motoneuron firing is the oscillatory firing (Figure 6).
Phase and frequency coordination between the firing of the motor units
But how did the motor units coordinate their firing? As can be seen from Figures 11 and 12, the motor units did not synchronize their firing. In Figure 11F, motor unit 1 is firing in an oscillatory manner at around 10Hz and motor unit 3 shows a phase lag of 22ms with respect to motor unit 1 (the 2 right potentials). But when motor unit 2 fired additionally (on the left part of the trace), motor unit 3 changed its phase with respect to motor unit 1 so that all 3 motor units fired unequally to give rise to a smooth non-rhythmic muscle contraction. In Figure 12D (200N), motor unit 3 fired approximately at the same time as motor unit 1. The motor unit potentials partly added up, because of partial synchronized firing of the corresponding motoneurons. The distributed firing of motor units was poor at that time interval. In Figure 12E, motor unit 2 fired approximately at the same time as motor unit 1. In Figure 12F, motor unit 3 fired in phase correlation to motor unit 1, but it was not synchronized. When motor unit 1 transiently stopped to fire in an oscillatory manner, motor unit 3 continued firing in an oscillatory manner. When motor unit 1 started to fire in an oscillatory fashion again, the same phase coordination built up to the firing of motor unit 3. For the high activation parts in Figure 12B,C, motor units 1, 2 and 3, and some other unidentified units, fired very close to each other (but not in a synchronized manner) and the potentials overlapped, because the frequencies were very high to generate strong muscle power.
Phase and frequency coordination’s between a1-motor unit firing of different muscles and different arms
Figures 11 and 12 show relative phase and frequency coordination for motor unit firings in the same muscle, namely the right tibialis anterior muscle, of a patient with a spinal cord injury sub L2 suffered during an accident. Figure 13 shows phase and frequency coordination among motor units between different muscles and arms in a spinal cord injury patient (sub C4/5). A single FF-type motor unit of the right flexor carpi radialis muscle fired at approximately 8Hz when activated on volition (Figure 13A). In Figure 13B, the same motor unit is seen firing at 12.5Hz. This motor unit fired in relative coordination (marked with the arrows) with another single FF-type motor unit in the left flexor carpi radialis muscle. The phase relations have different values in ‘A’ and ‘B’. However, also note that the motor unit in the flexor changed its oscillatory firing from 6.7Hz to 10Hz, probably to develop more motor unit force. Not every motor unit potential is correlated. There may be correlations to motor units of other muscles which were not recorded from. In Figure 13C, phase relations are indicated with the arrows from the right extensor carpi radialis to the left extensor carpi radialis. In Figure 13D, phase relations are indicated by the arrows from the left extensor carpi radialis to the left flexor carpi radialis. Thus, there is coordinated firing between all motor units activated on volition, when the patient is not exercising on the special coordination dynamics therapy device but is in position to do so.
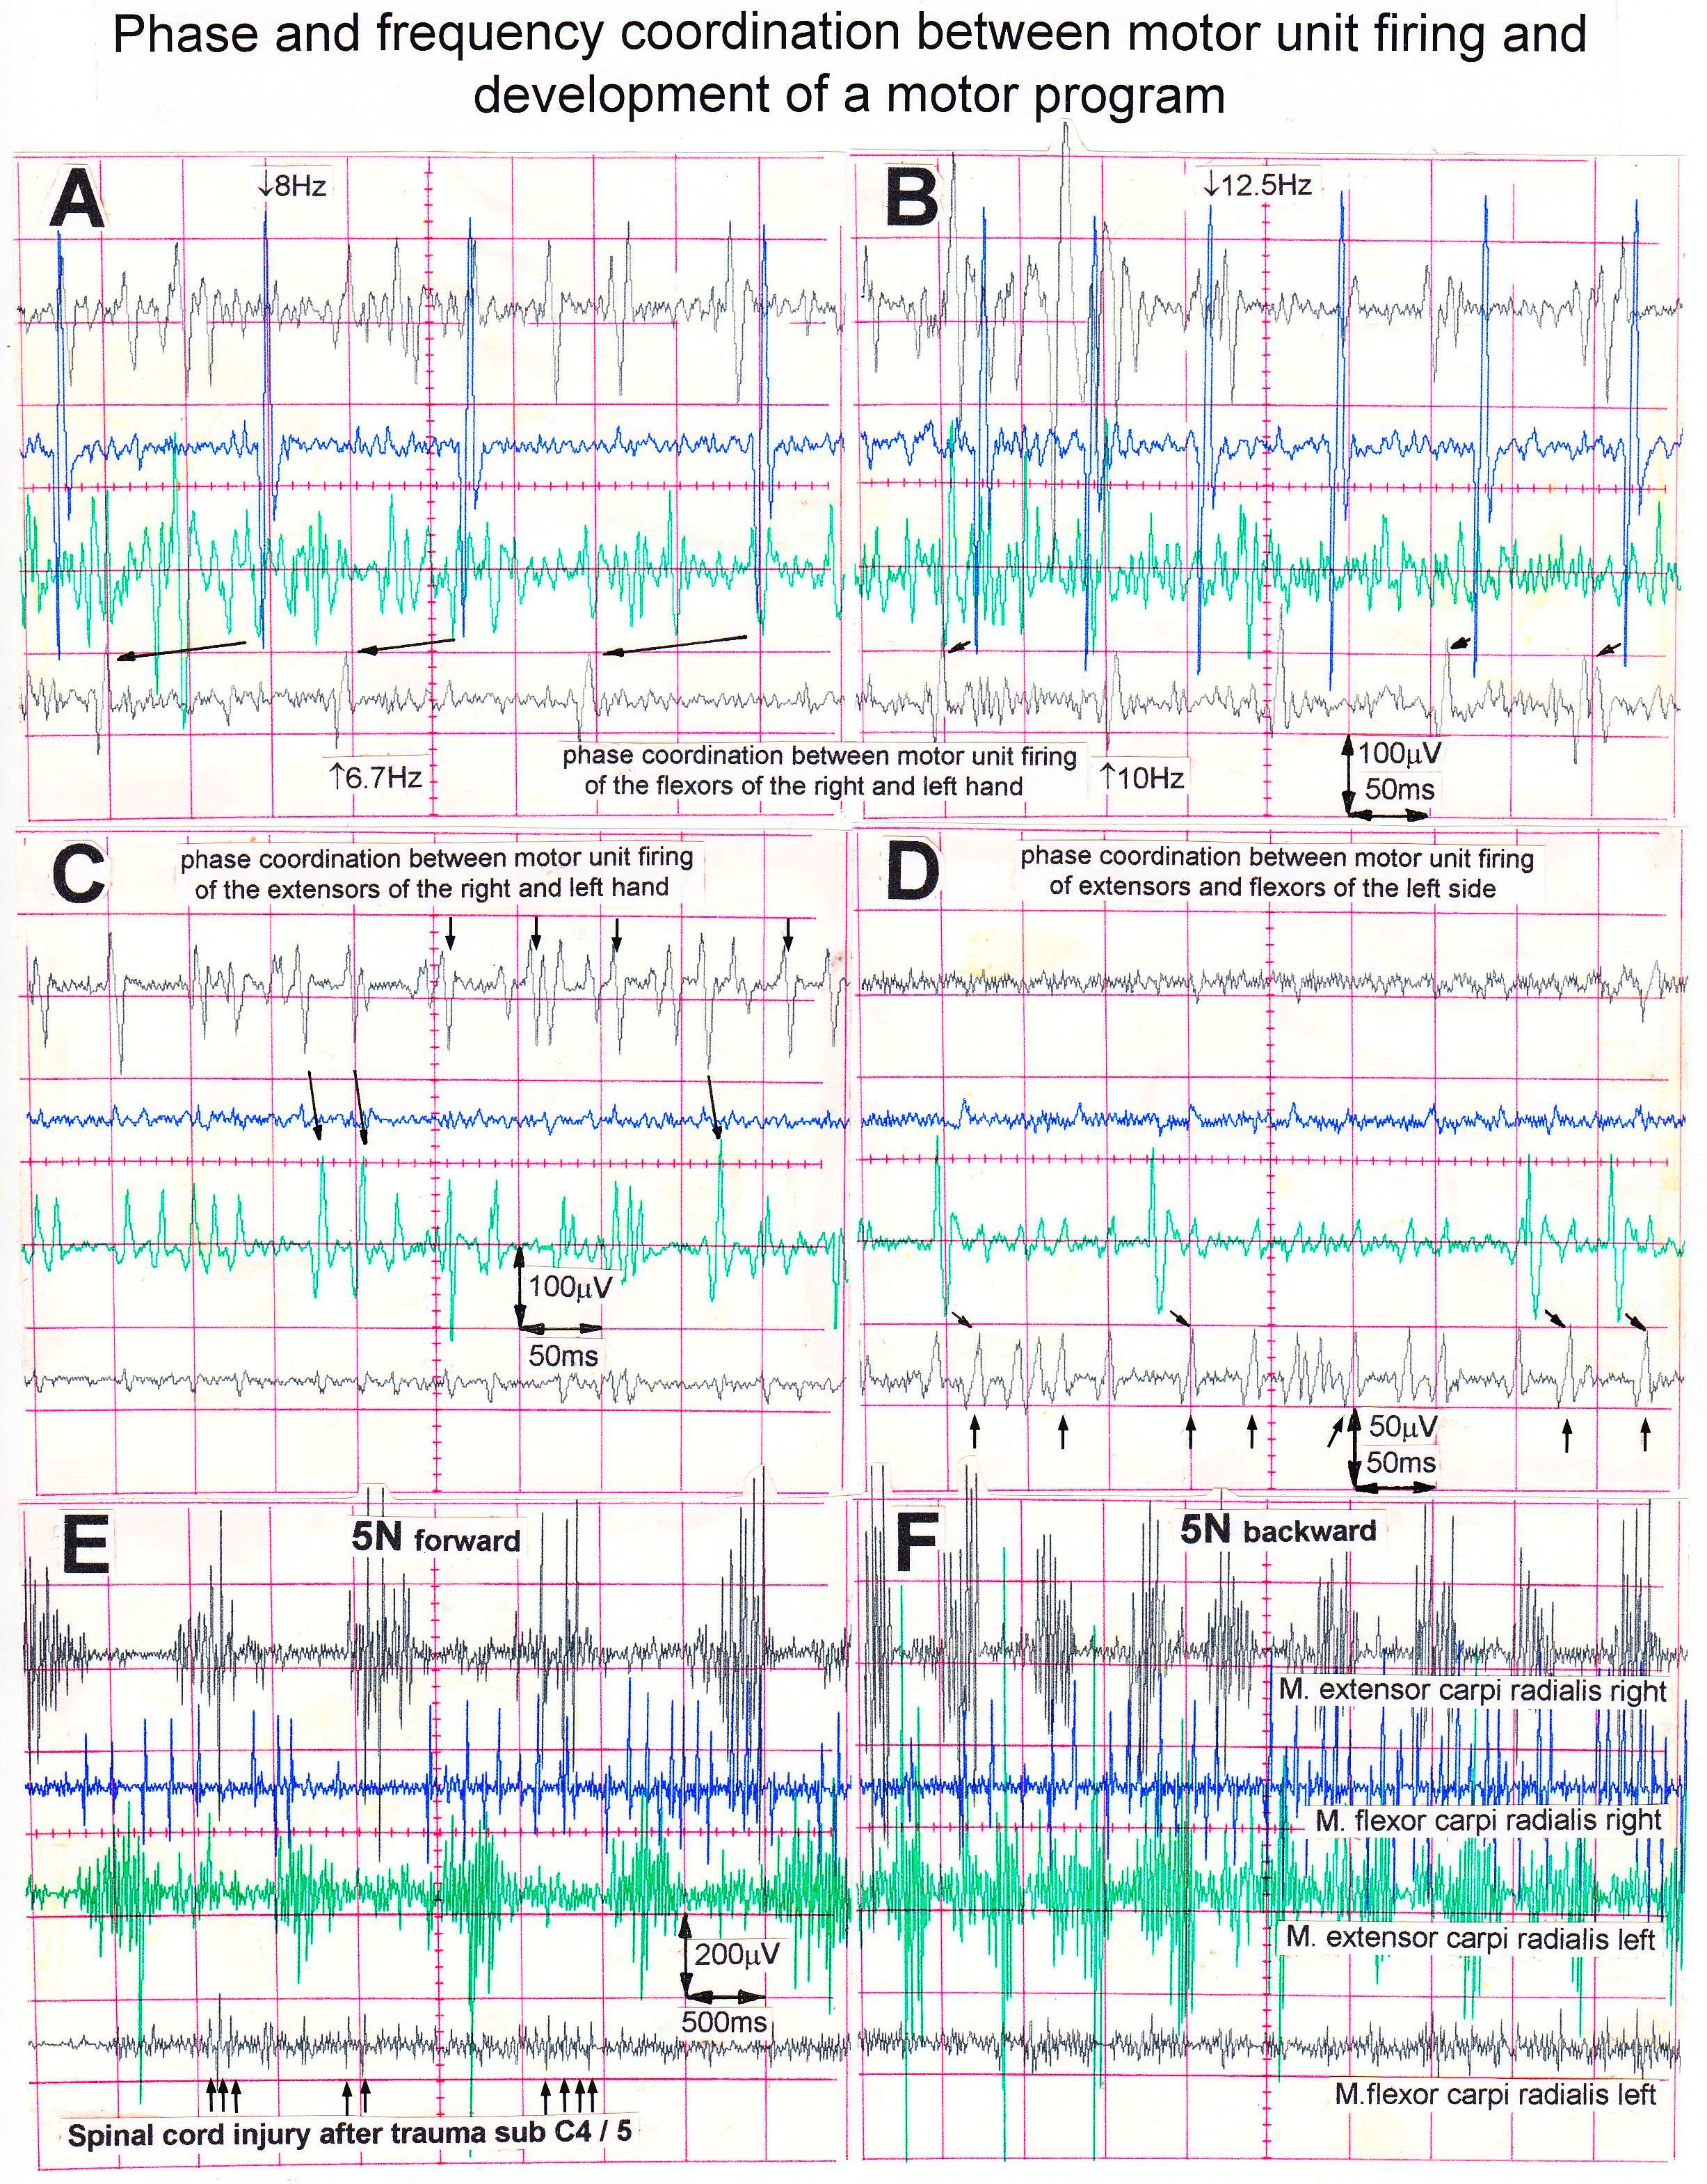
Figure 13. Phase and frequency coordination of single-a1-motor unit firing between different muscles and between different arms. Phase coordination’s are indicated by the arrows between motor unit potentials. A-D. The patient with a spinal cord injury was in position at the special coordination dynamics therapy device but activated muscles on volition upon looking onto the oscilloscope screen. E,F. Patient exercising on the special device. Note the beginning of the appearance of a motor program in the right flexor carpi radialis muscle for 5N forward turning. Recordings for a patient with a complete spinal cord injury sub C4/5.
During exercise on the special coordination dynamics therapy device at 5N, a motor program was partly generated in the right and left extensor carpi radialis muscles (Figure 13E,F). In the right flexor carpi radialis muscle, the CNS tried to build up a motor program with 2 or 3 innervated motor units. In the left flexor carpi radialis muscle no motor program was generated, even though small motor unit potentials can be seen (marked by the arrows in Figure 13E).
Coordinated firing of neurons, their impairment and repair by learning
In every CNS injury, surgery, degeneration, malformation or aging the phase and frequency coordination [22] of neuron firing becomes impaired [28] and disturbs or destroys CNS self-organization. Also, the organization of sub-networks and their communication becomes impaired. The impairment of the sub-network ‘premotor spinal oscillator’ by injury can be nicely measured by the variation of the oscillation frequency. In rather physiologic cases, such as in brain-dead humans, the premotor a2-oscillators fire rhythmically with a certain Eigen-frequency. Following spinal cord injury, the oscillators lose their Eigen-frequency to some extent and fire at many different frequencies (Figure 14).
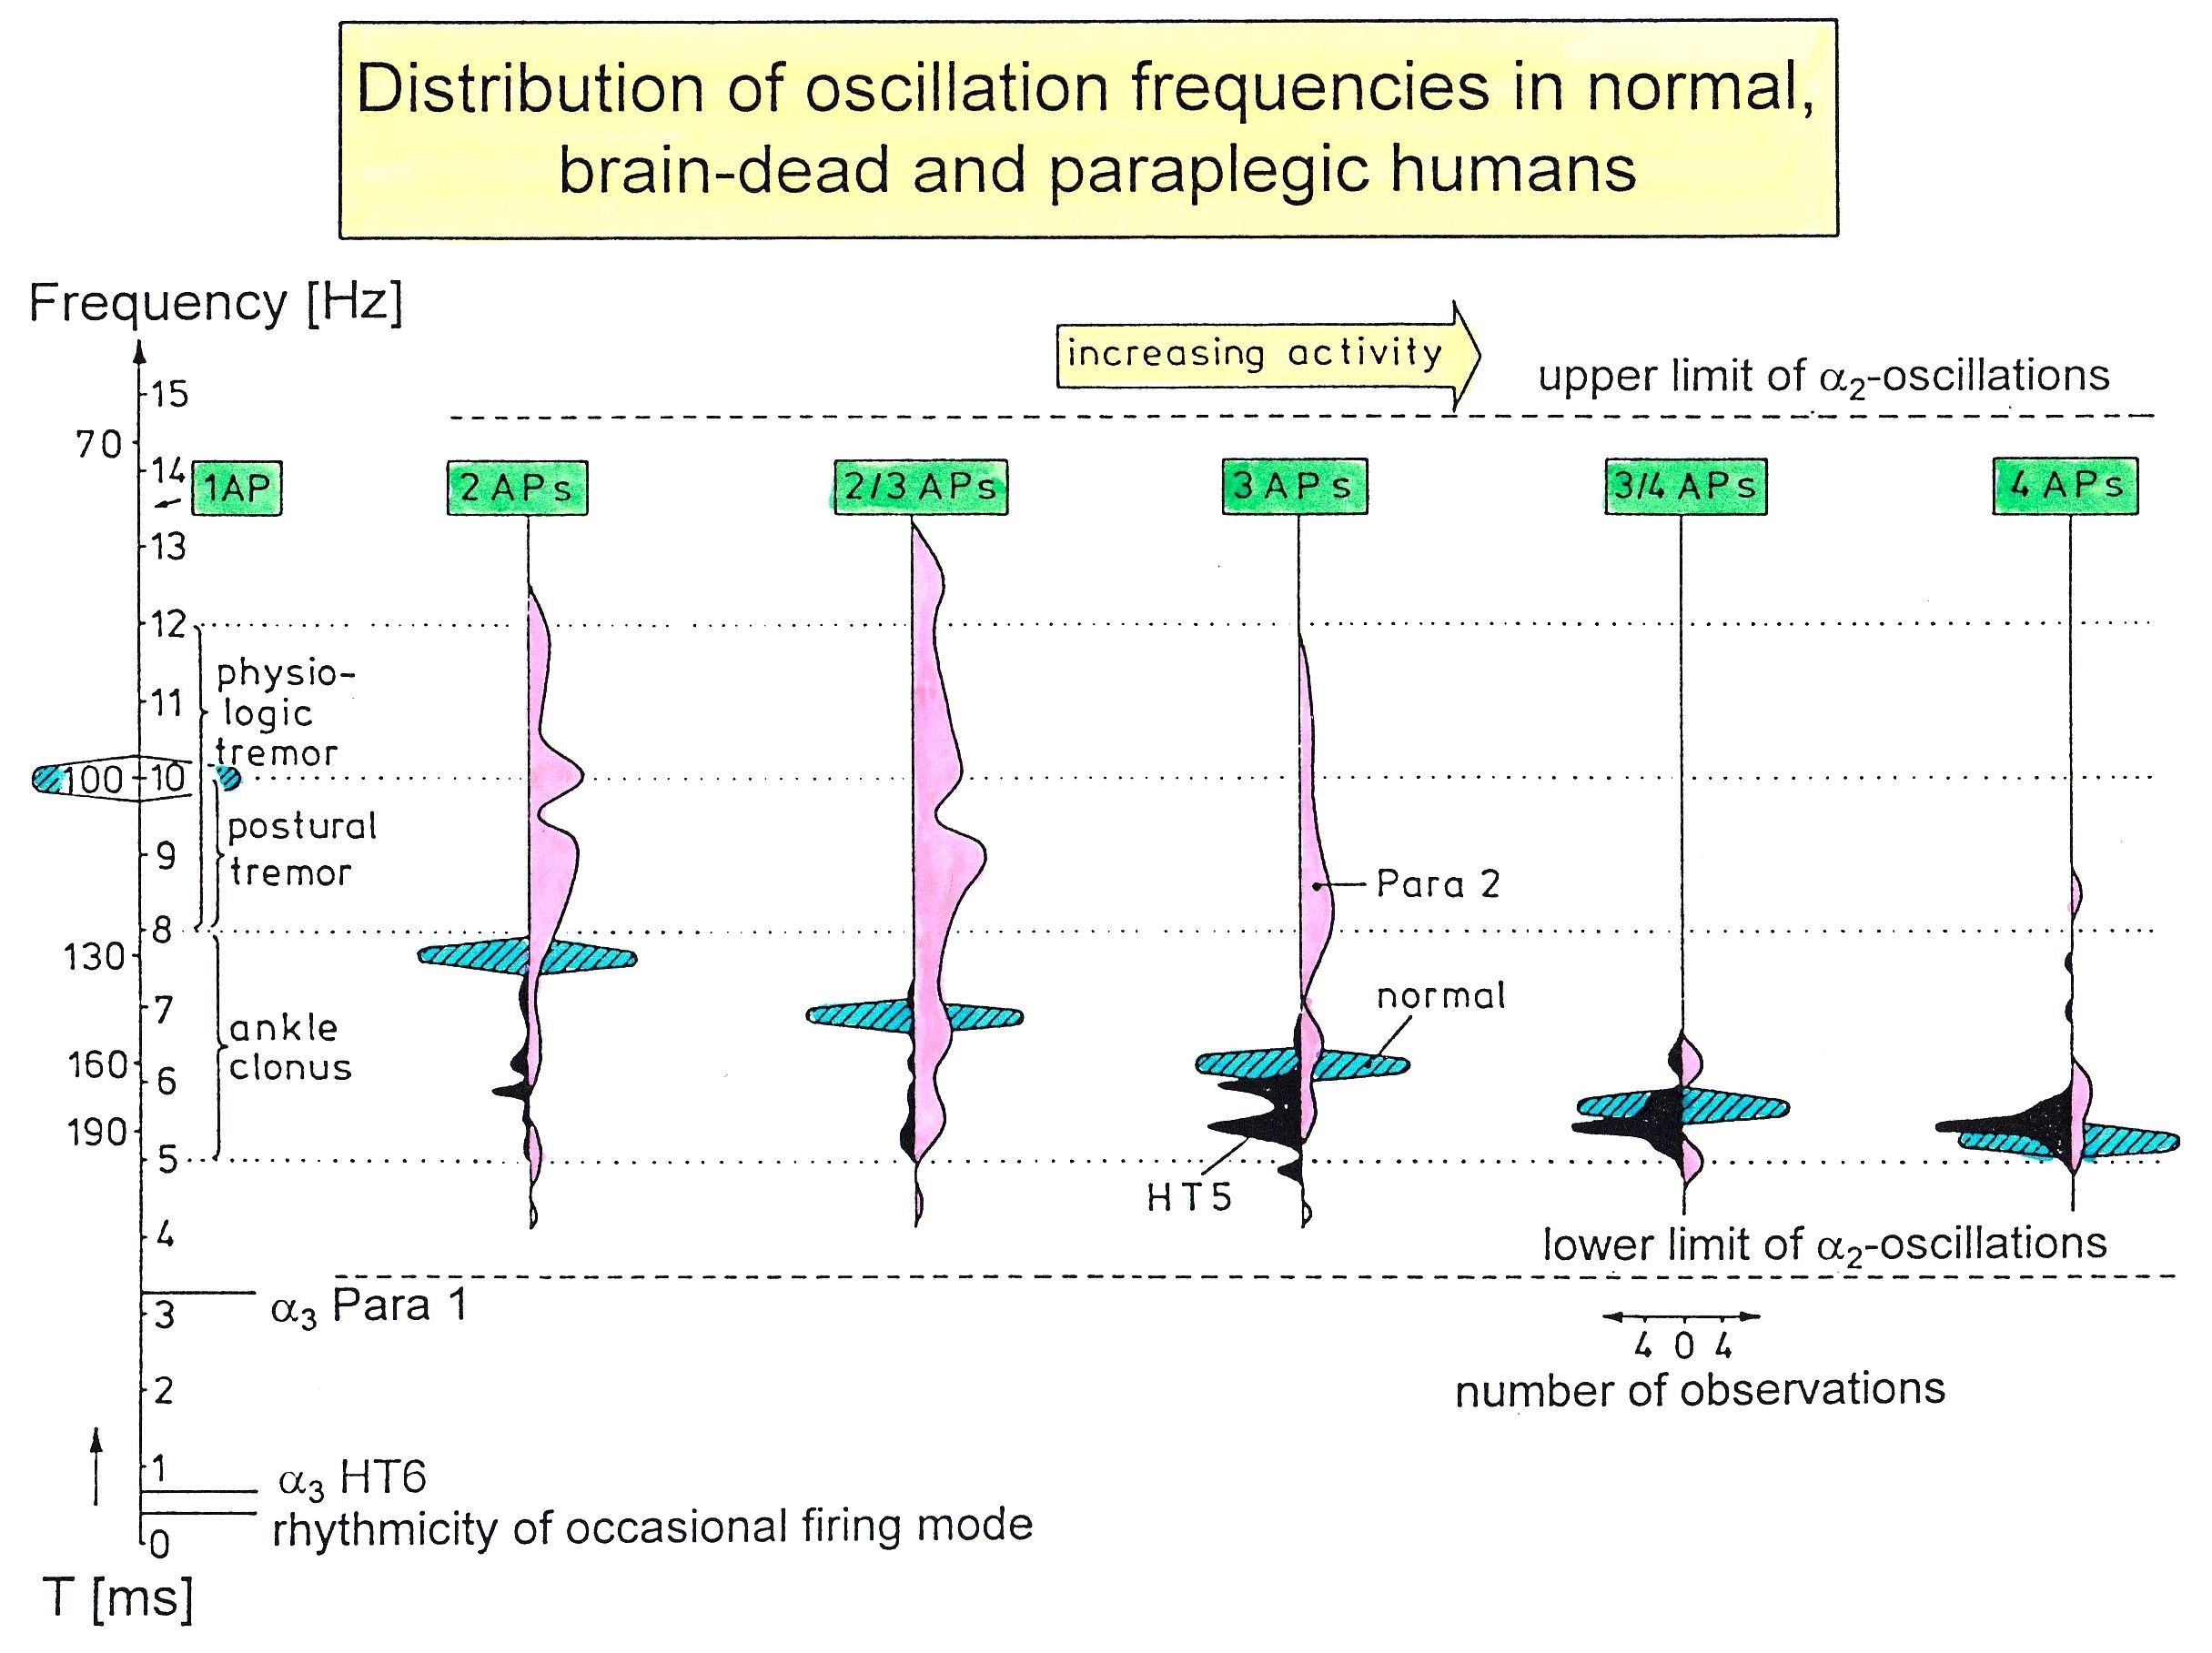
Figure 14. Frequency distributions of oscillation frequencies of continuously oscillatory firing a2-motoneurons with increasing number of APs per impulse train (increased activity) in paraplegic 2 (open), in brain-dead HT5 (filled), and probably normal human (cross-hatched). Frequencies and rhythmic activity changes in the occasional and oscillatory firing mode are indicated. Ranges of physiologic tremor, postural tremor and ankle clonus are also drawn. Note that frequencies for the brain-dead HT5 are too low, and the oscillation frequencies of the spinal cord isolated for a long time (Para 2) are too high and too spread as compared to the theoretically predicted frequency ranges (cross-hatched). T = oscillation frequency.
The impaired coordination between nerve cells and arm and leg movements following injury can be improved especially by exercising on the special CDT device, which is very precisely manufactured (Figure 15) [1,2]. The exactness of the device guarantees that the coordinated arm and leg movement induced afferent input can teach the neurons of the CNS to improve their coordinated firing up to within a few milliseconds. Since the neurons work as coincidence and more widely as coordination detectors, this improved coordinated firing improves for example the communication among nerve cells and neural sub-networks (especially between networks across an injury site as for example in spinal cord injury) because the threshold of neuron excitation is reached earlier. The training of phase and frequency coordination via coordinated arm, leg and trunk movements improves not only the self-organization of the corresponding sub-networks but also the functioning of the CNS neural networks in general by learning transfer [15]. Some motor and other patterns re-appear upon this improved coordination at the neural and movement level. For example, a child with cerebral palsy learned to speak following exercise on the special device through learning transfer [1].
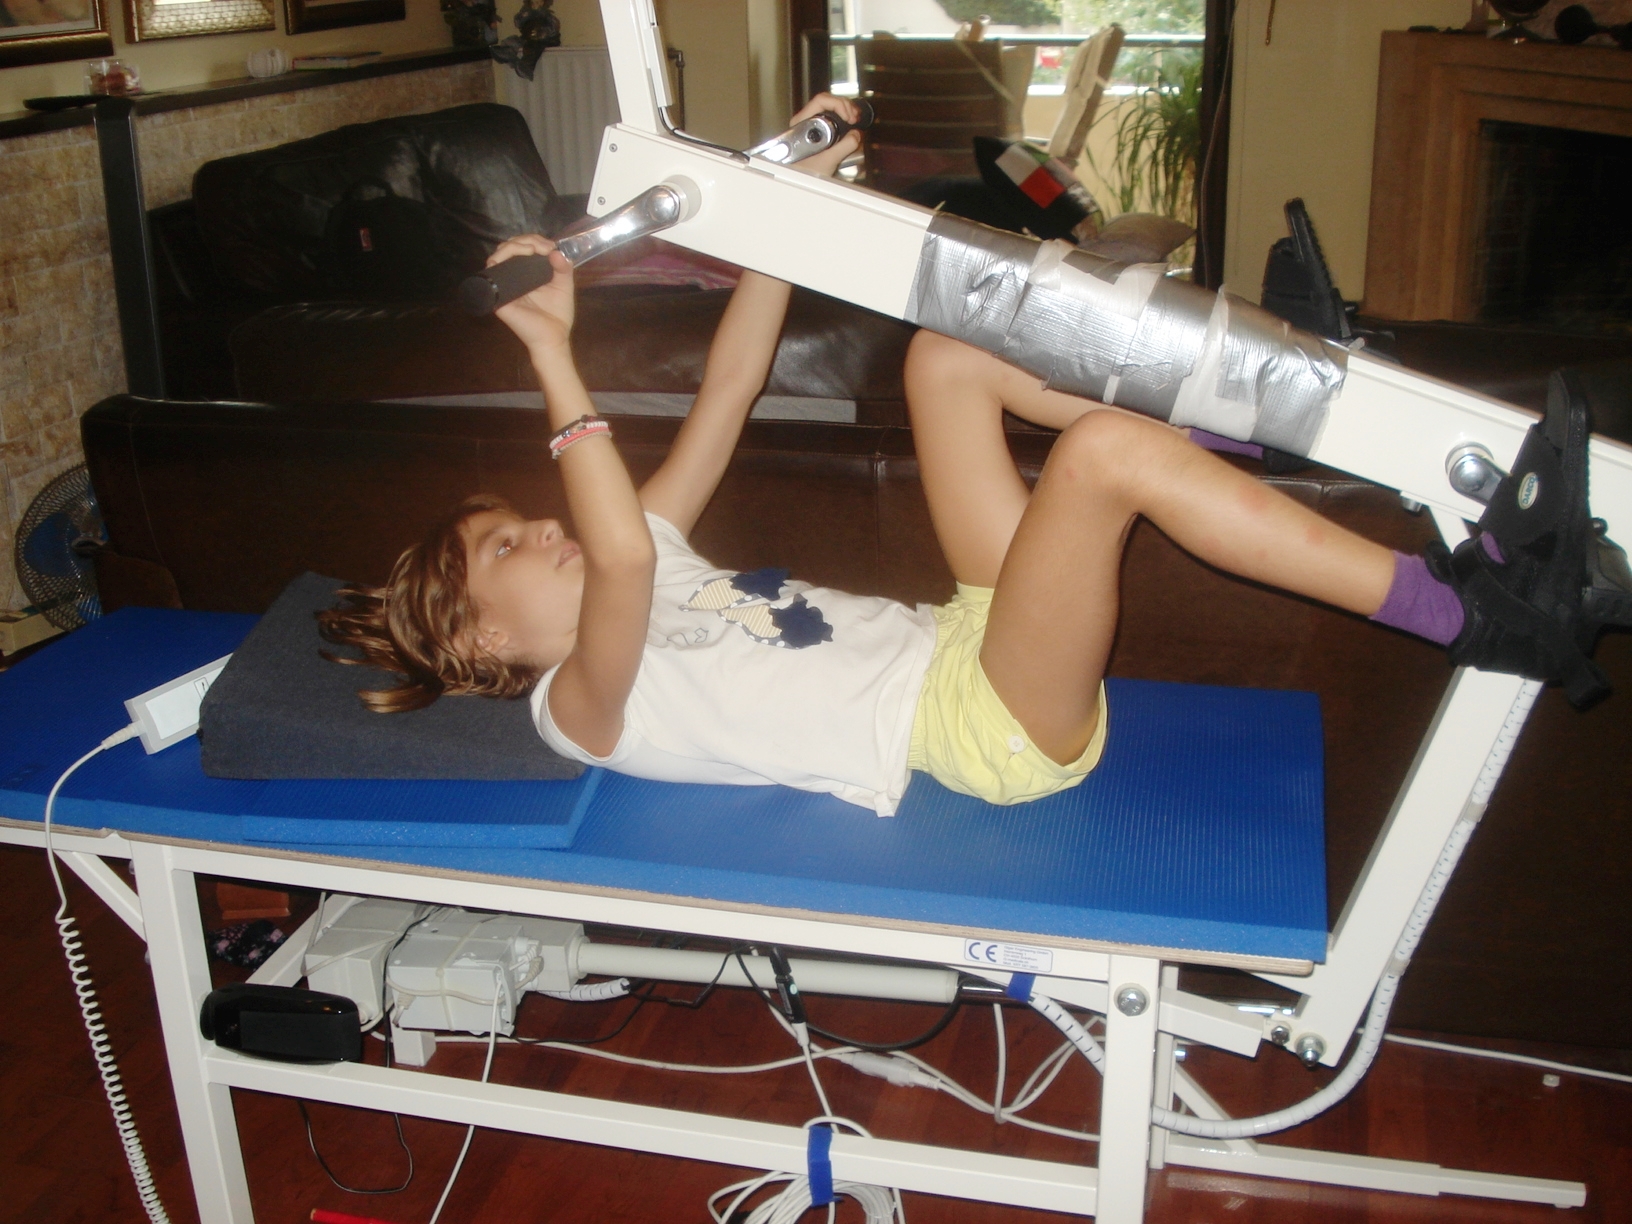
Figure 15. The ten-year-old Nefeli with an incomplete spinal cord injury is exercising coordinated arm, leg and trunk movements in the recumbent position to improve the coordinated firing neurons and sub neuronal networks. This special CDT device for measuring and therapy (int.pat.) is produced by the firm: Giger Engineering, Martin Giger dipl.Ing.ETH/SIA, Herrenweg 1,4500 Solothurn, Switzerland, www.g-medicals.ch.
To understand the on-going changes of movement and other patterns in healthy humans and in patients with CNS injury, malformation and degeneration (aging), the System Theory of Pattern Formation is used. In a complex system like the human CNS, patterns are generated by a nervous system which seeks cooperative stability. Stability is what defines collective states. The system has the tendency to slip into the collective states to which it is attracted. When an infant crawl, its arms and legs are strongly attracted to the ‘pace’ and ‘trot’ gait patterns. The attraction is so strong that intermediate crawling patterns seemingly do not exist, as if the patterns are hard-wired. But with the help of the special CDT device the CNS can generate intermediate coordination patterns. A patient with a CNS injury often crawls with intermediate arm and leg coordination patterns and has to re-learn the pace and trot gait coordination’s for CNS repair and shifts in this way the attractors for crawling to the pace and trot gait coordination’s. Attractive states and attractors of CNS organization can be pictured as a ball in a potential well or more generally in an attractor layout. Changes in CNS functioning are characterized as continuous stabilization and destabilization, over time, of preferred attractor states.
To reduce for understanding the complexity of human neural networks of the many billions of neurons, order parameters or collective variables are introduced for the generation of certain movements. An equation of motion describes the coordination patterns dynamics. However, coordination patterns are not only determined by the task or biological function. Patterns adjust continuously to requirements from the environment (transmitted by impulse patterns from stimulated receptors in the periphery), memory, intention, and support given by a therapist. The specific requirements are captured by the concept of behavioral information and are made part of a vector field that attracts toward the required patterns. The coordination pattern dynamics, characterized by equations of motion of collective variables (the vector X), takes the general following form [23].
dX/dt = Fintr(X) + ∑cinfFinf(X,t) (2)
where Fintr designates the intrinsic dynamics of the nervous system. These intrinsic dynamics capture the anatomical (neuronal network structure), physiological and pathological states of the CNS and its muscular-skeletal elements.
∑cinfFinf(X,t) represents the sum of external influences (Finf(X,t)) with their relative strength (cinf) pertaining to each influence. The so-called behavioral information Finf(X,t) includes cognitive states, emotional states, intentions, motivations, instructions, inter-personal coordination, movement support etc. During motor learning or while applying therapy to a patient these extrinsic influences become extremely important, because the intrinsic (pattern) dynamics can be changed with these extrinsic influences by altering the equation of motion. By modulating the behavioral information, the intrinsic dynamics of the neuronal networks can be influenced further, that is if CDT is no longer efficient in repairing the injured CNS, requiring the therapy to be updated. With respect to a healthy athlete, the movement performance can be improved by modulating the behavioral information by for example including in the training program the exercising on a special CDT device to improve CNS functioning.
2021 Copyright OAT. All rights reserv
If the behavioral information includes the exercising of extremely coordinated, integrative movements, like exercising on the special CDT device, then the quality of CNS self-organization can be enhanced by improving the exactness of self-organization, namely the precision of phase and frequency coordination between neuron and neural assembly firings. By improving the precision of organization of the intrinsic dynamics, that is the specific variability of the injured networks, certain patterns do eventually re-appear in the case of repairing the injured CNS by movement-based learning.
A first novel step in coordination dynamics therapy is the inference derived from the formula 2 of the equation of motion. It suggests that the movement learning not only improves the performance of that particular movement, but also improves the other non-trainable functions by transfer of learning [15]. These functions include vegetative functions like bladder control, speech and higher mental functions.
Furthermore, we have a means by which the stability of physiological network states can be increased (e.g. movements, continence, continuous concentration in performing certain tasks, speech etc.) and simultaneously the stability of pathological network states, like spasticity, decreased. The coordination (pattern) dynamics therapy partly based on the System Theory of Pattern Formation in combination with human neurophysiology thus offers us an important theoretical basis and a practical tool to diagnose, quantify and repair/improve the functioning human nervous system at the macroscopic level.
The need to improving the stability of phase and frequency coordination to allow specific pattern formation and learning transfer
The self-organization of CNS networks by phase and frequency coordination has to be improved to make learning transfer for example from movements to bladder functions possible, since in every CNS injury the phase and frequency coordination is impaired [15,16]. Large instabilities in phase and frequency coordination will not allow specific pattern formation as a basis for learning transfer. However, the stability of phase and frequency coordination can be improved when the patient is exercising on special coordination dynamics therapy devices.
The importance of stable phase and frequency coordination to allow specific pattern formation and in consequence learning transfer to other patterns can be understood at the collective variable level and the neuron level. The behavioural information Finf of the coordination pattern dynamics, characterized by equations of motion of collective variables, dX/dt = Fintr(X) + ∑cinfFinf(X,t), affect the whole coordination pattern dynamics, including stability, rather than only certain coordination patterns. If the behavioural information includes the exercising of extremely coordinated, integrative movements, like exercising on the special CDT device for turning, then the quality of the CNS self-organization can be enhanced by improving the exactness of self-organization, namely the precision of phase and frequency coordination between neuron and neural assembly firings. By improving the precision of organization of the intrinsic dynamics Fintr(X), that is, the specific variability of the injured networks, certain patterns do then already re-appear. Neurons often serve more than one network pattern at the same time by time sharing of neuron firing and, in this way, give rise to learning transfer among the activated patterns. If sub-networks are improved in the organization of one pattern, the organization of the other pattern will also improve. Neurons involved in the organization of breathing and activating intercostal muscles, for example, are also involved in the organization of trunk stability. By reducing spasticity of the trunk (in patients with Parkinson’s disease) breathing will also improve. Similarly, sphincter motoneurons are involved in continence and pelvic floor weight bearing. If the pelvic floor is not trained during pregnancy, incontinence sometimes occurs and continues into the antenatal period.
Quantifying CNS functioning by measuring pattern stability upon pattern change when exercising on the special CDT device
Experimentally, the underlying dynamics of coordinated movements can be found in the temporal stability of coordination patterns and can be assessed through pattern change (second novel step in CDT). A change of the coordinated movement patterns is generated, when a subject is exercising on the special CDT and recording device, where the coordination between arms and legs, imposed by the device, changes continuously between pace (P) and trot gait (K) and backwards. The stability of the intrinsic coordination tendencies is measured by the deviations and differential stability during the performance of these rhythmic movements. When the differential stability of the movement pattern is high, the arrhythmicity of exercising is small and when the stability is low the arrhythmicity of exercising in that pattern is high. In the healthy case the arrhythmicity is low for the pace and trot gait coordination’s and is high for the intermediate coordination’s between pace and trot gate. The pace and trot gait coordination’s between arms and leg movements have a high stability and the intermediate coordination pattern have a low stability.
The mean stability per minute can be measured by the arrhythmia of exercising (df/dt:f, f = frequency; or dν/dt, ν = angular velocity) when exercising on the special CDT device. Such differential stability value per minute, the so-called coordination dynamics value, quantifies CNS functioning objectively, integratively and non-invasively. The practical assessment of quality of CNS organization by pattern change with a special CDT device (Figure 22) is the third novel step in CDT.
Repair strategies at the neuron membrane and genetic level to implement repair also in coma patients
1. Repair depends on learning and memory formation, mediated or supported by epigenetic mechanisms. Epigenetics is the interplay between genes and the environment resulting in phenotype and epigenetic landscape.
2. Epigenetic mechanisms like DNA methylation are probably sensors for movement-based learning and memory formation and fine modulators of neurogenesis in the adult CNS with CDT (Figure 16).
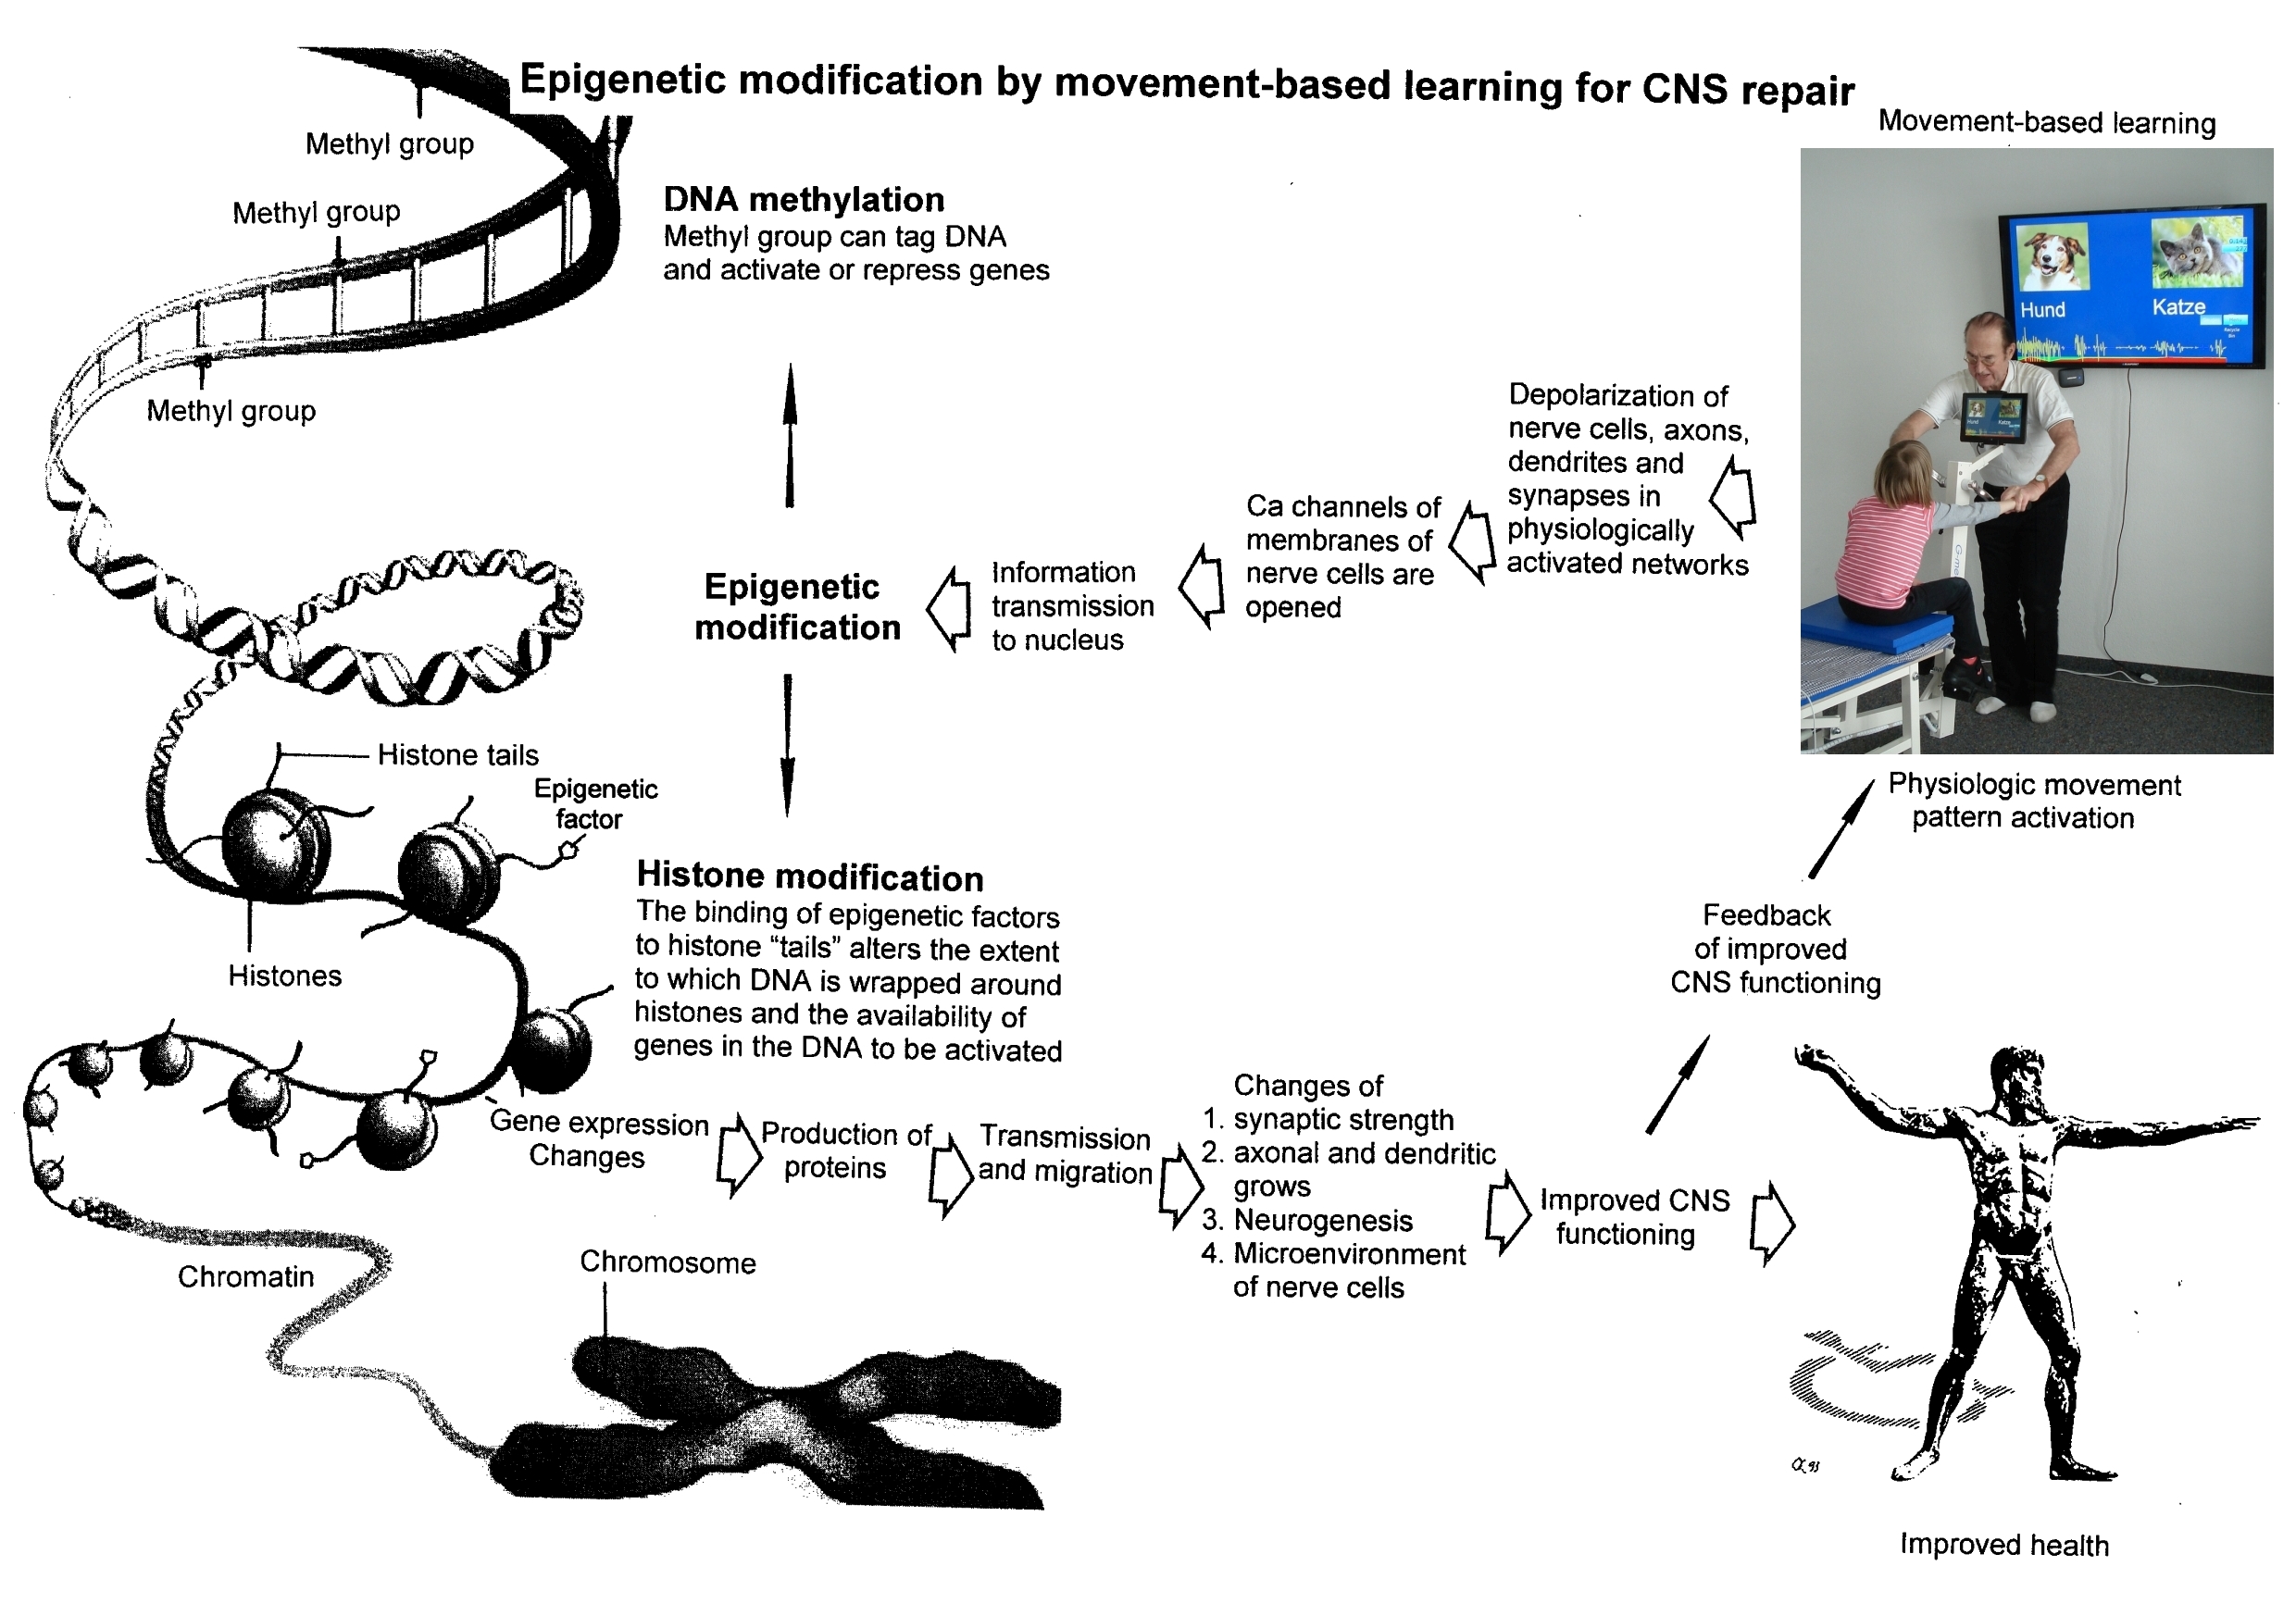
Figure 16. Epigenetic regulation for repair by movement-based learning. CDT-induced stimulation of the pathways that regulate neural network repair is a proven therapeutic and preventive tool. Epigenetic mechanisms, stimulated by physiologic network activation, are likely key players within signaling networks, as DNA methylation, chromatin remodeling and small non-coding RNAs superfamilies’ are required for the fine-tuning and coordination of gene expression during neural network repair by learning. Since the nervous system is involved in nearly all body functions, CDT will improve health.
3. The epigenome consists of non-coding RNA and chromatin, a proteinaceous matrix surrounding DNA. The dynamic interactions of post-translationally modified chromatin proteins, covalently modified cytosines inside DNA and non-coding RNA define the complex pattern of gene expression beyond the four bases of DNA.
4. The hippocampus plays an essential role in learning and memory. In the hippocampus there exists a specialized form of neural plasticity, which is, the generation of new functional neurons from stem cells occurring throughout life. Adult hippocampal neurogenesis contributes to learning and memory formation.
5. New neurons are important for learning and memory formation (besides functional reorganization), i.e. for increasing the rate of repair, for the following reasons [14].
a. The insertion of new neurons helps to store the memory of the same activity that led to the creation of the neuron.
b. Activity-dependent neurogenesis enhances the learning of new memories and degradation and clearance of previously stored unwanted memories like spasticity, because the synapses, dendrites and axons can be devoted more fully to the newer memories. The old neurons with large and complex axon and dendritic trees are difficult to change. They can only be changed with sustained effort.
c. New neurons seem to improve the accuracy of relearned patterns (from model study) [29]. This means that new neurons help to improve phase and frequency coordination of neuron firing and pattern stability.
d. The advantage of new neurons seems to be dramatically greater in networks that had been more active and had been required to store more memories [29]. The advantage of neurogenesis for memory storage in heavily active networks is that it provides an increased rate of repair if movement-based learning is administered aggressively and if different movements are trained.
6. Specific natural network activity is required for multiple aspects of repair.
Specific activity is essential for correct migration of interneurons and it also controls the development and repair of their axons and dendrites. During repair there is a specific requirement of network activity in shaping the cortical integration of specific neuronal subtypes. Newly build neurons are likely electrically active shortly after their birth and participate in the early network activity that contribute to circuit maturation during repair by CDT.
7. Specific activity is required for migration and maturation at several stages of repair. A break in CDT may invalidate the whole chain of repair events.
Specific interneuron subtypes require activity for migration and morphological maturation at two distinct stages of development [29]. Newly built neurons may even require specific activity for migration and maturation at several distinct stages of repair. During a break in CDT, the specific activity, required for neuron migration, maturation and network integration may not be supplied at one of these stages so that the chain of repair events is severed and the whole repair chain has to be started anew.
8. For optimal repair, specific downstream and upstream activity is needed.
Since coma patients cannot move by themselves, only the specific movement induced afferent input is available for repair. But since the movement induced afferent input during support by a therapist improved motor programs, it is likely that the specific activity induced by the movement induced afferent input can to a certain extent also offer the specific activation necessary for proliferation and migration of neurons and network maturation. Further, some automatisms like the blink or swallowing reflex are partly working and activate motor patterns.
9. Drug application may undermine repair.
Altering the level of neuronal excitability within genetically targeted neurons from drug application, for example antiepileptic drugs may have profound consequences on multiple aspects of the repair of select types of neurons within a population of neurons, as well as their associated gene expression. The pain-killer ‘Contergan’, taken during pregnancy, changed gene expression and the babies were born without arms.
10. Excitation-neurogenesis coupling [29]
a. Excitation increases or decreases neuron production directly by excitation-neurogenesis coupling.
b. The excitation acts indirectly on the surrounding mature (hippocampal) cells through depolarization-induced release of growth factors.
c. Adult neurogenesis is enhanced by excitatory stimuli and involves Ca2+ channels and NMDA receptors.
d. The Ca2+ influx pathways are located on the proliferating stem/progenitor cells (NPCs), allowing them to directly sense and process excitatory stimuli. The Ca2+ signal in NPCs leads to rapid induction of a proneural gene expression pattern.
11. Integrative coordinated movements have to be trained to allow functional reorganization and new nerve cell integration across very large distances. CDT has to activate injured and uninjured networks to enhance physiologic CNS functioning and learning transfer.
12. Conclusion for optimal therapy according to the present stage of knowledge.
If there is similarity between development and repair, animal (mice) data also hold in humans and the principles of neurogenesis of the hippocampus also hold in other parts of the brain, albeit to a much lesser extent, then the patient has to be trained at his limits to induce substantial building of new nerve cells [1-14]. The treatment has to be continuously administered (2) to support all stages of repair at the progenitor level as migration, maturation and integration. The networks requiring repair have to be activated specifically (3) to generate repair-friendly, micro-environmental properties in the networks. No drugs should be administered that change neuron excitability (4). The exercises have to include coordinated arm, leg and trunk movements (if possible) to improve the impaired phase and frequency coordination for CNS self-organization [5-28]. The performed movements have to be as integrative as possible to reconnect distant brain parts and to induce learning transfer [15].
This very short introduction to the theory of coordination dynamics therapy may help to understand the substantial progress achieved in neural repair in the five following case reports.
Results
Case report 1. Spinal cord injury (Nefeli)
The five-year-old Nefeli became cancer. When the cancer was removed she suffered a spinal cord injury at the levels Th10/11 by medical malpractice. Being in the wheelchair, eight months of conventional physiotherapy were administered to her with little progress. She had difficulties to manage at school (Figure 17A) (Figure 17B). Later on, Nefeli refused further conventional physiotherapy, mainly because no further progress was achieved.
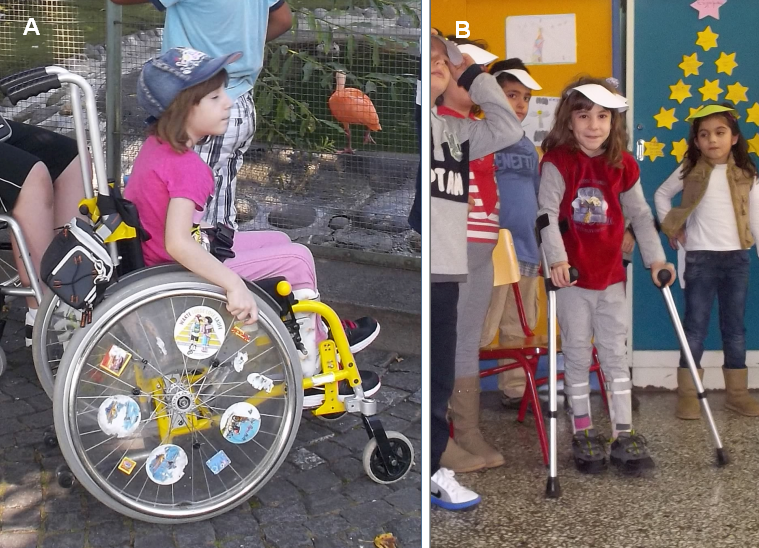
Figure 17. The six-year-old patient Nefeli with a spinal cord injury at the levels Th10/11 in the wheel chair (A) and with orthoses and sticks at school (B) after obtaining conventional physiotherapy.
In spinal cord injury, in the first 6 to 12 months the injured CNS mainly repairs itself, which is often ‘sold’ as successful rehabilitation. One year after the accident further repair can only be achieved with an efficient repair treatment.
At an age of nine the spinal cord injury patient started coordination dynamics therapy (CDT). Within two years of CDT, Nefeli learned to walk and her urinary bladder [15, 16] and bowel functions were partly repaired. She could manage now much better at school. She could also walk to the white-board and write there (Figure 18).
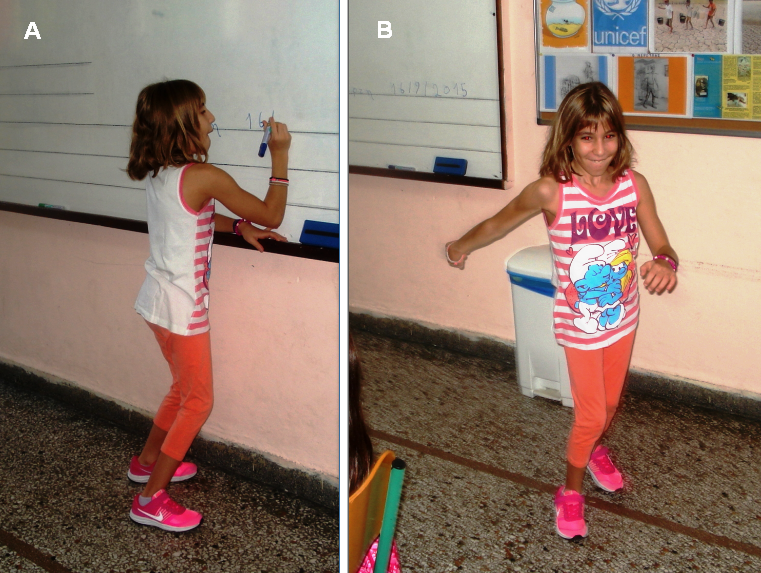
Figure 18. The now 11-year-old patient Nefeli with a spinal cord injury at the levels Th10/11 partly re-learned to walk and is able to go to the white-board at school and write. Note, at the whiteboard, she still had support herself a bit for writing (A).
CDT included the exercising on the special CDT device (Figure 15), jumping on springboard, creeping, crawling, walking, running and stretching (Figure 19). Urinary bladder repair is substantially achieved by exercising on the special CDT device and jumping on springboard.
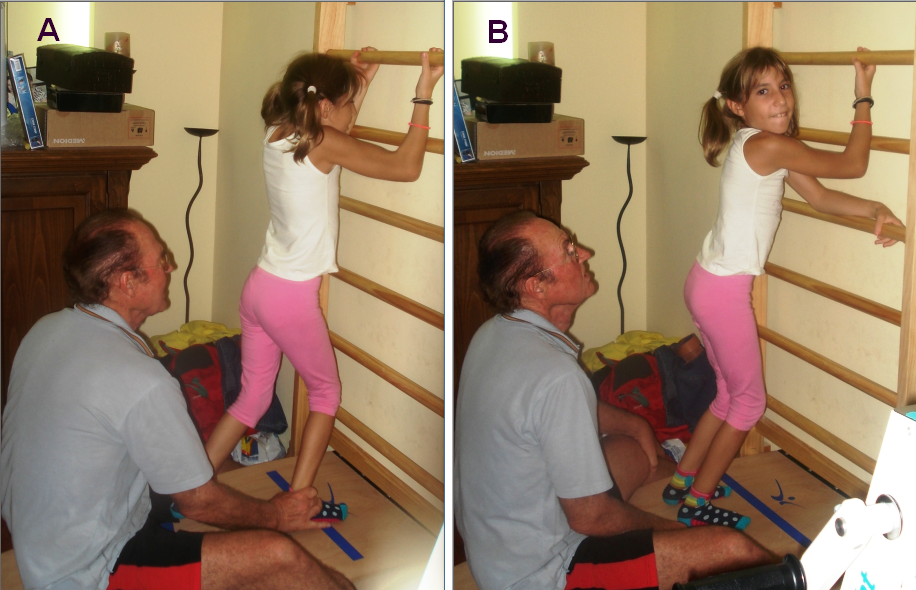
Figure 19. Ten-year-old patient with an incomplete spinal cord injury during jumping on springboard, supported by the Author (A). Note that during a rest between the jumping series (B) the patient is standing in a too much flexed position caused by the spinal cord injury.
In the now 12-years old Nefeli still the walking and the urinary bladder functioning have to be improved. Also, the scoliosis [18] has to be improved and can be improved by exercising rotational trunk movements on the special CDT device. Nefeli can partly control the bladder, but the filling volume has to be increased from around 80ml to 200ml. Also, the time from the first wish to void to the urgency to void has to be increased. Now the time is with approximately 20min too short. Diapers she is wearing only sometimes. No bowel pain occurs any more. But the ‘wind’ is not fully under control. The running and jumping, which the spinal cord injury girl Nefeli likes very much, has to be further improved.
Case report 2. Cerebral palsy (Sophie)
Sophie had from birth an atrophy of the cerebellum and ponds. At an age of 5.5 CDT was started. At the beginning Sophie could not perform any movement accurately. She was incontinent, and her speech was poor. The Author could not understand her. She could crawl on the floor in trot gait coordination with poor performance. Pace gait crawling was not possible.
Sophie could not jump because she did not have that pattern learned and stored in her CNS and jumping is no automatism. She learned to jump and hated it first. At the beginning, she could jump a little by herself on a trampoline. The jumping on springboard was harder to learn. The supported jumping was a big load for the parents, because Sophie contributed only little. Slowly she contributed more and more and at the end she could jump by herself on springboard but with poor performance. When she had learned the jumping she liked it.
Of course, Sophie could not walk. When the mother tried to walk with her, she was more hanging in her hand than walking (Figure 20). There was no real walking pattern and no balance. She could not really learn it, because she had no protection automatism when falling, which is probably normally stored in the cerebellum. If she would fall, she would injure herself and that is what the parents were very afraid of.
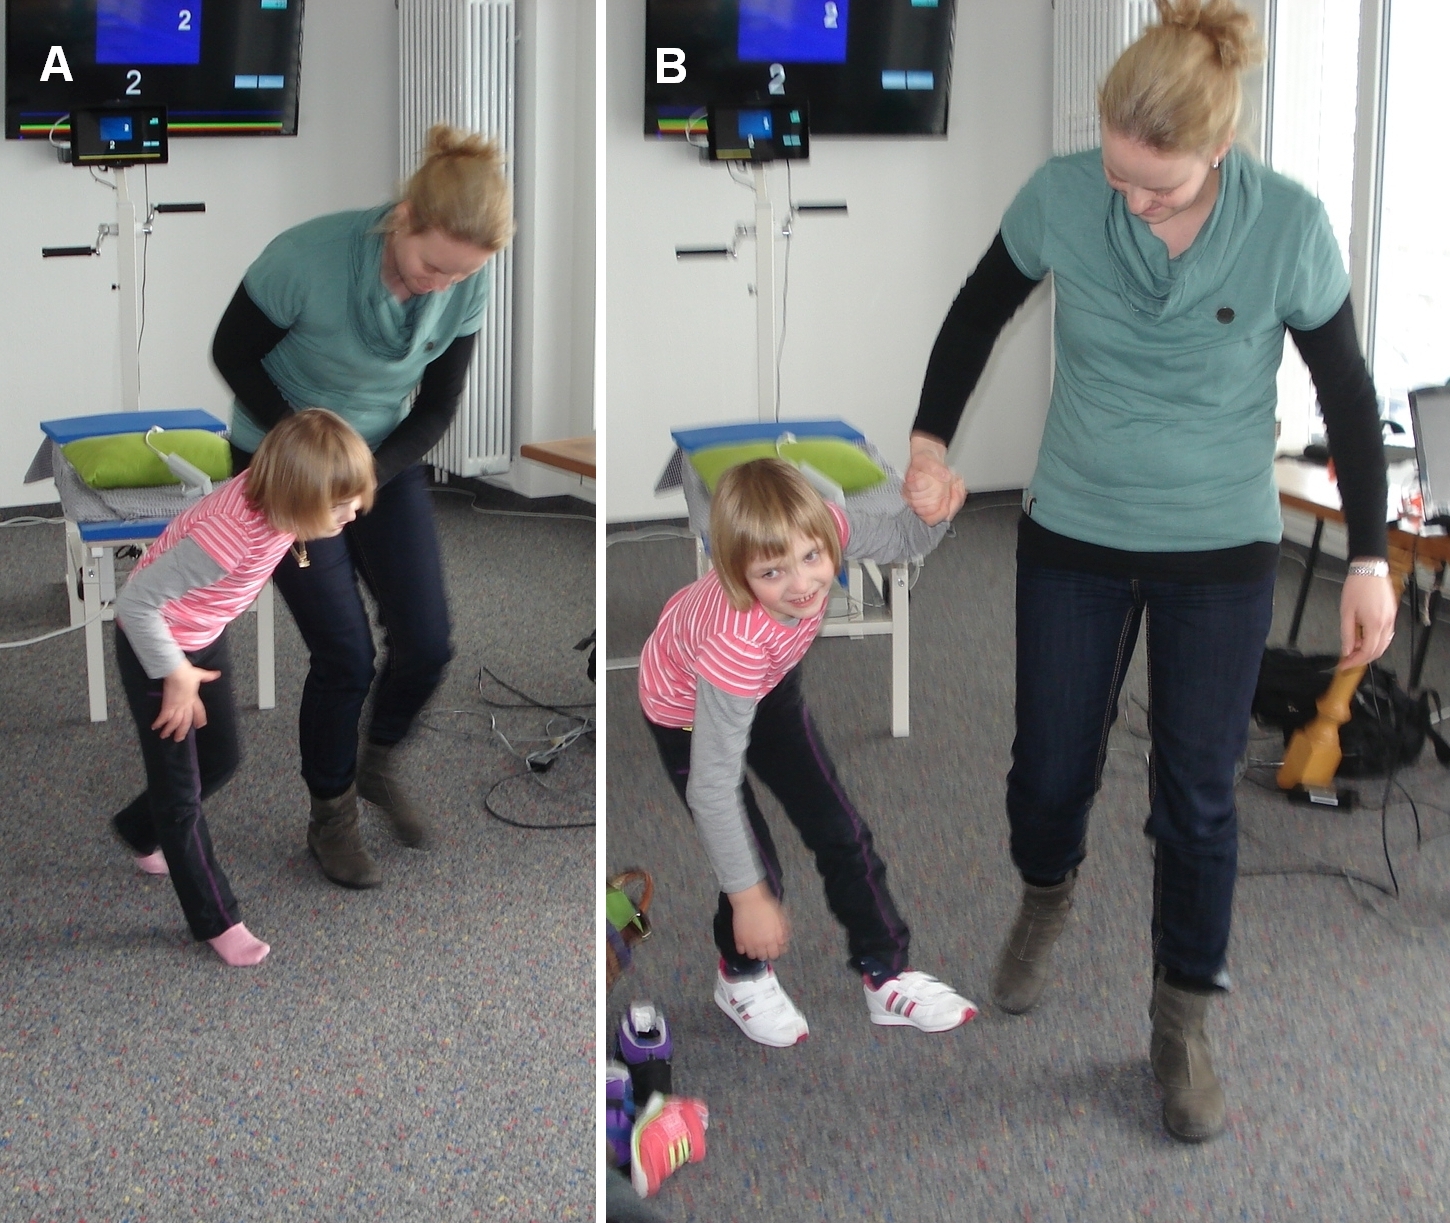
Figure 20. The cerebral palsy girl Sophie when trying to walk with her mother before CDT was started. She could not generate a walking pattern. Knees were overstretching (A) which blocks the walking pattern and she was immediately falling (B).
The first fundamental progress in repair was achieved when the protection automatisms appeared in Sophie at an age of 6.5 years. The parents were not so much afraid anymore when trying to make her walking and Sophie tried now to walk by herself. The protection automatisms became operationally at a time when she became able to exercise by herself on the special CDT device (Figure 15).
When the protection automatism occurred, the learning of walking became much easier and less risky. Sophie was not afraid to fall anymore and tried herself to walk without falling and she liked it. At an age of 8 she was able to walk without falling (Figure 21). Sophie’s trot gait crawling improved. The pace gait crawling became possible with poor performance.
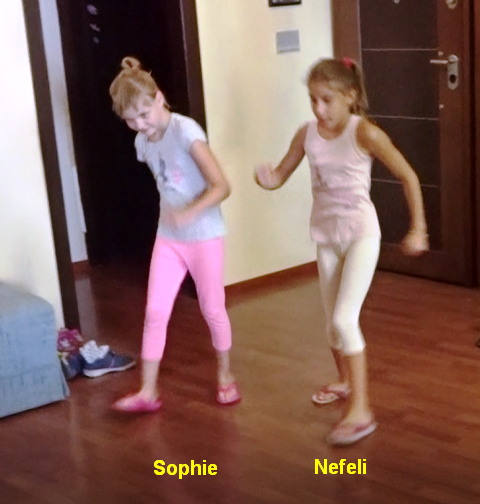
Figure 21. Sophie (left) during walking with sandals to train forefoot functions. When Sophie and Nefeli were training sometimes together, they motivated each other to fight more. They (and their parents) started to know each other in a rehabilitation center. Note, Sophie and Nefeli are walking in interpersonal coordination.
At an age of 9, Sophie could crawl, walk, jump and play a bit with the ball. She was fully continent. Her speech had improved, so that the Author started to understand her. She had still problems with the balance, but she managed now without falling. Her writing got better. Altogether, her higher mental functions improved. But she is not able to run so far. To generate the high frequency seems to be the main problem. Probably she will learn it with ongoing therapy.
Case report 3. Severe brain injury (Sotiris)
A 23-year-old male engineering student suffered a severe brain injury in a car accident. He did not lose bladder continence. He needed to use a wheelchair and his higher mental functions including speech were impaired. The patient attended a rehabilitation center for eight months and was able to dispense with the wheelchair. Mainstream medicine had given up on him. The family found Coordination Dynamics Therapy (CDT) on the internet and started it one year after the accident. At the beginning, he trained at least 20 hours per week and he later trained at the limit with 30 hours per week. When the Author’s involvement was increased and the patient’s sister, also an engineering student, started treating her brother, optimal CDT was started. The injury was balanced in that the brain injuries were evenly distributed. He could perform most movements to a small extent. The most significant obstacle to the resumption of a meaningful life seemed to be the impairment of the higher mental functions. The quality of the higher mental functions of this cooperative patient fluctuated. Motor functions and speech improved after three years of therapy. The ultimate goal of continuing his studies in engineering was achieved after 6 years of aggressive CDT in 2015. With the help of the sister and the university he was able to finish his study in 2018. The patient has still problems with the higher mental functions and the speech, but he easily drives a car. The sister said, he is driving the car in the same way as before the accident. When the Author was with him in the car, he could not complain about his driving. Car driving seems to be an old-learned pattern.
Repair rate quantified by high-load CD value measurements
Learning can be quantified by the change of coordination dynamics [29]. The great improvement of CNS functioning (lowering of the values) in the patient Sotiris while performing CDT can nicely be seen by plotting the high-load CD values (Figure 22). The values decreased from 449 to approximately 60, that means by a factor of 7. The self-organization of CNS functioning improved substantially. It can also be seen from Figure 20 that the improvement of the forward-backward symmetry of exercising took 40 months. The healthy pupil learned this forward-backward symmetry in half a month [2]. The rate of learning for this forward-backward symmetry was reduced by a factor of 80 in this patient. In stroke patients, the repair of the right-left symmetry is an even greater problem.
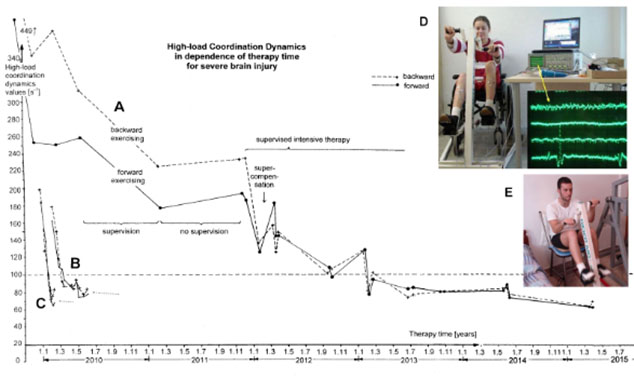
Figure 22. A. Improvement of high-load coordination dynamics (CD) values in the patient Manolis (E) with severe brain injury upon coordination dynamics therapy for several years. The high-load CD values were obtained by summing up the single CD values for forward and backward exercising, D (high-load CD value) = D20N + D50N + 100N + D150N + 200N + D150N + D100N + D100N + D50N + D20N + D20N). B, C. For comparison the improvement curves of the high-load coordination dynamics values of an athlete (C) and a healthy pupil (B) are inserted. Note that the brain-injured patient needed much more time to achieve similar good CD values. D. Measuring coordination dynamics values in the sitting position on the special CDT device and performing surface electromyography at the same time (from another patient with a spinal cord injury). E. The position of exercising of Sotiris for measuring CD values.
From Figure 22A, it can further be seen that supervised intensive therapy was more efficient for repair than training without supervision.
Figure 22 also shows that the overall CNS repair needed longer than three years. The insets B and C of Figure 22 show the repair curves of a normal pupil (B) and an athlete pupil (C) adapted to the time scale. It is obvious that the healthy pupils learned faster. The CD value curves reduced quickly to the plateau, indicated by a dotted line. The overall performances of the movements were also better. The CD values for forward and backward exercising started from around 390 to 450 in the patient and those from the pupils from 160 to 200.
When the patient continued the study, he had to reduce the training times from 30 to 10 hours per week. His coordination dynamics values got worse (higher). After finishing the study, he increased the training times up to 30 hours again and got much better again (under 50).
Case report 4. Severe traumatic brain injury (Benjamin)
It has been reported earlier about the outcome of Benjamin who suffered a severe traumatic brain injury in a car accident at an age of 9 [2, 3]. His improvement is picked up again, because it is of interest to find out what is the long-term outcome in children with severe brain injury if CDT is administered to them over many years. Can they achieve a meaningful life?
Benjamin was running whilst playing in the street and was hit by a car driven at 55 km/h. He was thrown several meters through the air. The collided with an iron fence and suffered many injuries, including an open thorax injury on the right side and brain damage of the basal ganglia domain (probably the main cause of impairment of neuronal network functioning, damaged area = 4 cm x 3 cm) and the frontal lobe. The patient was in a coma for two weeks and subsequently showed some response to stimuli. The intensive care unit medical team forecasted that he would be in vigilant coma for a further one to two months. After ten days of vigilant coma (» 4 weeks after the accident) CDT was started in the recumbent position. Treadmill walking supported by four persons seemed to frighten the patient (Figure 23B). The patient seemed to have left sided hemiparesis; the left arm and the left hand seemed to show signs of spasticity. Due to a humerus fracture, the shoulder joint could only be moved a little. Even though the movements in the left arm and left hand seemed to be painful for the patient, he was cooperative. Because he could not speak, meaningful communication was not possible. When the Author left the patient after three days of therapy, he was stroked by the patient, which may mean that he was thankful for the therapy, even though the therapy caused him much pain. The CDT was continued by a physiotherapist and the mother, herself a physician. After a further three days, speech returned and the vigilant coma phase ended. The patient said that then he had quite a lot of pain in the left arm and hand during the movements. But because he felt that the therapists and the mother wanted to help him, he helped actively during the arm and hand movements as much as possible, in spite of the pain and being frightened. The recognition of the reality of the trauma was still difficult for the patient. Often, he said to his mother: “Mum, please wake me up, this dream is so terrible”. Depressive thoughts were opposed with an intensive therapy (which was anyway part of the neuro-therapy he was receiving), not to give the patient time to think his situation over. Further, training using the special CDT device seemed to have a positive effect on his mood. It became apparent when Benjamin emerged from the vigilant coma, that he was indeed hemiparetic on the left (with a slight quadruparesis), including spasticity in the left arm, hand and fingers and in the left sternocleidomastoids’ muscle, which pulled his head to the left side (Figure 23B). Even 17 years later this spasticity appeared in a stress situation as during 100m sprint competition in 2016 (Figure 23A). The organization of the CNS improved continuously with the on-going intensive therapy, which was performed six times per week, several times per day. On the advice of the Author, the parents refrained from botulin therapy to selectively reduce spasticity (by a blockade of the neuromuscular endplates in the domain of the application of the toxin for approximately three months), which was suggested by a neurologist. With the early begin of an efficient intensive CDT the development of false organization of the CNS (spasticity) can be strongly reduced or abolished; there was therefore no indication for a botulin therapy.
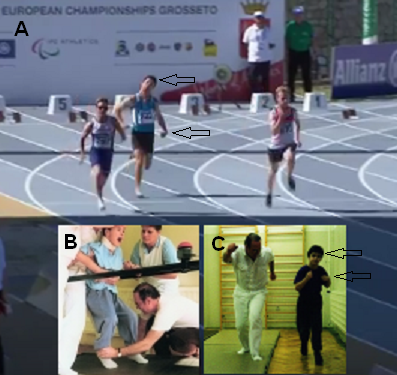
Figure 23. A. European Championships in Grosseto 2016. The patient Benjamin, who suffered a severe brain injury 17 years ago, shows neck and hand spasticity (marked with arrows) during the sprint. B. 17 years ago the Author started with Benjamin in the final phase of coma the walking on treadmill. C. A bit later the Author was training with Benjamin the walking in interpersonal coordination. Some neck and hand spasticity can already be seen then (marked with arrows). Note that the other sprinters in ‘A’ show no obvious spasticity. The sprinter on the left side of Benjamin Erban (Evgenii Torsunov, Russia), who won the Gold medal with 12.27s (A), no spasticity or pathologic movement can be seen. Besides the problem of doping in sport for disabled there is also the problem of classifying the disability. By putting a disabled athlete into the wrong group, he can easily win the gold medal or never get a medal at all. The classification of the disability has to be fairer.
After six months of CDT (seven months following CNS injury), the paretic arm further improved, the overstretching of the left knee reduced and the patient re-learned walking (Figure 23C) and running (Figure 23A). It seemed that an essential step forward was achieved in the last three months of therapy, when the patient used the special CDT device in the standing position. At the beginning the patient had great difficulty in keeping his left hand on the lever. Six weeks later, the function of the left hand improved. Several months earlier the patient also had great difficulty in holding the lever of the sky-walker.
After six months of CDT the patient no longer needed support when jumping in anti-phase on the springboard, the left knee was no longer overstretched, the positioning of the left arm, hand, head (reduced spasticity of the sternocleidomastoids’ muscle) and trunk were better - hemiparesis had partly subsided. With the improvement of the motor functions, cognitive functions also improved. His short-term memory became better. The short-term memory was still not normal because he often forgot what sentences he should translate, when translating two to three sentences from English to Slovak. He enjoyed attending school for a few hours per day. The improvement of the mental functions corresponded with the healthy-looking face, as judged by the parents and the Author.
One year after the accident, the now 10-year-old Benjamin obtained a further six months of optimal CDT at home. The functions in the left arm and left hand improved further. He could walk and run better after the further treatment. With the left ‘bad’ hand he could turn over pages of a journal. Benjamin was back to his old school in his old class and was managing well. The strategy to first give priority to the re-learning of the motor functions before going back to school and giving in this way priority to the re-learning of the basic structures of the CNS with the attendant improvement in short-term memory was right in this case. With the improvement of the motor functions also the higher mental functions improved, so that he could better manage at school.
At home Benjamin further improved, although only a little. He was not able to crawl because of the spasticity of his left hand and arm. When the measuring of low-load coordination dynamics (CD) values was introduced, it became possible to follow the evolution of his CNS functions. With the introduction of high-load exercising on the special CDT device to activate the CNS more integratively (systemically), Benjamin improved further and became able to crawl. Six years after the accident, his motor functions did not improve any further.
The question arose whether CDT had come to its limits in respect of the potential improvement of CNS functioning by learning, or whether the learning therapy had to be updated and performed more intensively. The top-fit Benjamin came to the Author and obtained for one-month optimal professional Therapy. The efficiency difference in respect of CNS repair, as quantified by low-load (390) and high-load coordination dynamics values (89), between home and professional therapy differed approximately by a factor of 100. Not only did CD values improve strongly during professional therapy, but walking also got much better. While walking, Benjamin used the left leg much more actively instead of lifting the hip and swinging the leg. A treatment goal could be approached: at first glance you could not see that the patient had suffered a severe brain injury. There seems to be therefore no limit of CNS repair, if CDT is applied continuously over many years at the limit and is supervised by the Author who can upgrade the therapy if needed. See also case report 5 of the coma patient.
Stage of repair 17 years after the CNS injury
In the last few years Benjamin (with a partly repaired severe brain injury) increased the training to try to win a medal in a European championship or Olympic Games. In 2016 he was able to win a bronze medal in 100m sprint. He was running the 100m in 14.01s (Figure 23A). The times for gold and silver were 12.27 and 12.34s.
During the sprint, when he had of course stress, the sternocleidomastoid muscle got spastic and his head turned to the left. Also, the left hand and arm got more spastic (Figure 23A). In spite of these pathologic neural network organizations, he was able to run 100m in 14.01s. This is quite a success if we remember that 17 years ago, he started walking and running nearly out of nothing (Figure 23B, C). Therefore, Benjamin was really fighting to overcome his brain injury.
Now being 29 years old, he succeeded to finish university with a Master’s Degree in English-German Translation Studies. But when he is translating simultaneously from English to Slovak (mother tong) simultaneously, he may get concentration problems after some time. His nervous system is still not fully repaired. Benjamin is very good in languages. He inherited it from his father, who was able to translate simultaneously between six languages. Severe brain injury seems not to destroy specific talents.
Disappointing for Benjamin during this 17 years of CDT is, that during childhood no aggressive CDT was administered to him. The repair you miss during development, you cannot catch up when you are grown up and have a tremendous motivation to go over limits.
Case report 5. Recovery from the permanent coma (Manolis)
Optimal CDT in a coma patient
The 22-year-old male patient Manolis suffered a very severe brain injury in a car accident. A metal shard went through his skull into the brain. Parts of the brain were removed and a shunt was installed to control brain pressure. An attempt to reconstruct the skull was unsuccessful. After several operations in a university hospital he was placed in a rehabilitation center and provided with twenty minutes physiotherapy per day. His relatives felt that this was insufficient and paid for an additional hour of therapy per day. This was still insufficient to even maintain his level of CNS functioning. Prior to the three months of conventional therapy in a rehabilitation center the patient was able to respond ‘yes’ and ‘no’ by closing and opening his eyes respectively. After this conventional therapy he was no longer able to respond with yes or no. The ability to communicate with the patient was lost. The injury had become worse.
After the three months of the doubtful rehabilitation the patient was taken home and CDT was commenced one year after the accident. There was always the fear that if the treatment is not sufficient efficient the patient may die.
Prince Friso of the Dutch royal family suffered a hypoxic brain injury and died in 2013 after being in a coma for eighteen months.
Visible anatomical damage due to the car accident
MRI (magnetic resonance imaging) was performed one year after the accident at the same time when CDT was started (Figure 24). It showed that many parts of the brain were injured. (1) Figure 24A,B,C seems to show a hydrocephalus, but the ventricle enlargements were secondary to the loss of nervous tissue. The first, second and third ventricles were enlarged in the coma patient. The fourth ventricle was normal. (2) The corpus callosum was very thin indicating impaired communication between the two hemispheres. (3) The frontal lobe was injured on both sides (Figure 24C). (4) The left thalamus was slightly injured. (5) The frontal and parietal lobe showed atrophy. (6) There was great loss of parenchyma of the right hemisphere where the metal shard had entered. (7) Valerian degeneration of the pyramidal tract took place probably due to the injury of the sensory-motor cortex. (8) The cervical spinal cord seemed to be undamaged. (9) No sign of acute ischemia can be seen in the patient’s brain. (10) The valve artifact from the shunt can partly be seen in Figure 24C and D. The radiologist stated that there may have been no brain part left undamaged.
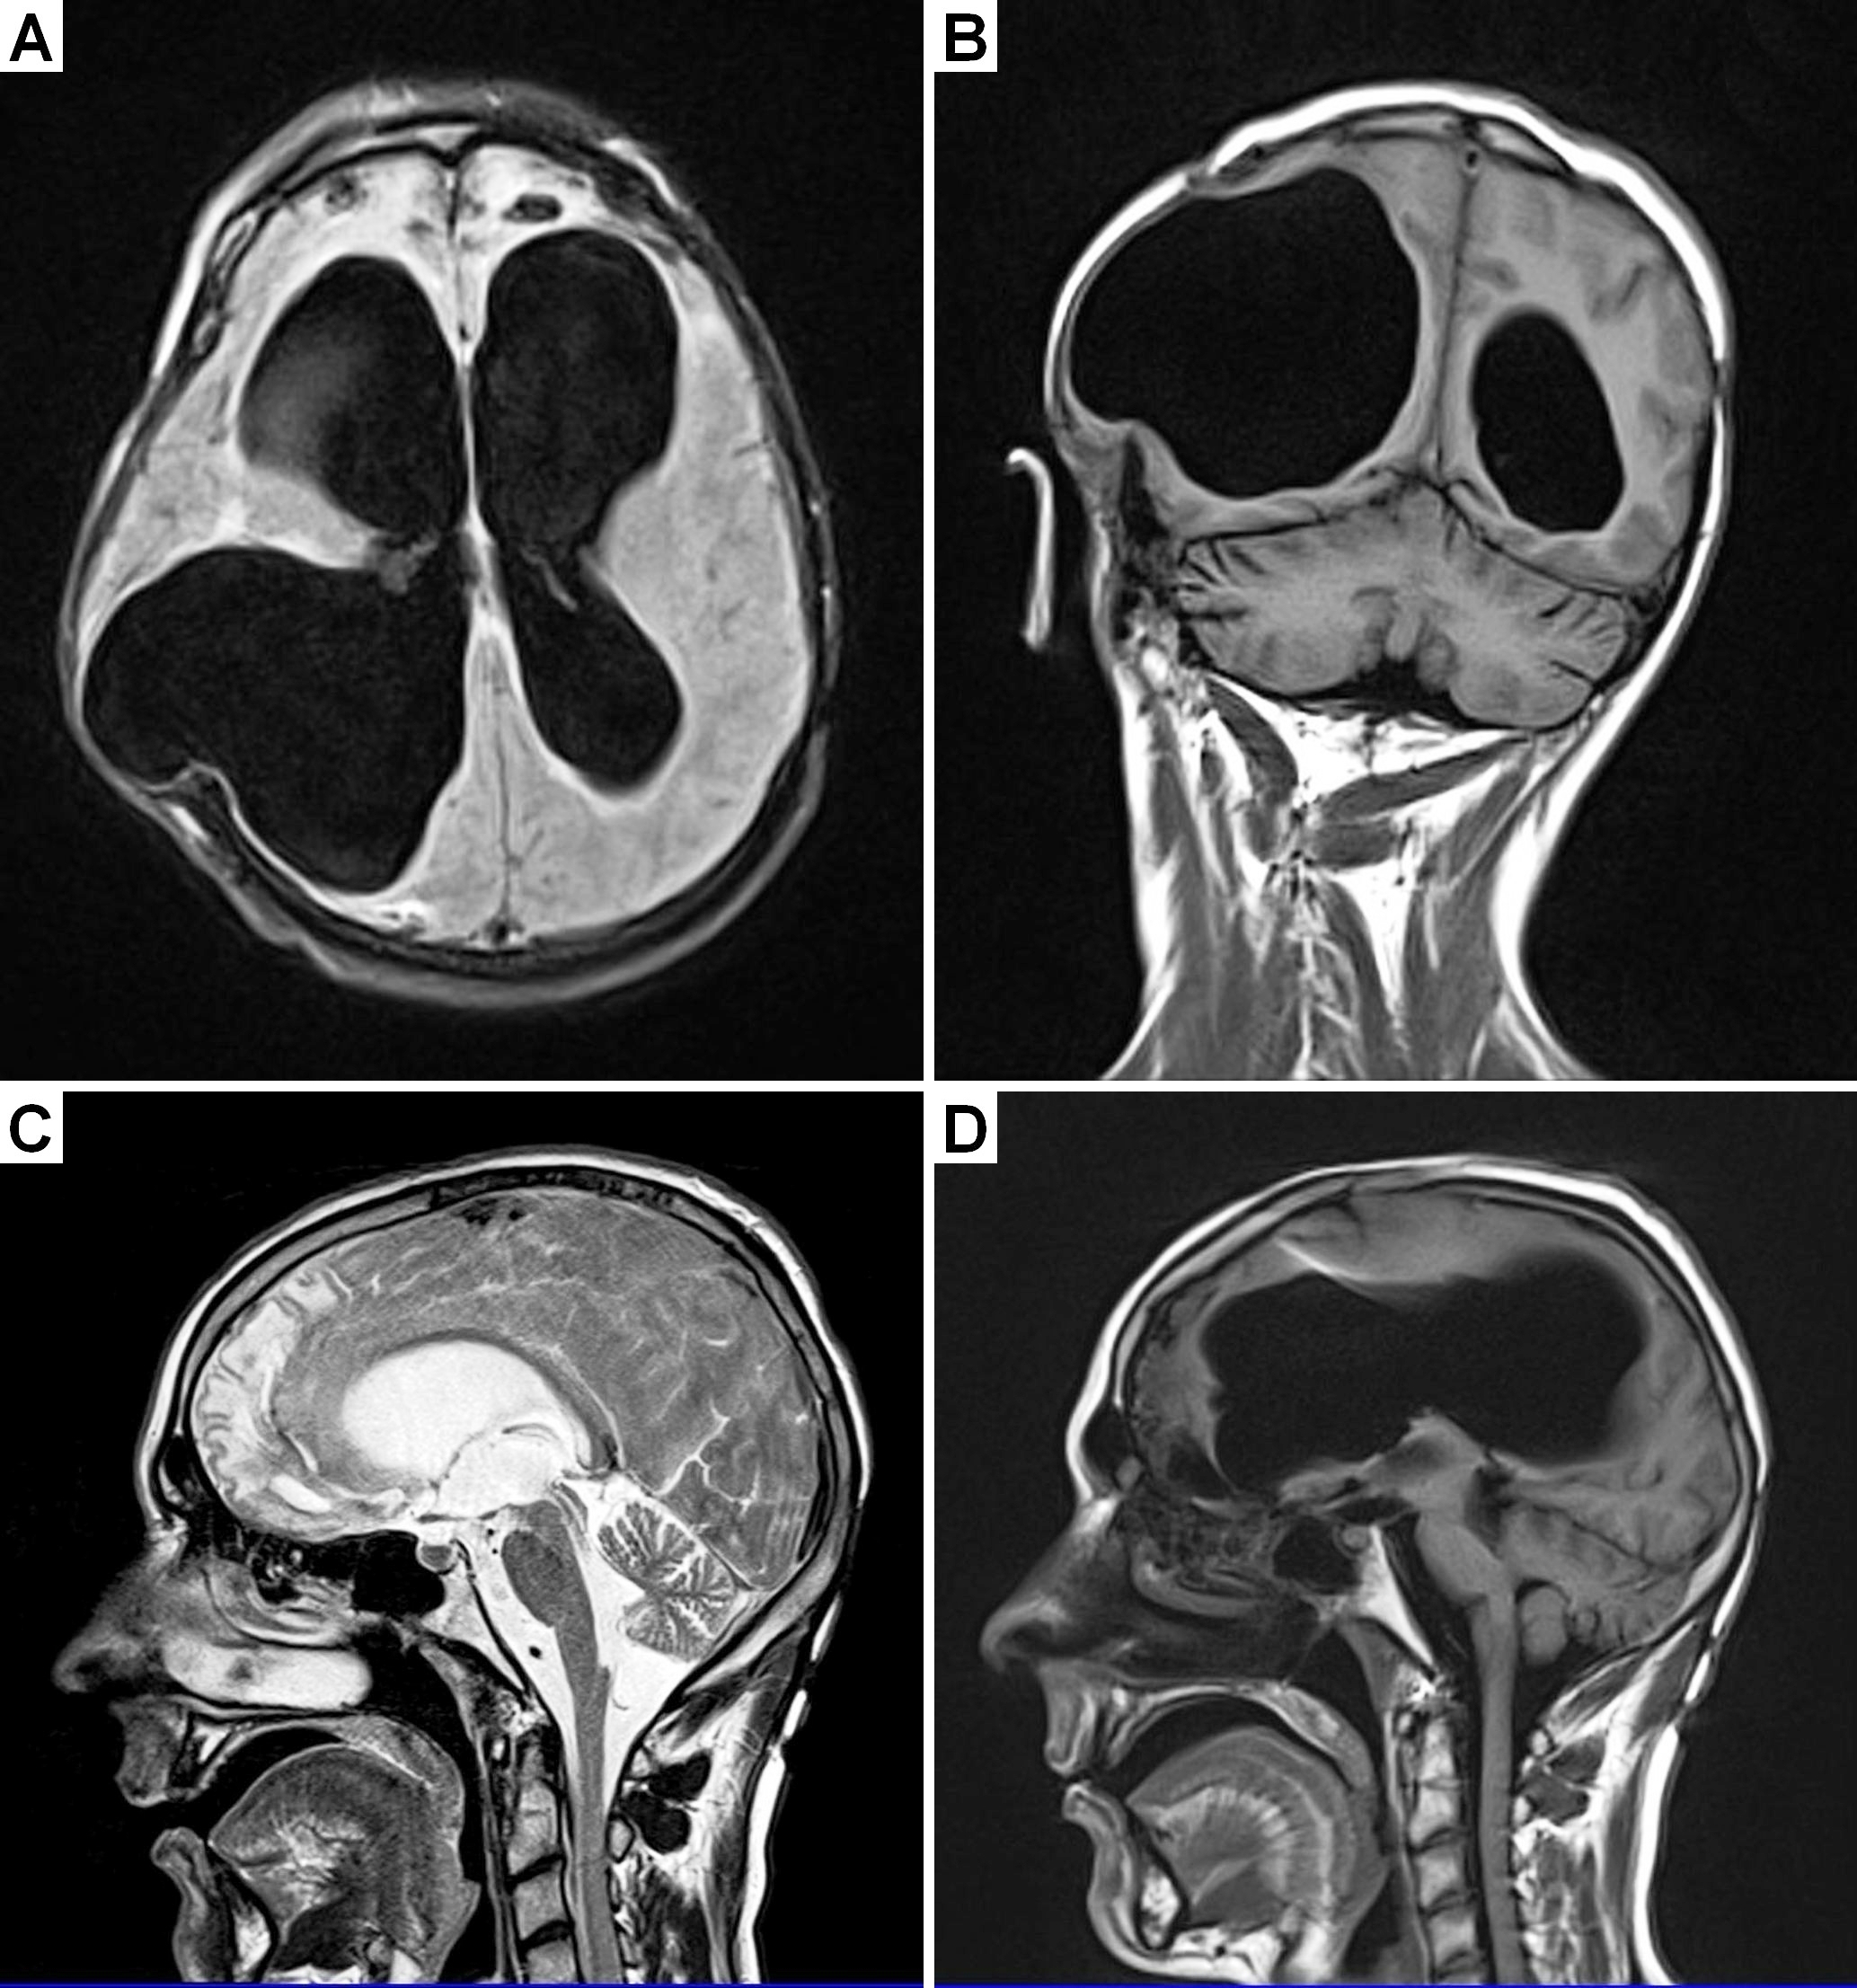
Figure 24. MRI of a 22-year-old male patient with a very severe traumatic brain injury. The pictures were taken one year after the car accident. Since a metal shard went into the brain during the accident, some brain tissue had to be removed. A shunt was installed to regulate brain pressure. Because of the loss of nervous tissue, the ventricles became enlarged; they look like in cases of hydrocephalus. Many parts of the brain were damaged during the accident. Both frontal lobes were damaged (A, C). The artifact from the shunt can be seen in ‘C’.
CDT of the coma patient
In the 22-year-old patient Manolis, who lost approximately 50% of the brain tissue in a car accident, first the vegetative functions improved when CDT was administered and then three years after the accident, including two years of CDT, the patient showed some signs of slowly changing from the vegetative state to the minimally conscious state [26] (Figure 25). After 4 years of CDT with up to 20 hours therapy per week the patient had clearly changed from the vegetative state to the minimally conscious state 5 years after the accident. On command of the mother he lifted the head and kissed her (Figure 27C). On command he smiled. He could follow with the right hand the mother’s hand or eat a potato if it was put into his mouth. The patient became able to perform some limited volitional movements on command. The minimally conscious state is defined by the presence of inconsistent but reproducible goal-directed behaviors and this was the case in the now 27-year-old patient.
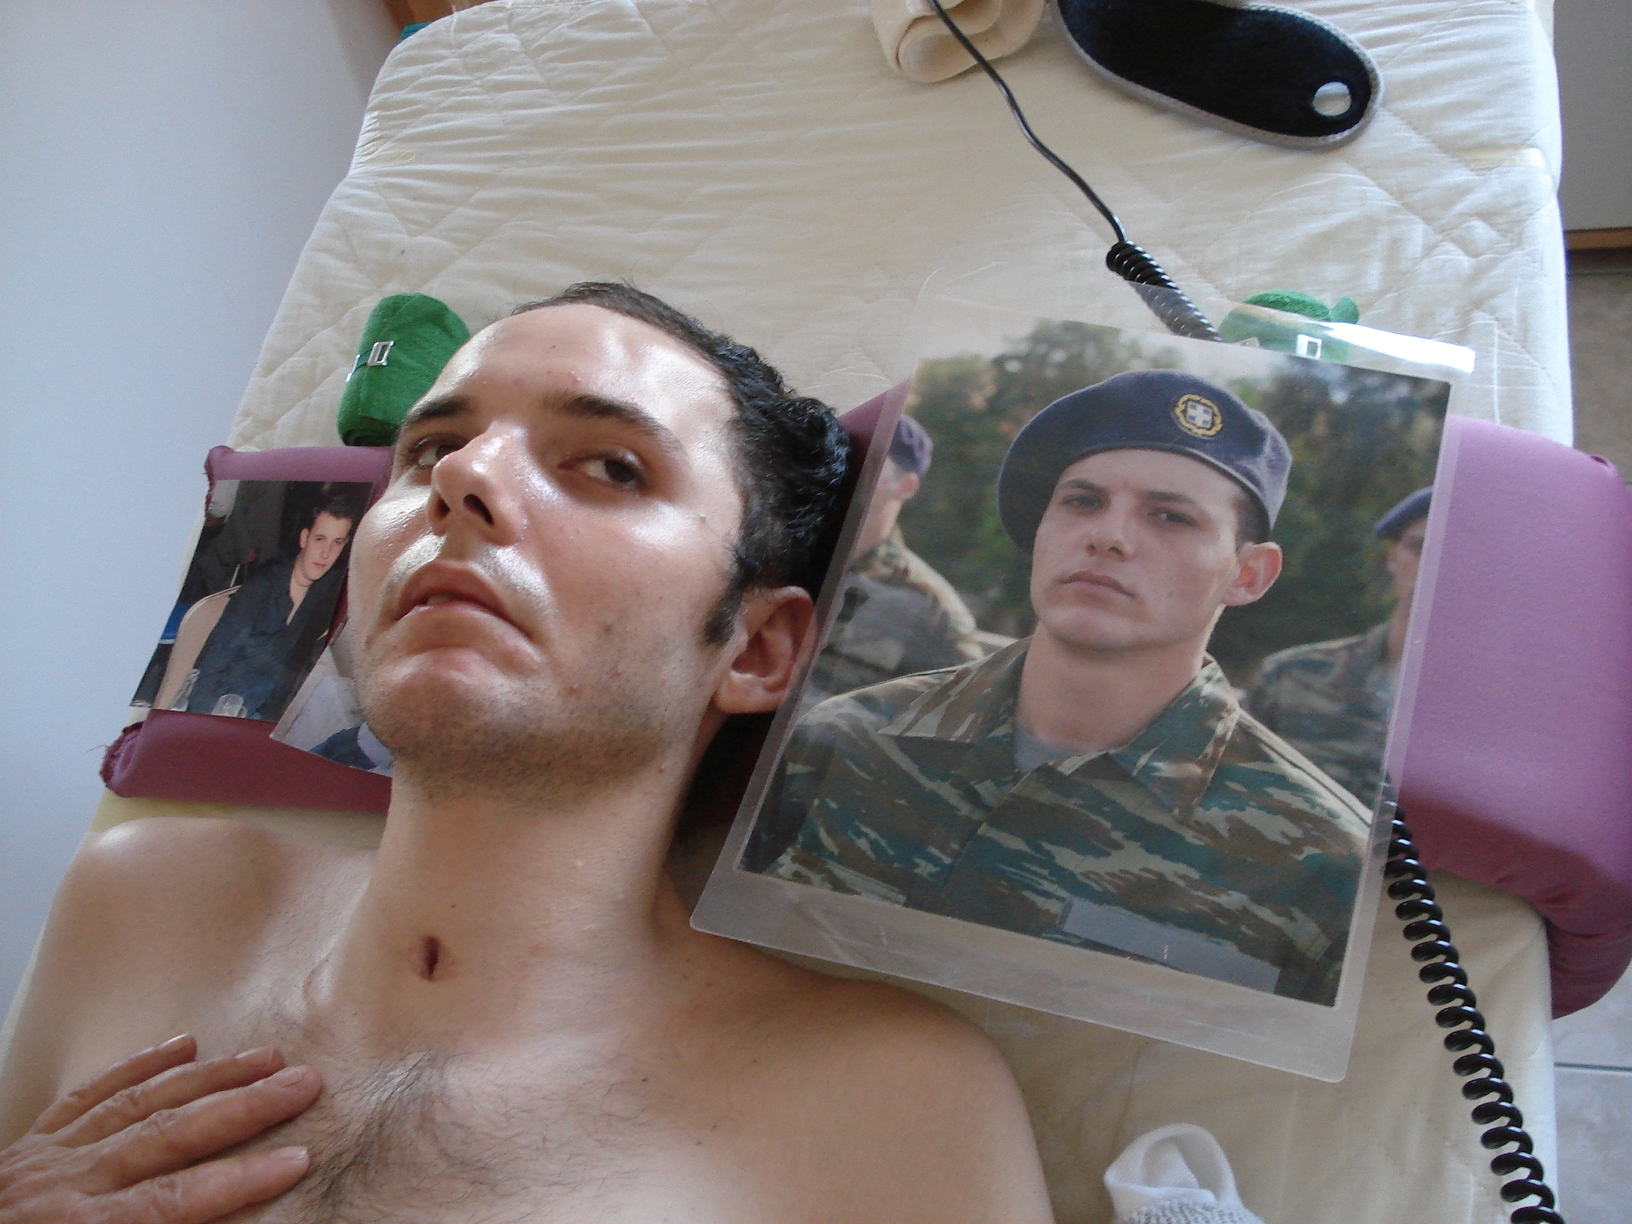
Figure 25. Movements performed with a 23-year-old male patient in the vigilant coma. All movements were passively performed, because the patient was in coma. A,B. Exercising on the special CDT device in the recumbent (both hands are fixed) and sitting position. C,D,E. Exercising on the Sky-walker. Note that the trunk and head control improved from ‘C’ to ‘E’; in ‘E’ no support of the head was needed any more after 5 months of CDT.
After 5 years of CDT, 6 years after the accident, the patient Manolis is livelier. He can produce sounds. The learned stereotyped laughing is shaped with emotions, in similarity to babies who shape their crying with emotions. But he still cannot say ‘mama’, even though the mother is trying hard to teach him. If one compares the repair with the development of children, then he is somehow in the developmental stage of one year.
This neural repair was even for the Author unexpected. When looking at his MRI one would expect that Manolis could not be brought out-of-coma (Figure 24). The expression of his face shows that he was deeply in the coma (Figure 26A). When after 4 years of CDT the Author saw that the patient could lift up the head and kiss the mother, he had the impression that Manolis raised from the dead (Figure 26C).
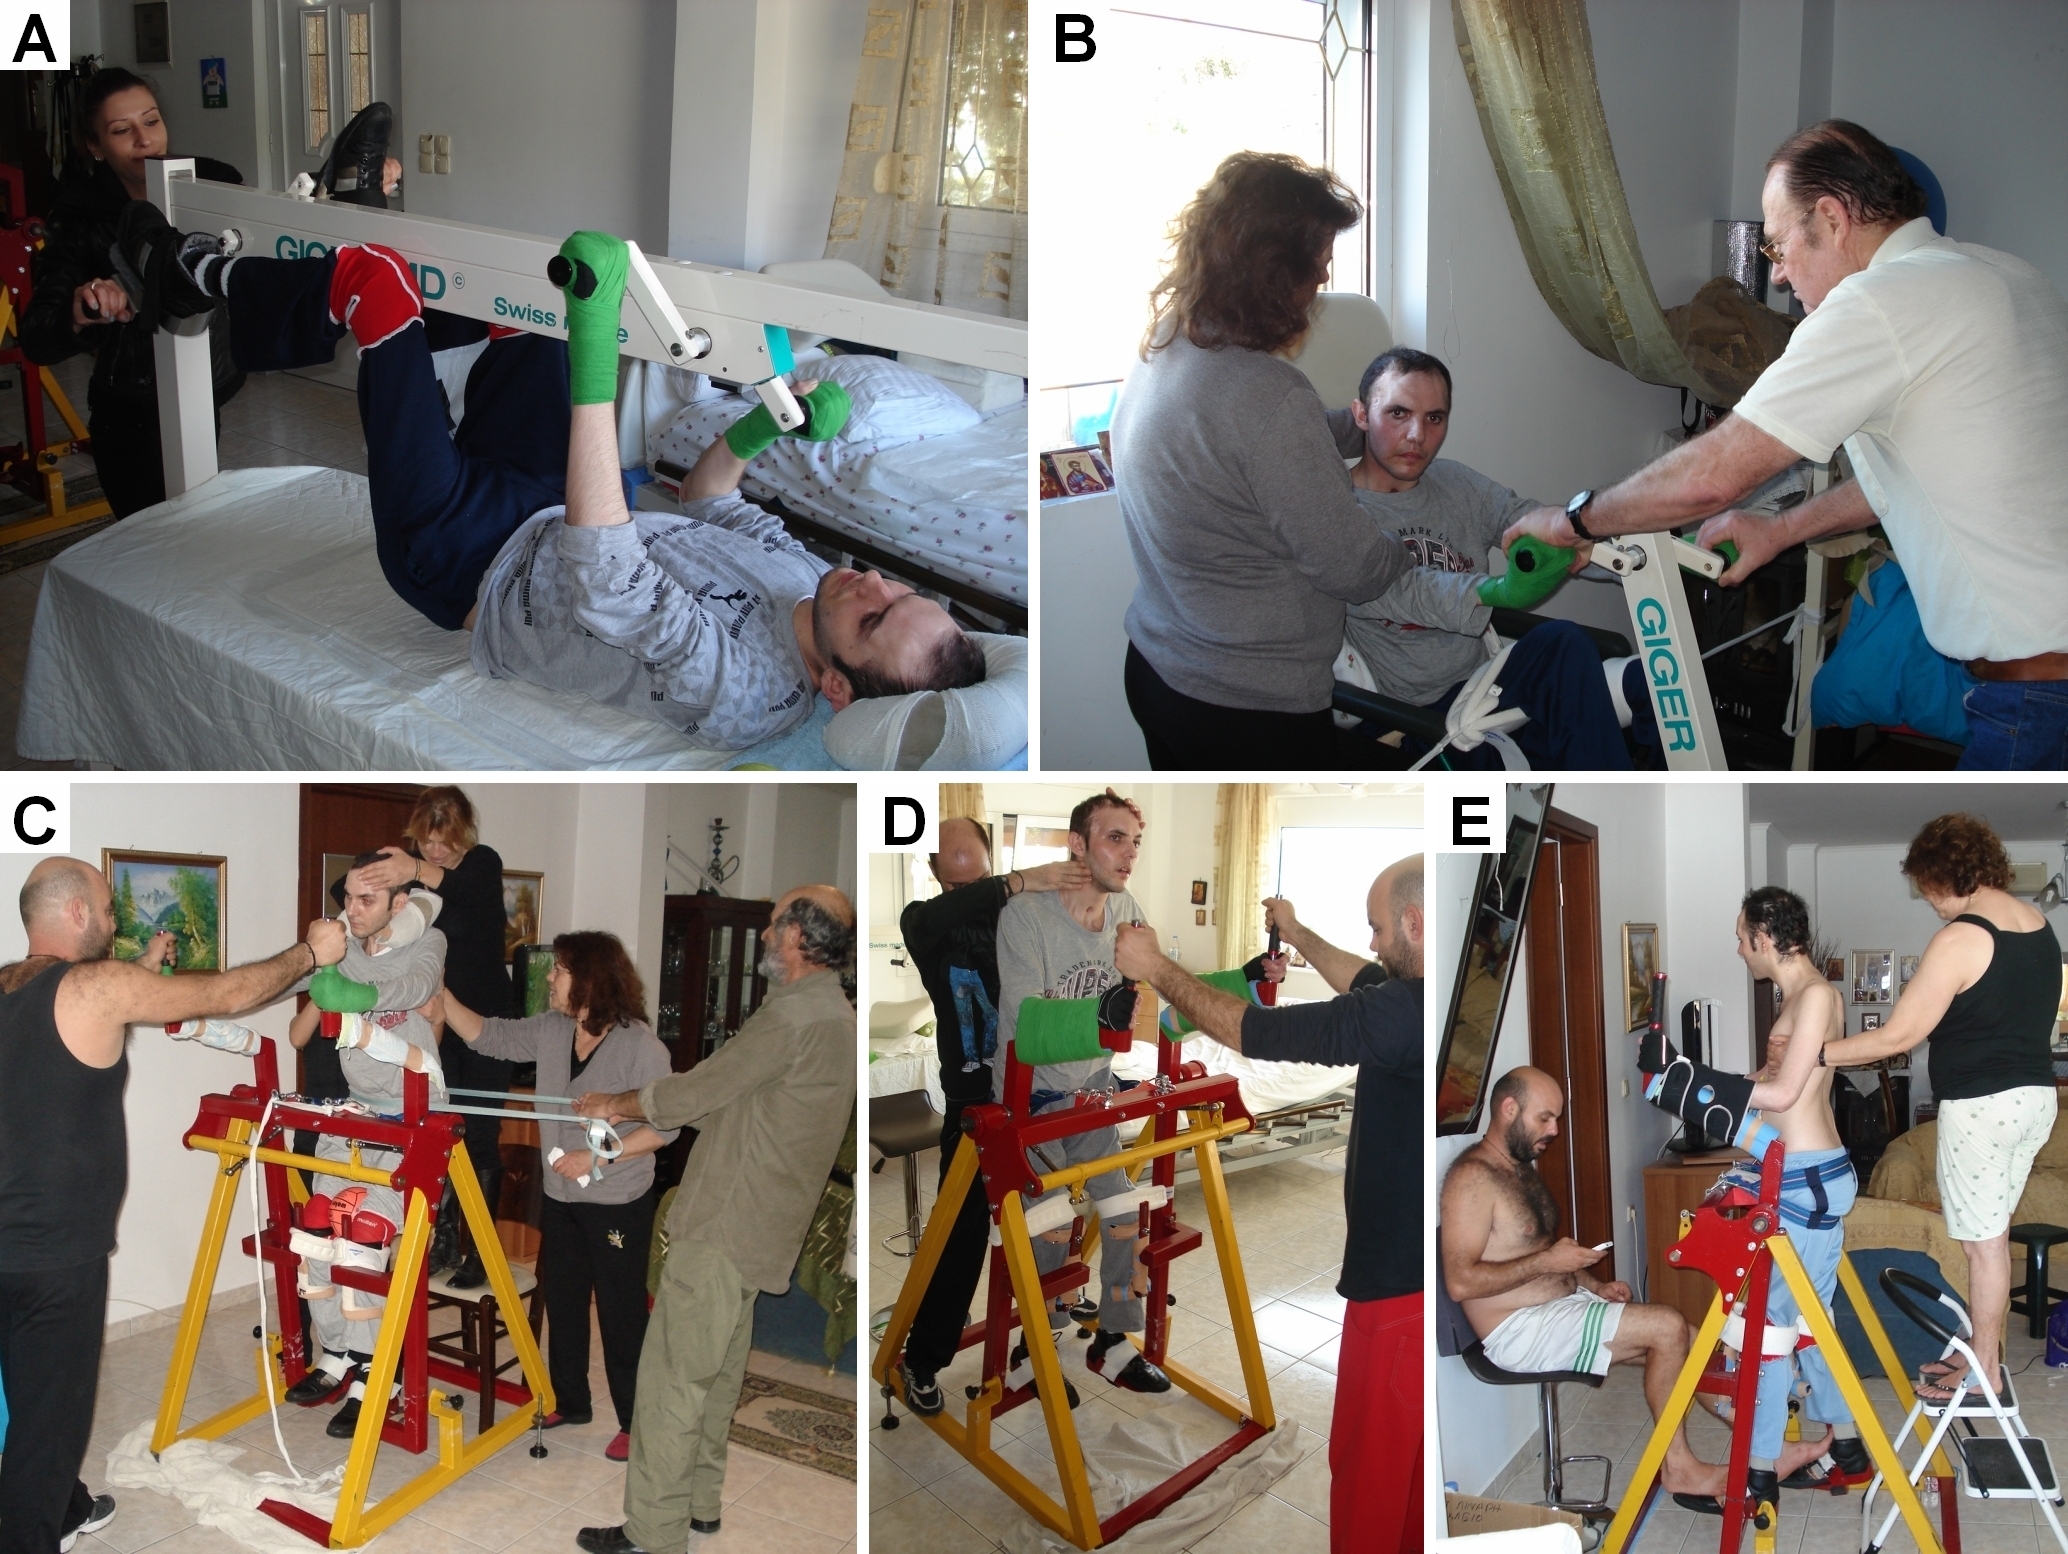
Figure 26. Picture of the 23-year-old patient being 1.5 years in the vigilant coma following a car accident (B). The impression in his face does not look as healthy as the one of the picture made 2 years before when he was in the army (A). Five years after the accident and due to 4 years of CDT, the patient recovered from the coma and can smile again (C). When exercising on the special CDT device, 5 years after the accident, his face looks healthier (D) than 1.5 years after the accident (B).
Following 5 years of CDT Manolis can sit freely on bed and chair and can play with mother with a balloon (Figures 27, 28). He gives on command also the Author the hand (Figure 28C, D). The face expression of the patient in Figure 26D looks much healthier than being in the coma (Figure 26B). The face expression developed in the direction of before the accident after leaving the army (Figure 26A). For further detailed especially at the beginning of CDT see [25].
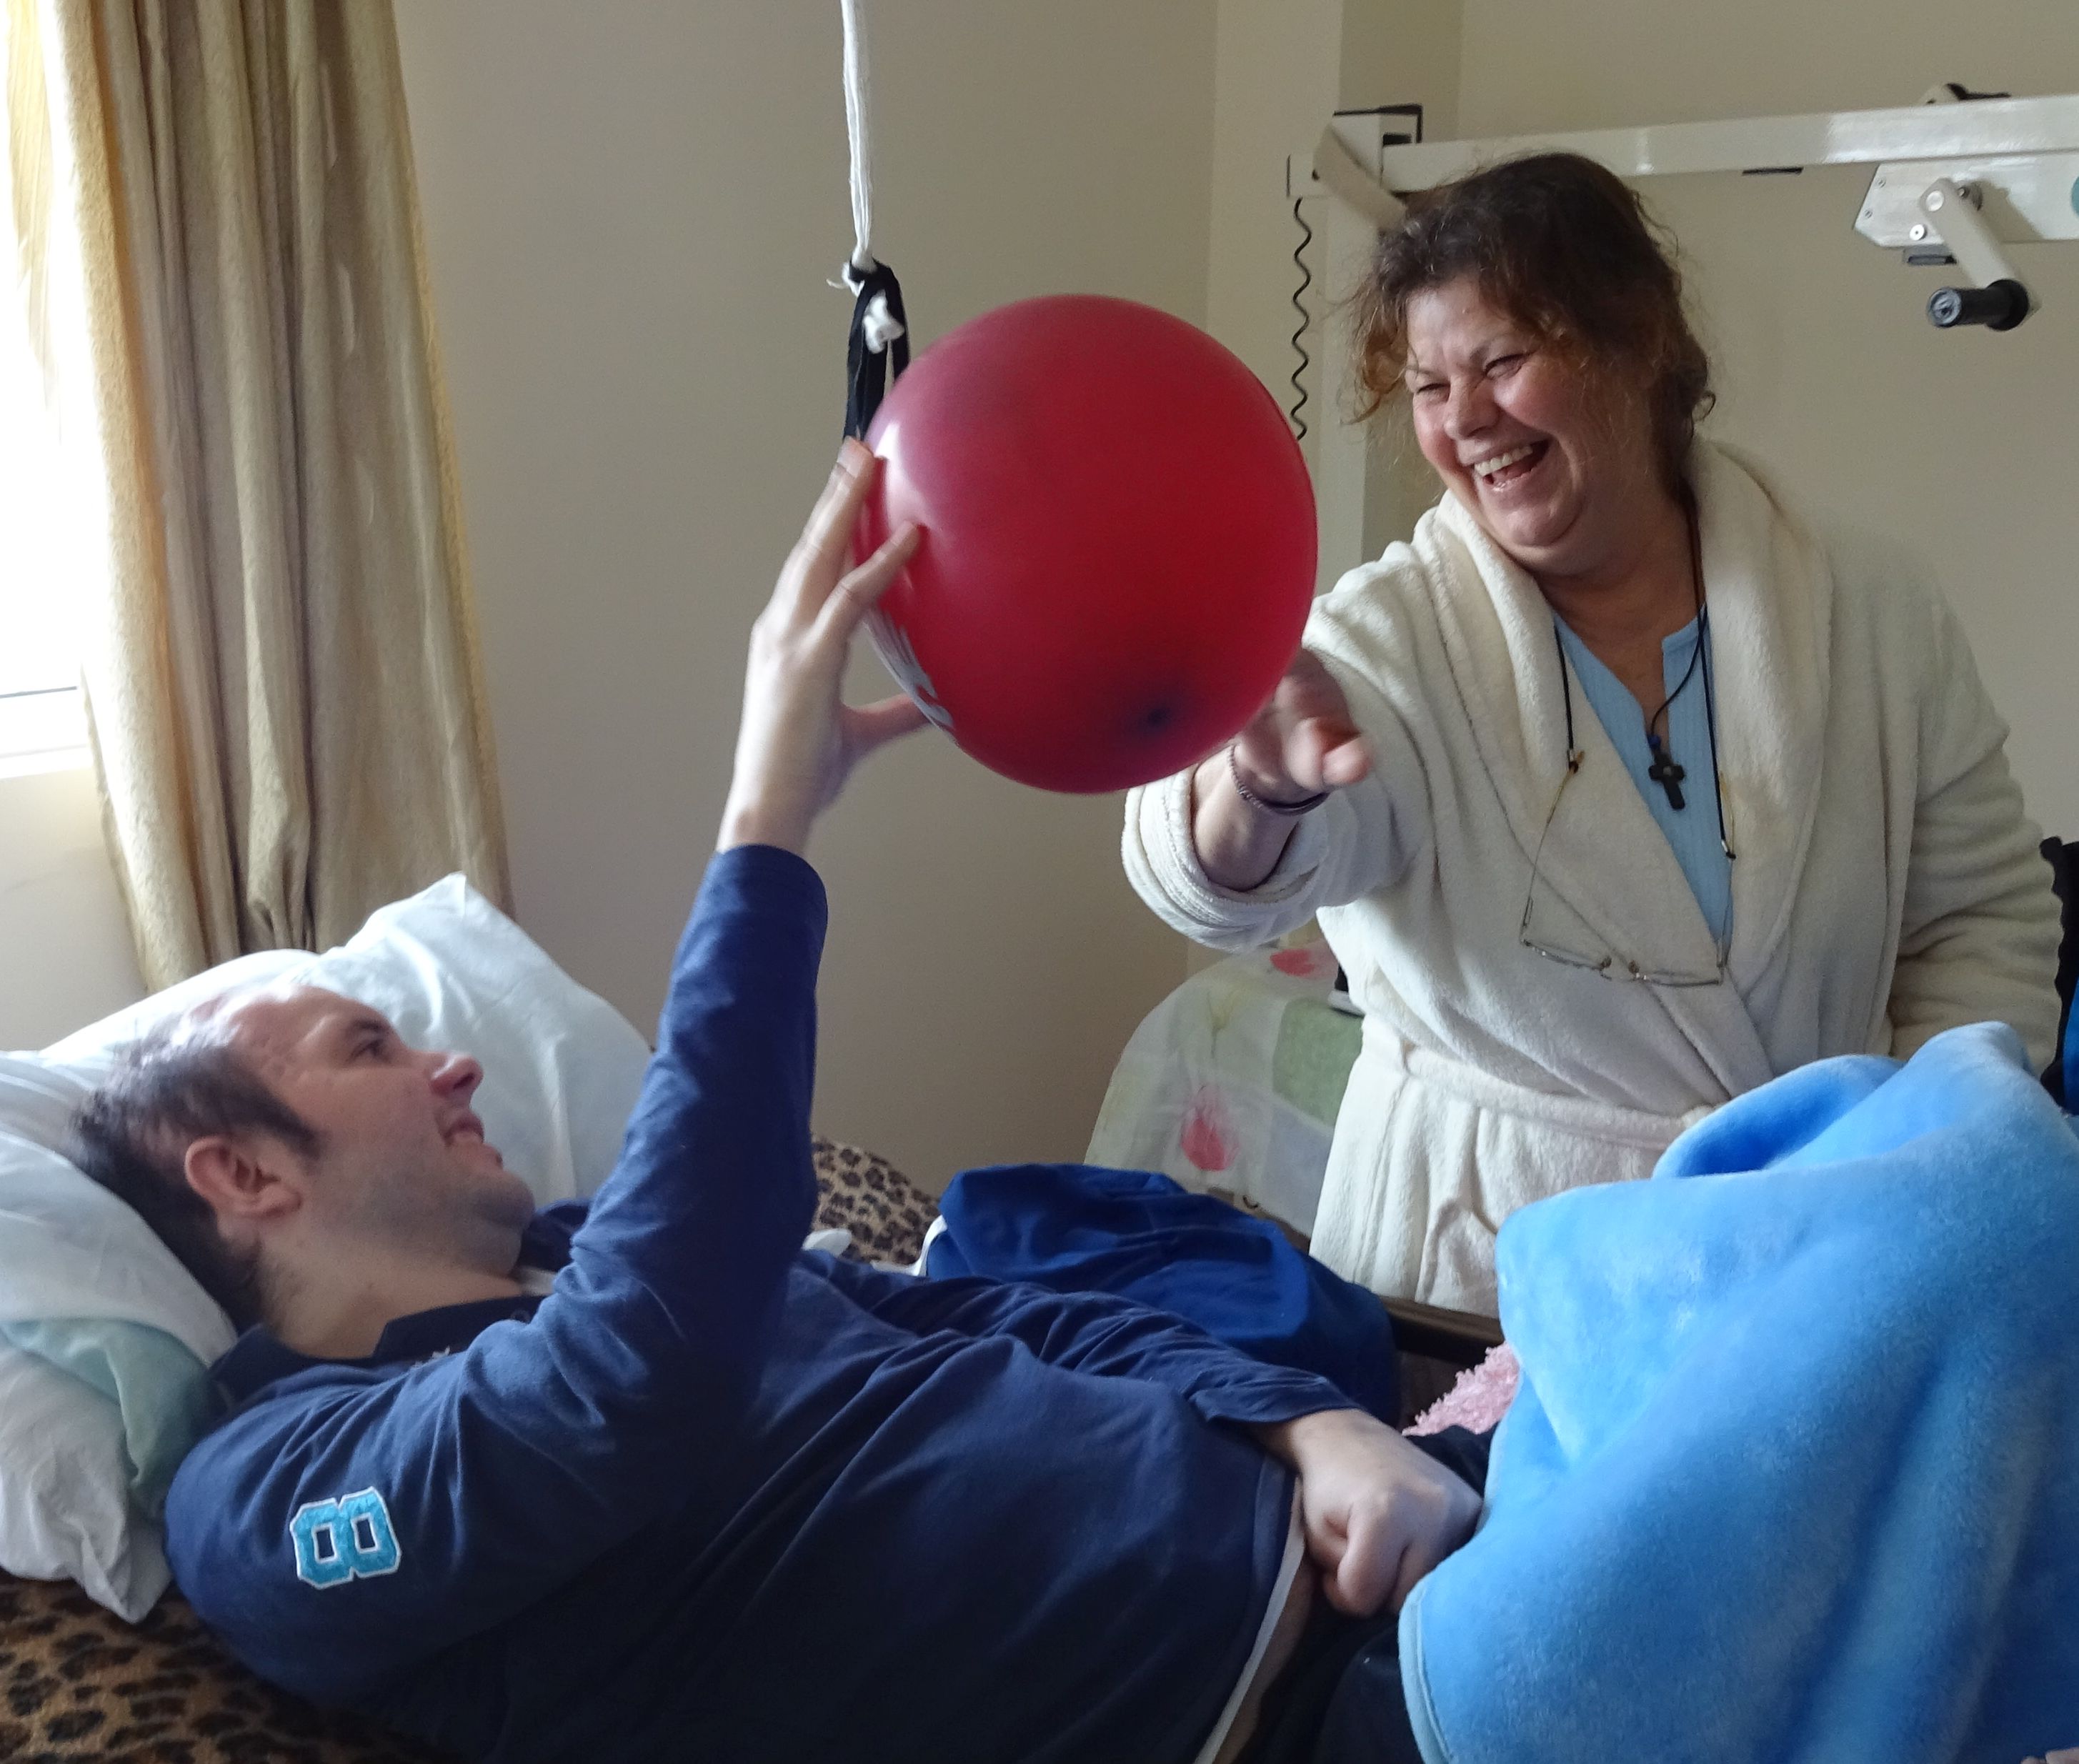
Figure 27. The mother of a former coma patient is playing with the son to catch the balloon. The movement angles of the patient’s right arm are limited. The left hand is in a spastic state. Both enjoy the game.
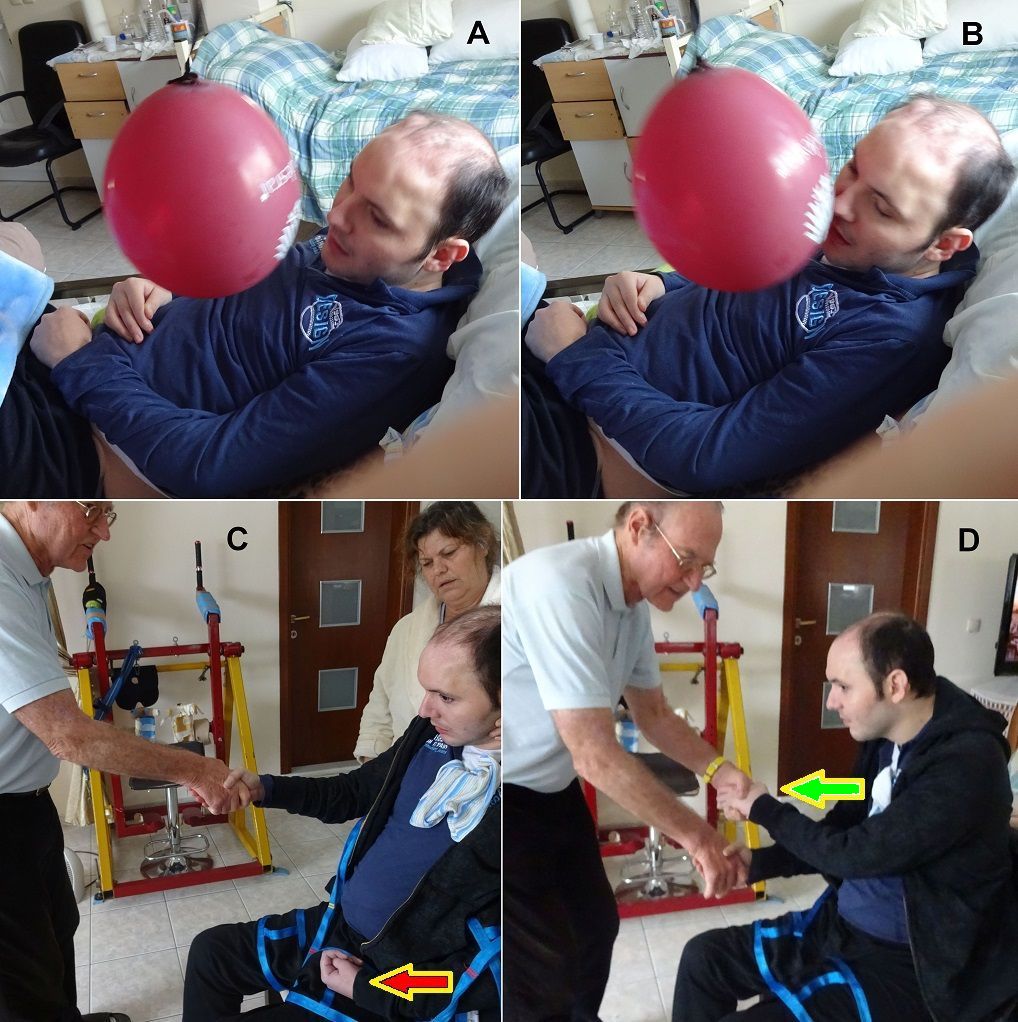
Figure 28. Volitional performed movement by the former long-term coma patient Manolis following five years of CDT, six years after the accident. A,B. The patient is able to kick rhythmically a balloon with the nose or head. C. When giving the Author only the right hand, the left hand was in a spastic pattern (red arrow). D. But when additionally, the Author took the left hand, the spasticity of the left hand disappeared (green arrow). Note the improvement of face impression of the patient from C to D.
This progress in neural repair of such severely damaged brain, makes it likely that also other long-term coma patients may be brought out-of-coma when administering aggressive CDT for several years. Leaving the coma patient without efficient therapy on the long-term may mean euthanasia. This result that a patient with that tremendous brain damage could be brought out-of-coma with an efficient movement-based learning method, administered aggressively for a few years, documents that one has to proof carefully the prognosis of such patients. Whether Manolis can regain a meaningful life back is unclear.
Brain repair after 5.5 years of CDT
It was very difficult to get the patient Manolis out of the permanent coma. After three years of CDT he started to recover from coma and following 5 years of CDT he was fully out-of-coma. When the patient was fully conscious it seemed that the repair speeded up. After 5.5 years of CDT Manolis could move the right hand and arm very well and became partly able to perform the old-learned movement playing the mandolin again (Figure 29). To play fully mandolin again, he needs substantial repair of the right hemisphere, or the left hemisphere has to take function over, to allow Manolis to have more power and coordination in the left hand to change the sound (Figure 24).
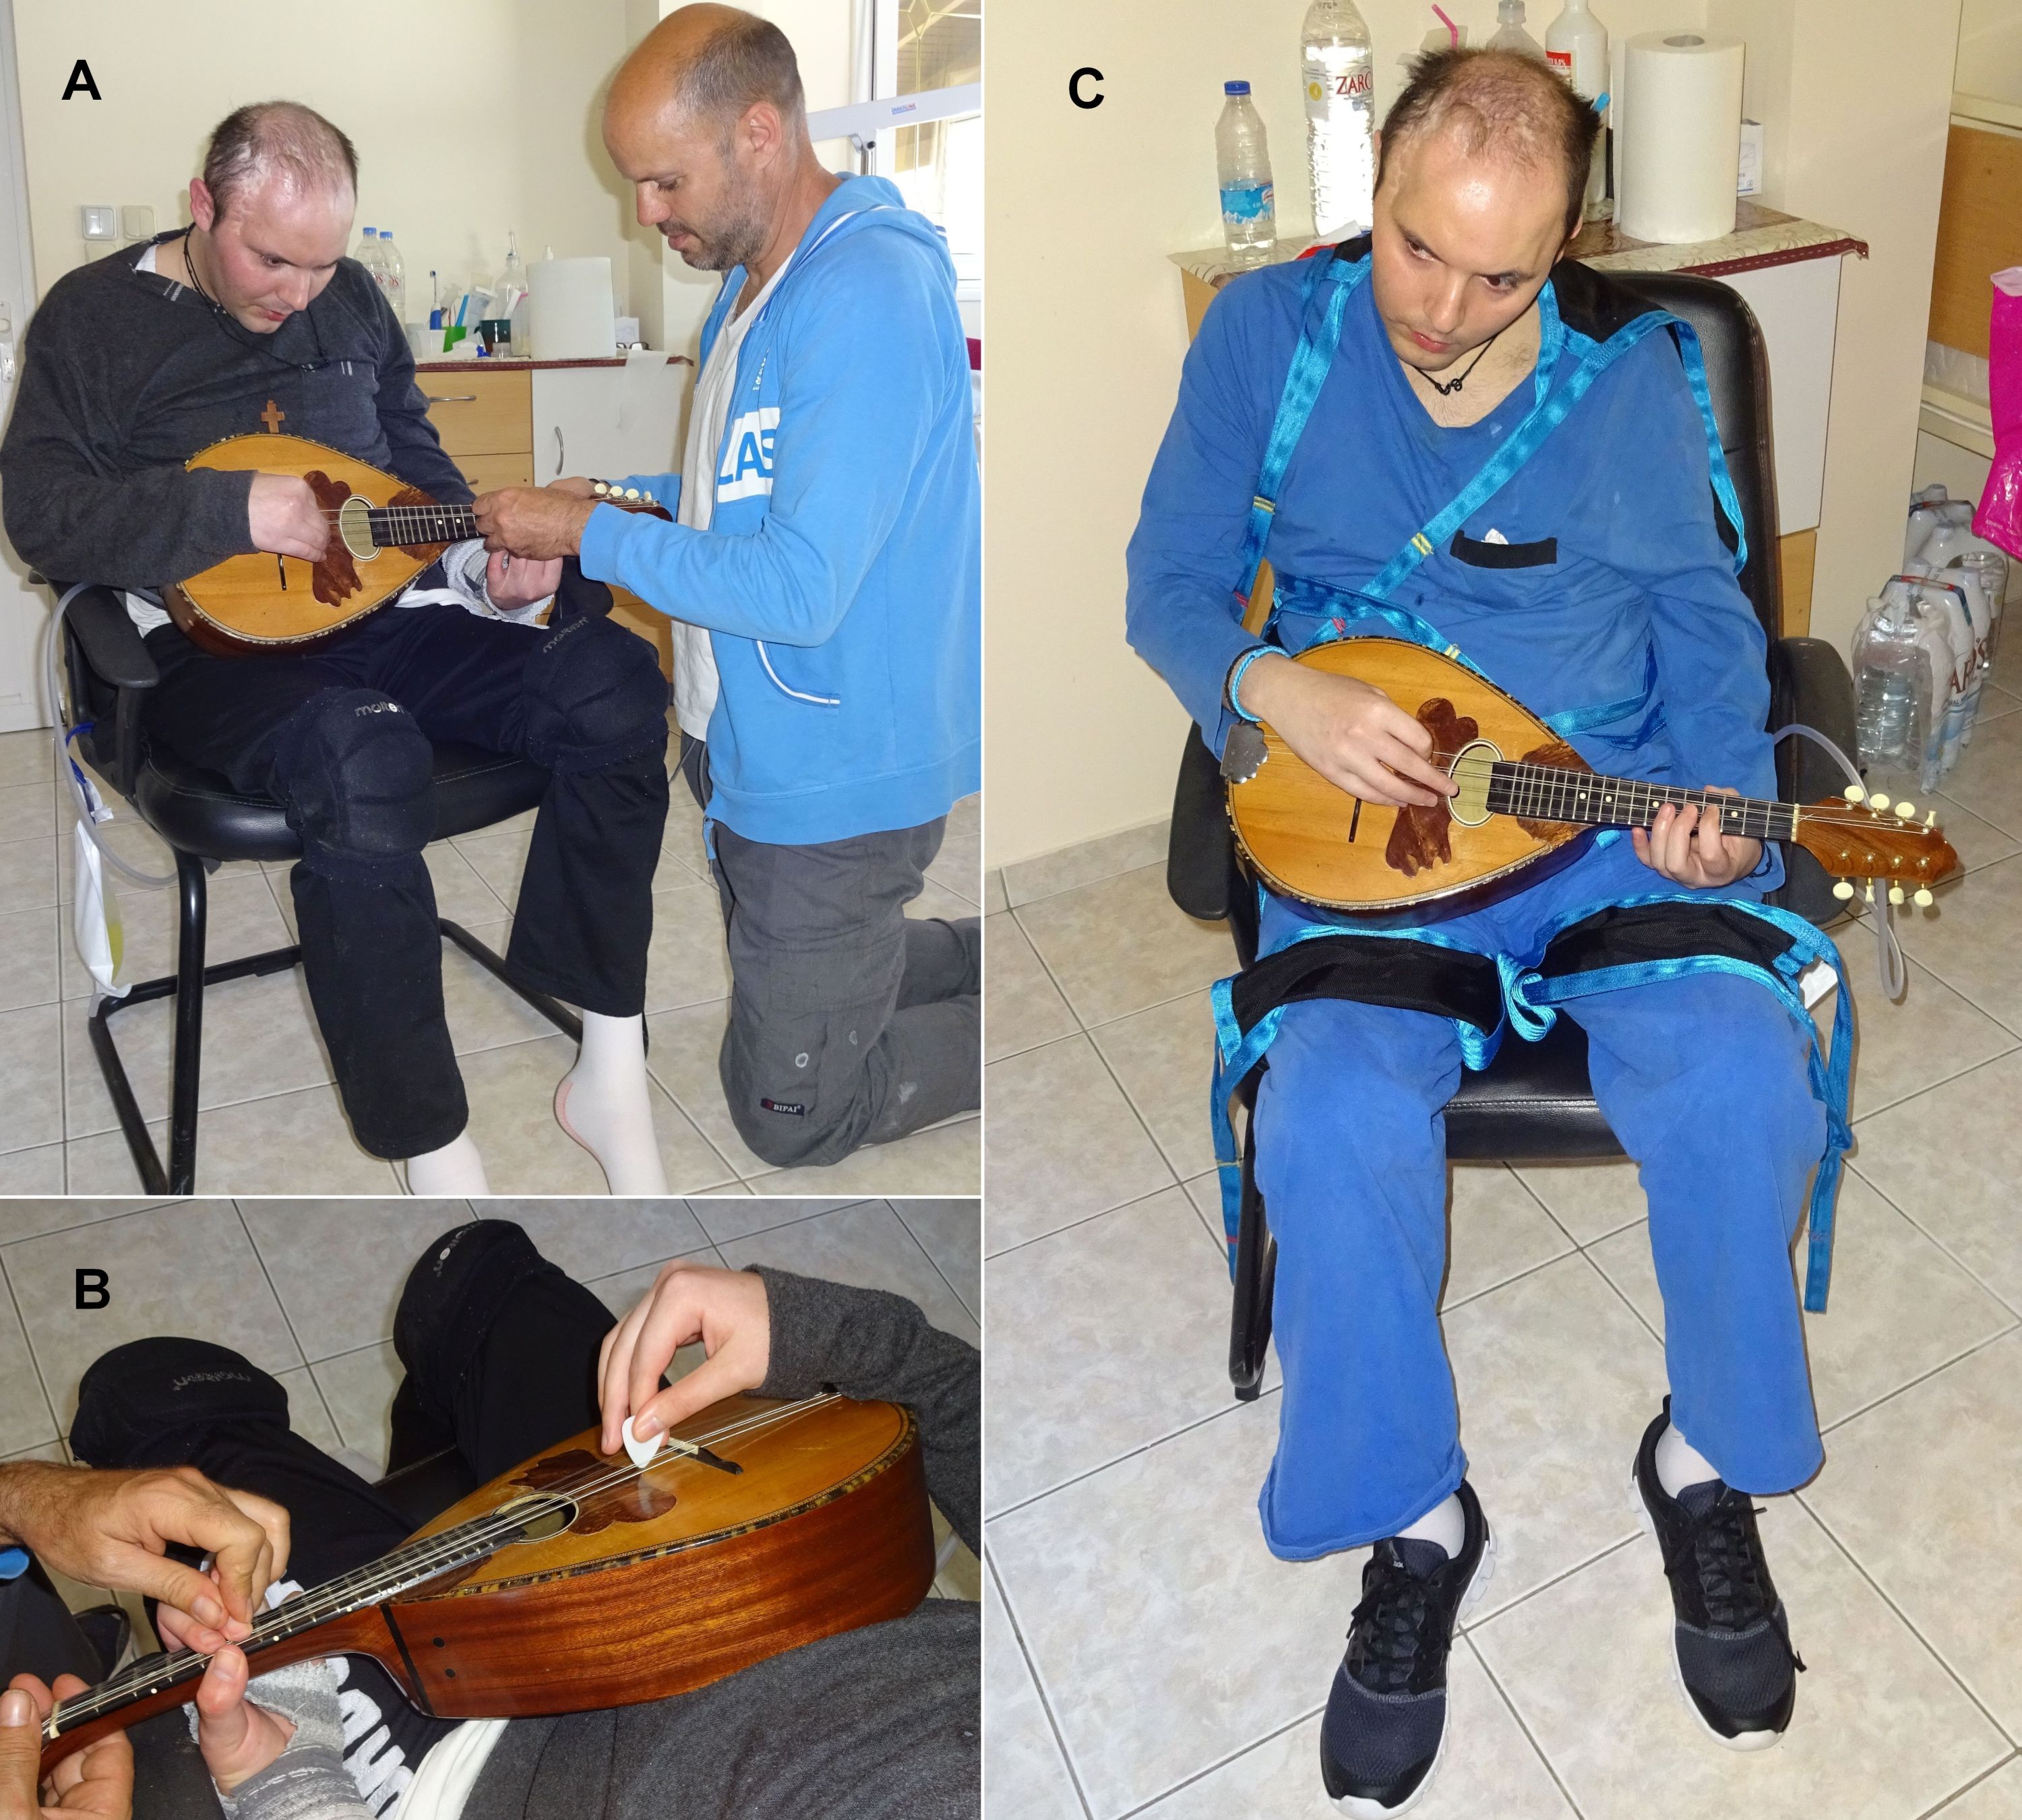
Figure 29. Preparations of the brother (A) to bring Manolis in a proper violin playing position. Note in B, how nicely Manolis can use the right fingers to generate the sound with the plectrum (Moving frequency 3 to 5Hz, which is the eigen-frequency of α2-motoneurons). When playing violin in C, his face looks quite healthy.
Conclusion
It was shown that the human brain and spinal cord can partly be repaired by a movement-based learning treatment called ‘Coordination Dynamics Therapy’. Because of the missing of the infrastructure and knowledge of therapists in the field of human neurophysiology only few patients with CNS injury can benefit from the new treatment. In Medical Faculties it has to be realized that human neurophysiology has to be red to give medical students a chance to learn more about the functioning of the human brain and to repair it. Since only 0.3% of the animal data have consequences for human patients, basic clinical research, translational medicine and case reports are needed in medicine to improve the health of patients [27-30].
References
- Schalow G (2013) Human Neurophysiology: Development and Repair of the Human Central Nervous System.
- Schalow G (2015) Repair of the Human Brain and Spinal Cord. Nova Science Publisher, Hauppauge NY, USA.
- Schalow G (2015) Neural network learning in humans. Nova Science Publishers, Inc., Hauppauge NY, USA, 329.
- Schalow G (2002) Stroke recovery induced by coordination dynamic therapy and quantified by the coordination dynamic recording method. Electromyogr Clin Neurophysiol 42, 85-104.
- Schalow G (2002) Improvement after traumatic brain injury achieved by coordination dynamic therapy. Electromyogr Clin Neurophysiol 42, 195-203.
- Schalow G (2002) Recovery from spinal cord injury achieved by 3 months of coordination dynamic therapy. Electromyogr Clin Neurophysiol 42: 367-376. [Crossref]
- Schalow G (2003) Partial cure of spinal cord injury achieved by 6 to 13 months of coordination dynamic therapy. Electromyogr Clin Neurophysiol 43: 281-292. [Crossref]
- Schalow G, Pääsuke M, Ereline J, Gapeyeva H (2004) Improvement in Parkinson’s disease patients achieved by coordination dynamics therapy. Electromyogr Clin Neurophysiol 44, 67-73.
- Schalow G, Jaigma P (2005) Cerebral palsy improvement achieved by coordination dynamics therapy. Electromyogr Clin Neurophysiol 45, 433-445.
- Schalow G and Jaigma P (2006) Improvement in severe traumatic brain injury induced by coordination dynamics therapy in comparison to physiologic CNS development. Electromyogr Clin Neurophysiol 46, 195-209.
- Schalow G (2006) Hypoxic brain injury improvement induced by coordination dynamics therapy in comparison to CNS development. Electromyogr Clin Neurophysiol 46, 171-183.
- Schalow G (2006) Cerebellar injury improvement achieved by coordination dynamics therapy. Electromyogr Clin Neurophysiol 46, 433-439.
- Schalow G, Jaigma P, Belle VK (2009) Near-total functional recovery achieved in partial spinal cord injury (50% injury) after 3 years of coordination dynamics therapy. Electromyogr Clin Neurophysiol 49, 67-91.
- Schalow G (2009) Building of New Motoneurons in the Human Spinal Cord upon Coordination Dynamics Therapy to Improve Finger Functions in Motoric Complete Cervical Spinal Cord Injury. In: Berkovsky, T.C (Ed.), Handbook of Spinal Cord Injuries, Chapter 4. pp. 231-264, Nova Science Publishers.
- Schalow G (2010) Scientific basis for learning transfer from movements to urinary bladder functions for bladder repair in patients with spinal cord injury. Electromyogr Clin Neurophysiol 50, 339-395.
- Schalow G (2010) Cure of urinary bladder functions in severe (95%) motoric complete cervical spinal cord injury in human. Electromyogr Clin Neurophysiol 50, 155-179.
- Schalow G and Nyffeler T (2001) Koordinationsdynamik-Therapie: Myelomeningozele (Spina bifida) Physiotherapie.
- Schalow G and Nyffeler T (2000) Koordinatiosdynamik-Therapie: Skoliose. Physiotherapy.
- Schalow G (2015) Human neurophysiology and movement-based learning for repairing the human brain. In: “Horizons in neuroscience research. Volume22”. Editors: Andreas Costa and Eugenio Villalba. Nova Science Publishers, Inc., Hauppauge NY, USA, 31-137.
- Schalow G, Lang G (1987) Recording of single unit potentials in human spinal nerve roots: a new diagnostic tool. Acta Neurochir (Wien) 86: 25-29. [Crossref]
- Schalow G, Zäch GA, Warzock R (1995) Classification of human peripheral nerve fibre groups by conduction velocity and nerve fibre diameter is preserved following spinal cord lesion. J Auton Nerv Syst 52: 125-150.
- Schalow G (2005) Phase and frequency coordination between neuron firing as an integrative mechanism of human CNS self-organization. Electromyogr Clin Neurophysiol 45: 369-383.
- Kelso JAS, (1995) Dynamic Patterns. The Self-Organization of Brain and Behavior. MIT Press, Cambridge.
- Schalow G (2017) Breast cancer grows inhibition via coordination dynamics therapy. In: “Horizons in Cancer Research”, Volume 68. Nova Science Publisher, New York.
- Schalow G (2017) Coma recovery achieved after 4 years of coordination dynamics therapy of a patient who lost 50% of his brain tissue in a car accident. In: “Horizons in Neuroscience Research”. Volume 32. Nova Science Publisher, New York.
- Schnakers C (2009) Diagnostic accuracy of the vegetative and minimally conscious state: clinical consensus versus standardized neurobehavioral assessment. BMC Neurology 9, 35.
- Schalow G (2018) Coma and spinal cord injury recovery achieved via coordination dynamics therapy. Clinical Case Reports and Reviews 4: 1-7
- Schalow G, (2009) Impaired coordination between oscillatory firing FF and FR-type motor units in Parkinson’s disease and patients with spinal cord injury. In: Berkovsky, T.C (Ed.) Nova Science Publishers. Handbook of Spinal Cord Injuries Chapter 15. 501-517.
- Deisseroth K, Singla S, Toda H (2004) Excitation-neurogenesis coupling in adult neural stem/progenitor cells. Neuron 42, 535-552.
- Schöner G, Zanone PG, Kelso JA (1992) Learning as change of coordination dynamics: theory and experiment. J Mot Behav 24: 29-48. [Crossref]