Digestive tract functions decline depending on the period of parenteral nutrition treatment, and a gradual transition to enteral nutrition as soon as possible is being encouraged. Rapid treatment via enteral nutrition is important to prevent the decline of intestinal capabilities following a parenteral nutrition state. However, the ideal nutrients leading to the recovery of intestinal functions remain unknown. We investigated what nutrient types more efficiently recover small intestinal capabilities using a rat model of total parenteral nutrition (TPN). We administered TPN conditions for 7 days with Wistar rats (male, 10 weeks old, each experiment n = 5). Selected nutrients [i.e. long-chain triglycerides, medium-chain triglycerides (MCTs), glucose or fructose] were administered orally for 3 days starting from day 8 of TPN. Morphology of the jejunal villus, mRNA expression levels for the digestion/absorption of nutrient-related genes and disaccharidases activity were markedly recovered following oral administration of all nutrients tested in this study. In particular, MCTs comprehensively and fructose specifically for mRNA expression more efficiently recovered small intestinal capabilities. Our results suggest that the difference in the chemical structure even the same kind of nutrient have an impact on the morphology and functions of the small intestine. Especially, fructose intake after TPN may be useful for the recovery of gastrointestinal functions during the transition phase to normal diet.
parenteral nutrition, enteral nutrition, small intestine, digestion/absorption of nutrients, medium-chain triglycerides, fructose
Abbreviations
TPN: Total Parenteral Nutrition; EN: Enteral Nutrition, LCTs: Long-Chain Triglycerides; MCTs: Medium-Chain Triglycerides; Glu: Glucose; Fru: Fructose
Long-term treatment with parenteral nutrition (PN) enhances the dysfunction of the digestive tract. This influence especially appears within the entire small intestine in the form of villous atrophy. Previous study has reported that PN treatment enhances both villous atrophy and decline of intestinal capabilities [1]. At present, to prevent these digestive tract disorders, timely ingestion of nutrients either orally or enterally as soon as possible has recommended even in cases in which a fasting period is required.
Many enteral nutrition (EN) fluids have been commercially developed to date. However, some related issues remain, such as the appropriate nutrient composition within the EN fluid to recover small intestinal capabilities. In this study, we focused on the recovery effects against intestinal capabilities of two nutrients, i.e. saccharides and lipids. Although glucose (Glu) as dextrin is generally included in the EN fluids, fructose (Fru) is not actively used because excessive Fru intake induces non-alcoholic fatty liver disease [2]. However, Fru does exhibit characteristic effects on intestinal epithelial cells such as the induction of sugar transporters [3]. Therefore, we hypothesized that short-term or transient Fru ingestion may conversely induce the recovery of intestinal capabilities. In terms of lipid sources, long-chain triglycerides and medium-chain triglycerides (MCTs) are the most popular additives for EN. In particular, it is known that MCTs have an efficacy to activate the small intestinal capabilities [4].
We performed this study based on two different points of view. The first was to explore whether capabilities of digestion/absorption in the small intestine were activated by the gavage of a singular nutrient into the intestinal tract. The second was to supply knowledge concerning the effect of Fru on intestinal capabilities via an investigation into differences of the recovery effect between Glu and Fru against small intestinal functions.
Materials
TPN liquid was purchased commercially (NEOPAREN® No. 2 injection, Otsuka Pharmaceutical Factory, Inc., Tokushima, Japan). Corn oil as a long-chain triglycerides (LCTs) was purchased from Wako Pure Chemical Industries Ltd (Osaka, Japan). MCTs, including octanoic acid and decanoic acid concentrations of 75% and 25%, respectively, were purchased from the Nisshin Oillio Group (Tokyo, Japan). Glu and Fru were purchased from Kanto Chemical Co., Inc. (Tokyo, Japan).
Animals
The Yamagata University animal ethics committee approved this study (approval number: 23121, 24075 and 25025). All animals were housed under the managed environment. Seven-week-old male wistar strain rats (body weight 200 g) were purchased from Japan SLC, Inc. (Hamamatsu, Japan). Rats were housed on a 12-h light-dark cycle with ad libitum access to a standard diet (CRF-1; Oriental Yeast, Tokyo, Japan) and water at the commencement of the experiment.
TPN
We performed surgery on eight-week-old rats and inserted a catheter into the jugular vein under anesthesia [intraperitoneal injection of 40 mg/kg body weight sodium pentobarbital]. TPN liquid was injected for 7 days so that the total amount of administered energy became 250 kcal/kg BW/day. All TPN liquid was administered by a syringe pump (YSP-101, YMC CO., LTD, Kyoto, Japan) over 24 hours. Sham animals (as controls for TPN-treated animals) had ad libitum access to a standard diet and water until the conclusion of the experiment following surgery. TPN-treated animals (i.e. TPN group) were euthanized and dissected 7 days following TPN treatment.
Oral administration of nutrients following TPN treatment for 7 days
We divided the rats into four groups and performed oral administration of each nutrient. Lipid gavage groups were administered each lipid (LCTs or MCTs) so that the amount of administered energy reached 20% (50.0 kcal/kg BW/day) of total energy. Likewise, carbohydrate gavage groups were administered each carbohydrate (Glu or Fru) so that the amount of administered energy reached 20% (50.0 kcal/kg BW/day) of total energy. Each carbohydrate solution was prepared at 20% (W/W) for oral administration. The lacking amount of energy (200 kcal/kg BW/day) calculated from the total energy intake in each nutrient gavage group was continuously injected into the jugular vein by TPN liquid for 3 days.
Preparation of jejunal samples
The TPN group was dissected 7 days after the start of TPN liquid cannulation. Sham and nutrient-administered groups were dissected 10 days after the start of the experiment. Animals were euthanized under isoflurane anesthesia (Wako Pure Chemical Industries Ltd). The entire small intestine was removed, and the duodenum extending from the pylorus to the ligament of Treitz was isolated and flushed with ice-cold 0.9% NaCl solution. The proximal one-third of the jejunoileum was considered as the jejunum, and 1 cm at approximately the central position of the jejunum was histochemically stained. The remaining jejunal samples were used for gene expression analysis and measurement of enzyme activity. Jejunal samples were frozen in liquid nitrogen and stored at −80°C.
Histochemical staining
Tissues segments were fixed in a 10% formalin phosphate buffer (Nacalai Tesque, Kyoto, Japan) for at least 1 week. Fixed jejunal samples were washed twice with PBS (2.7 mM KCl, 1.76 mM KH2PO4, 137 mM NaCl, 10 mM Na2HPO4), and then immersed in 30% sucrose solution (Wako Pure Chemical Industries Ltd) for 1 week to displace intercellular water. Samples were then embedded in Tissue-Tek® O.C.T. Compound (Sakura Finetek, Tokyo, Japan), and frozen rapidly with liquid nitrogen. The embedded samples were preserved at −80°C until use. Embedded jejunal samples were sectioned into 7 µm slices using a cryostat (LEICA CM 3050S, Leica, Wetzlar, Germany) and stained with both hematoxylin and eosin. These sections were then imaged with a biological microscope (BA210E, Shimazu Corporation, Kyoto, Japan) at 100x magnification.
Total RNA extraction and cDNA synthesis
Total RNA was extracted from the intestinal mucosa samples of the jejunum and the ileum using TRIzol™ Reagent (Thermo Fisher Scientific, MA, USA). These samples (500 ng) were then converted to cDNA by reverse transcription using a Takara prime RT reagent Kit (TakaraBio, Shiga, Japan).
Quantitative reverse transcription-PCR (qRT-PCR)
A qRT-PCR was performed to quantify the mRNA levels of target genes using an ABI 7500 real-time PCR system (Life Technologies, CA, USA). PCR was performed with the SYBR Premix Ex Taq II (Tli RNase H Plus, TakaraBio); primer sequences are listed in Table 1. The cycle threshold (CT) values obtained by qRT-PCR analysis and mRNA levels were calculated using CT values based on the ΔΔCt method.
Table 1. Primers sequences for qRT-PCR.
|
Accession No. |
Gene name |
Primer sequences |
Product size (bp) |
|
NR_046246.1 |
28s ribosomal RNA |
5′-CCCAGAAAAGGTGTTGGTTGA-3′ |
93 |
5′-TGATTCGGCAGGTGAGTTGTT-3′ |
|
NM_031012.1 |
Alanyl aminopeptidase (Anpep) |
5′-TTGACAGCATCACCTACAGCAA-3′ |
149 |
5′-TGTTCCCACAGGTCCAGATAAA-3′ |
|
NM_019283.3 |
Solute carrier family 3, member 2 (Slc3a2) |
5′-GACATCCTTTATACCGGCTCAGTT-3′ |
189 |
5′-CAGGACTTGAGGTTTGGGAGTT-3′ |
|
NM_057121.1 |
Solute carrier family 15, member 1 (Slc15a1) |
5′-CAGTGGGCTGAGTATGTTCTGTTC-3′ |
151 |
5′-TTTCCTTCCCTACGCCCTTT-3′ |
|
NM_012556.2 |
Fatty acid binding protein 1, liver (Fabp-1) |
5′-CCAAGTGCAGAGCCAAGAGA-3′ |
143 |
5′-CCCATAGGTGATGGTGAGTTTG-3′ |
|
NM_013068.1 |
Fatty acid binding protein 2, intestine (Fabp-2) |
5′-GGCATTAACGTGGTGAAGAGG-3′ |
135 |
5′-GACGCCGAGTTCAAACACAA-3′ |
|
NM_012738.1 |
Apolipoprotein A-1 (Apoa1) |
5′-TCAGGAGTTCTGGGCTAACCTG-3′ |
132 |
5′-ACCTCCTCGTTCCACTTCTCCT-3′ |
|
NM_013061.1 |
Sucrase-isomaltase (Si) |
5′-GCAGAAGGCTACATGGA-3′ |
141 |
5′-CCTTGCGACTGTCTCA-3′ |
|
NM_053841.1 |
Lactase phlorhizin hydrolase (Lph) |
5′-GATGAGCTATGCAGGCTATGG-3′ |
100 |
5′-ATGTGCCTTGAGGATCAGGT-3′ |
|
NM_013033.2 |
Sodium/glucose cotransporter 1 (Sglt1) |
5′-TGTACCCTGTGTGGCT-3′ |
132 |
5′-GGTGCCGCAGTATTTC-3′ |
|
NM_031741.1 |
Facilitated fructose transporter (Glut5) |
5′-GTCTTGGCAAGCGAGGAA-3′ |
91 |
5′-CAGGAAAGAAGGGCAGCA-3′ |
|
NM_012669.1 |
Hepatocyte nuclear factor 1 alpha (Hnf-1a) |
5′-GTCCCTTCATGGCAACCA-3′ |
121 |
5′-GGTGTCTGTGATCAGCATGG-3′ |
|
NM_023963.1 |
Caudal type homeobox (Cdx-2) |
5′-TGGTGTACACAGACCATCAGC-3′ |
142 |
5′-CTGCGGTTCTGAAACCAAAT-3′ |
|
NM_022665.3 |
Alkaline phosphatase, intestinal (Alp-i) |
5′-CATCGCCACACAGCTCATTT-3′ |
150 |
5′-TCCACCAAGTTCCGACTATCCA-3′ |
|
NM_012640.2 |
Retinol binding protein 2, cellular (Rbp-2) |
5′-AACAGCACGTTCCGCAACTAT-3′ |
140 |
5′-TCCCCTTTCTGCACACACAC-3′ |
|
NM_030834.1 |
Solute carrier family 16, member 3 (Slc16a3) |
5′-AGTTTGAGGTGCTCATGGCTA-3′ |
137 |
5′-GTAAACTTTCGTTGCGTCCAG-3′ |
|
NM_053863.1 |
Solute carrier family 28, member 1 (Slc28a1) |
5′-GAGTGGCTTGGTGACAAGAAA-3′ |
84 |
5′-GAAGTTGGCAAATCCACAGAG-3′ |
Disaccharidase activity assay
Each intestinal mucosa sample of the jejunum was homogenised in a 10 mM potassium phosphate buffer (consisting of 10 mM potassium dihydrogenphosphate and 10 mM dipotassium hydrogenphosphate, pH 7.0) using a homogeniser (HOM, AS ONE, Japan). Homogenates were used in disaccharidase activity assays according to the method developed by Dahlqvist [5]. The reaction conditions were optimised for each disaccharide substrate [using 56 mM maltose (Sigma–Aldrich, St. Louis, MO, USA), 56 mM sucrose (Sigma–Aldrich) and 56 mM lactose (Sigma–Aldrich) in a 0.1 M maleic acid buffer (pH 5.8)]. Mixtures of homogenate and disaccharide substrate were then incubated at 37°C for 20 minutes in a 96-well plate. The mixture for the lactase assay contained p-hydroxymercuribenzoate (final concentration 76 mg/mL) to inhibit any residual b-galactosidase activity. After incubation, the reaction temperature was raised to 100°C for 2 minutes to inactivate disaccharidases. To detect degraded glucose from each disaccharidase, a TGO reagent (ratio of 0.5M Tris-HCl, pH 7.0 to Glu CII test Wako [Wako Pure Chemical Industries Ltd] of 3:7) was added to each well and incubated at 37°C for 30 minutes. Then, 200 µL of reacted solutions were transferred to a new 96-well plate, and absorbance was measured at 505 nm using a microplate reader (Varioskan Flash, Thermo Fisher Scientific). Total protein concentrations of each homogenate were determined using a BCA protein assay Kit (TakaraBio).
Statistical analysis
Data were analysed using Bell Curve® excel statistics for Windows® (Social Survey Research Information Co. Ltd, Tokyo, Japan). Significant differences between groups were evaluated using the Student’s t-test (e.g. Sham vs. TPN group, TPN vs. each nutrient gavage group, TPN+LCT vs. TPN+MCT group, and TPN+Glu vs. TPN+Fru group).
Morphological changes within the jejunal villus in each treatment group
The morphology of the jejunal villus of the TPN group was remarkably atrophied compared with the jejunal villus of the Sham group. In contrast, the morphology of the jejunal villus in each nutrient-administered group was extended compared with the TPN group, although there were no differences between each other (Figure 1).
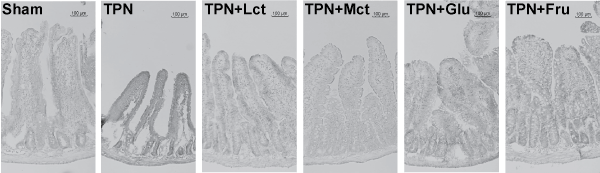
Figure 1. Morphological changes in the jejunal villus within each treatment group. Jejunal sections of each treatment group were stained with hematoxylin and eosin. All images of small intestinal sections were photographed at 100x magnification. The scale bar represents 100 µm.
Changes in mRNA levels of digestion/absorption of amino acids/peptides and lipids-related genes in the TPN group and each nutrient-administered group
For three representative genes involved in the digestion and absorption of amino acids/peptides, we analysed the following: the alanyl membrane aminopeptidase (Anpep); the solute carrier family 3, member 2 (Slc3a2), a sodium ion-independent neutral amino acid transporter; the solute carrier family 15 member 1 (Slc15a1), a hydrogen ion-dependent peptide transporter. The mRNA expression levels of these genes were unchanged in the TPN group compared with Sham group. On the other hand, the expression levels of these genes were significantly increased in each nutrient-administered group following TPN treatment for 7 days. In particular, the mRNA expression levels of these genes were induced in the lipids-administered group compared with the monosaccharide-administered group. Additionally, the mRNA expression levels of Anpep were remarkably higher in the TPN+MCT and TPN+Fru groups compared with the TPN+LCT and TPN+Glu groups, respectively (Figure 2A).
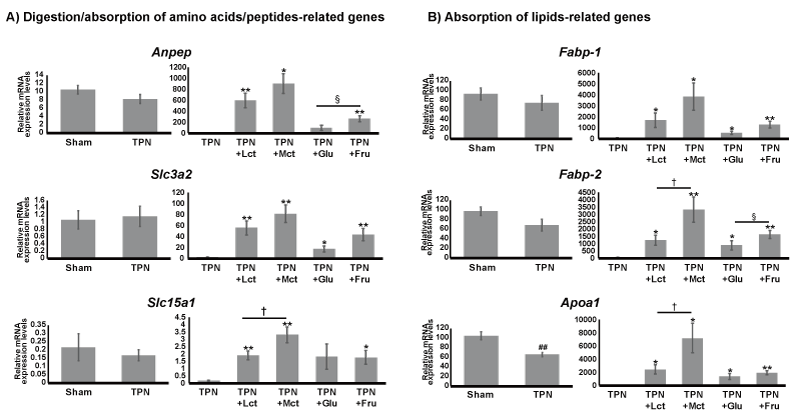
Figure 2. Changes in mRNA levels with digestion/absorption of amino acids/peptides and lipids-related genes in TNP group as well as each nutrient-administered group. Results of qRT-PCR. A) Alanyl membrane aminopeptidase (Anpep), the solute carrier family 3, member 2 (Slc3a2) and the solute carrier family 15 member 1 (Slc15a1) were analysed as typical genes involved in the digestion/absorption of amino acids/peptides. B) Liver-type fatty acid binding protein (Fabp1) intestinal type fatty acid binding protein (Fabp2) and apolipoprotein A1 (Apoa1) were analysed as typical genes involved in the absorption of lipids. Relative mRNA expression levels of each gene were normalized by 28s ribosomal RNA levels. Values indicate mean ± SEM (n=5). We performed statistical analyses between different treatment groups with the Student’s t-test. Hash marks indicate significant differences between Sham and TPN groups (##p<0.01). Asterisks indicate significant differences between TPN and each nutrient-administration group (**p<0.01, *p<0.05). Dagger marks indicate significant differences between TPN+LCT and TPN+MCT groups (†p<0.05). Section marks indicate significant differences between TPN+Glu and TPN+Fru groups (§p<0.05).
We further proceeded to analyse three representative genes involved in lipid absorption: the fatty acid binding proteins (Fabp1 and Fabp2), which are involved in the transport and metabolism of fatty acids; and apolipoprotein A1 (Apoa1), the major lipoprotein component of chylomicrons. The mRNA expression levels of these genes were decreased by TPN treatment for 7 days, and Apoa1 mRNA levels were decreased significantly in the TNP group compared with Sham group. Additionally, in the case of the nutrient-administered group, mRNA expression levels of these genes were remarkably higher in the TPN+MCT and TPN+Fru groups versus the TPN+LCT and TPN+Glu groups, respectively (Figure 2B).
Changes in mRNA levels of digestion/absorption of carbohydrate-related genes and disaccharidase activity in TNP group and each nutrient-administered group
We analysed the mRNA levels of several genes related to digestion and absorption of carbohydrates in the small intestine. We analysed two disaccharidases genes, the sucrase-isomaltase complex (Si) and lactase-phlorizin hydrase (Lph); two monosaccharide transporters genes, the sodium-glucose transporter (Sglt1) and facilitated fructose transporter (Glut5); two transcriptional factors, the hepatocyte nuclear factor 1 alpha (Hnf-1α) and caudal type homeobox 2 (Cdx2), which are known to transcribe disaccharidases genes. Although the mRNA expression levels of Si were remarkably decreased in the TPN group, the levels of Lph gene remained unchanged following TPN treatment for 7 days. On the other hand, both expression levels of disaccharidase genes were induced by the administration of each nutrient for 3 days. In particular, Fru administration following TPN treatment significantly induced Si gene expression levels compared with Glu administration. Although the mRNA expression levels of Sglt1 were unchanged in the TPN group, the mRNA expression levels of Glut5 significantly increased inversely. Both Sglt1 and Glut5 mRNA expression levels were significantly increased in each nutrient-administered group, although the marked alterations following specific nutrient administration were not observed. The mRNA expression levels of Hnf-1α and Cdx2 were decreased in the TPN group compared with the Sham group. Both mRNA expression levels were notably induced by nutrient administration following TPN treatment for 7 days. These levels were significantly higher in the TPN+MCT group compared with the TPN+LCT group (Figure 3A).
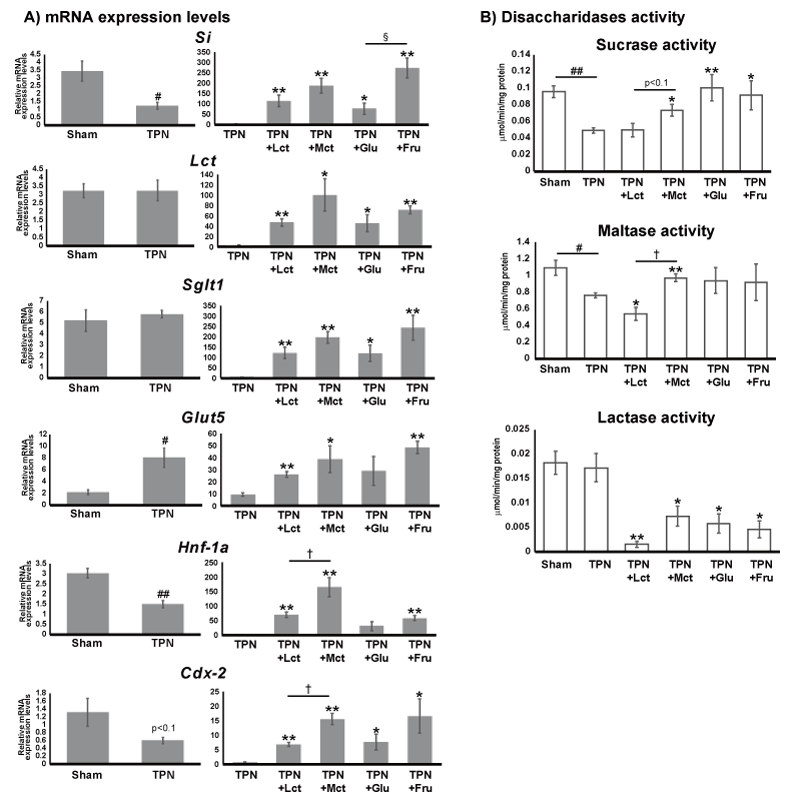
Figure 3. Changes in mRNA levels for digestion/absorption of carbohydrate-related genes and disaccharidase activity between the TNP group and each of the nutrient-administered groups. A) Results of qRT-PCR. Sucrase-isomaltase complex (Si) and lactase-phlorizin hydrase (Lph), sodium-glucose transporter (Sglt1), facilitated glucose transporter (Glut5), hepatocyte nuclear factor 1 alpha (Hnf-1α) and caudal type homeobox 2 (Cdx-2) were analysed as typical genes involved in the digestion/absorption of carbohydrates. Relative mRNA expression levels of each gene were normalized by 28s ribosomal RNA levels. Values indicate mean ± SEM (n=5). B) Measurement of disaccharidases activity, which were normalized by total protein concentration as determined by BCA protein assay. Values indicate mean ± SEM (n=5). We performed statistical analyses between different treatment groups by a Student’s t-test. Hash marks indicate significant differences between Sham and TPN groups (##p<0.01, #p<0.05). Asterisks indicate significant differences between TPN and each nutrient-administration group (**p<0.01, *p<0.05). Dagger marks indicate significant differences between TPN+LCT and TPN+MCT groups (†p<0.05). Section mark indicates significant differences between TPN+Glu and TPN+Fru groups (§p<0.05).
We further proceeded to analyse disaccharidase activity by analysing the activity of representative disaccharidases in the intestinal microvilli, i.e. sucrase, maltase and lactase. The sucrase activity declined in the TPN compared with the Sham group and was significantly increased in the TPN+MCT, TPN+Glu and TPN+Fru groups compared with the TPN group. Maltase activity was significantly lower in the TPN group, similar to sucrase activity. Additionally, MCTs administration after TPN treatment markedly increased maltase activity compared with LCTs administration. On the other hand, lactase activity significantly declined in each nutrient-administration group compared with both the Sham and TPN groups (Figure 3B).
Changes in mRNA levels of genes related to maturing intestinal epithelial cells and other nutrient transport in the TNP group and each nutrient-administered group
We also analysed the mRNA levels of genes related to maturing intestinal epithelial cells and other nutrient transport. The mRNA expression levels of intestinal alkaline phosphatase (Alp-i), which is a known maturation marker of intestinal epithelial cells, were significantly decreased in the TPN group and increased significantly in each nutrient-administered group. In particular, lipid administration induced the Alp-i mRNA expression levels more than carbohydrate administration. The mRNA expression levels of retinol binding protein 2 (Rbp-2), which plays a pivotal role in the transport of retinol in enterocytes, tended to decrease in the TPN group and were significantly increased in each nutrient-administered group, similar to the Alp-i expression pattern. Additionally, the mRNA expression levels of the solute carrier family 16 member 3 (Slc16a3), which is known as monocarboxylate transporter 4, were significantly decreased in the TPN group compared with the Sham group, although the mRNA expression levels of solute carrier family 28 member 1 (Slc28a1), which is a known sodium/nucleoside cotransporter, were not changed in the TPN group. On the other hand, the mRNA expression levels of both Slc16a3 and Slc28a1 were markedly induced by nutrient administration following TPN treatment (Figure 4).
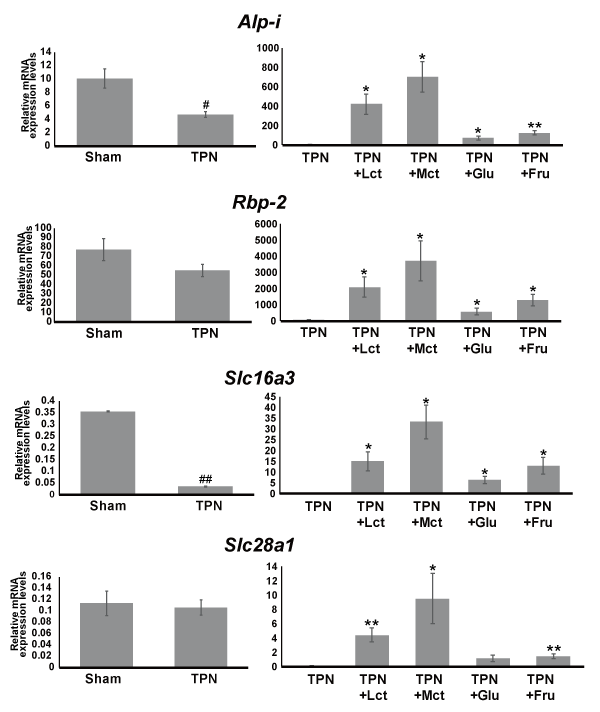
Figure 4. Changes in mRNA levels of genes related to maturing intestinal epithelial cells and other nutrient transport in the TNP group and each nutrient-administered group. Results of qRT-PCR. Intestinal alkaline phosphatase (Alp-i), retinol binding protein 2 (Rbp-2), solute carrier family 16 member 3 (Slc16a3) and solute carrier family 28 member 1 (Slc28a1) were analysed as typical genes involved in intestinal epithelial cells maturation and other nutrient transport. Relative mRNA expression levels of each gene were normalized by 28s ribosomal RNA levels. Values indicate mean ± SEM (n=5). We performed statistical analyses between different treatment groups by a Student’s t-test. Hash marks indicate significant differences between Sham and TPN groups (##p<0.01, #p<0.05). Asterisks indicate significant differences between TPN and each nutrient-administration group (**p<0.01, *p<0.05).
In this study, we revealed that oral administration of a single nutrient to model animals whose intestinal functions were significantly declined by long-term TPN treatment markedly recovered villous morphology and induced the expression of representative genes related to digestion and absorption of nutrients. In particular, it became clear that the administration of Fru as well as MCTs resulted in more remarkable changes compared with the administration of LCTs and Glu.
It is known that when nutrient stimulation from the intestinal tract ceases for a long duration, the villous morphology [6,7], capability to digest and absorb nutrients [8,9], intestinal immunity [10,11], and intestinal barrier functions [12,13] decline overall. Like the results of previous reports, marked atrophy of jejunal villus was confirmed in animals treated with TPN via the jugular vein for 7 days. In addition, expression levels of representative genes involved in nutrient digestion and absorption were significantly decreased following 7 days of TPN treatment. A decrease in the gene expression levels of the sucrase-isomaltase complex - which is represented by disaccharidase and its transcription factors HNF-1α and Cdx-2-was remarkable. The effect was also observed within the measurement of disaccharidase activity, and both sucrase and maltase activities were significantly reduced in the TPN group. In addition, expression levels of genes involved in lipid absorption, differentiation type traits of epithelial cells and substance transport, showed a tendency to decrease in the TPN group. On the other hand, the expression levels of representative genes related to protein and amino acid digestion, as well as absorption, showed no significant change. These results suggest that when nutritional stimuli from the lumen ceases, the digestive capability of carbohydrates and lipids declines preferentially compared with the digestive capability of proteins. However, details concerning digestive and transportation functional priorities declining for each nutrient category should be investigated in the future as also alterations of protein expression levels, as we analyzed only gene expression levels of representative molecules in this study.
As originally hypothesized, when each nutrient was administered orally at 20% of the total energy intake following TPN treatment for 7 days, the expression levels of representative genes related to nutrient digestion and absorption was significantly induced. These results indicated that nutrient stimulation from the luminal side is quite important for stimulation to induce gene expression within intestinal epithelial cells, and intestinal epithelial cells possess the high responsivity against the nutrient stimulation. Interestingly, our data show that even for nutrients belonging to the same nutrient category, the induction effects against mRNA expression differ depending on their chemical structures. In particular, the induction effects for gene expression in small intestinal epithelial cells resulting from MCTs administration was extremely significant, and the expression levels of all genes analyzed in this study were markedly increased. Dietary lipids are absorbed from the intestinal tract even if the intestine exhibits issues [14]. The efficiency of lipid absorption varies depending on the fatty acid chain length. MCTs are absorbed into the small intestinal epithelial cells without the need for bile acids after being digested to medium-chain fatty acids by pancreatic lipase. The incorporated medium-chain fatty acids into intestinal absorptive cells are not only a direct energy source for the cells but are rapidly absorbed into the body via blood from the portal vein as a water-soluble fraction. It is also known that MCTs are transported directly into the blood via the portal vein and become a direct source of energy for intestinal epithelial cells. On the other hand, LCTs are incorporated into absorptive cells as bile acid micelles after degradation by pancreatic lipase. Degraded long-chain fatty acids are re-synthesized into triglycerides within the cells and transferred into the body via lymphatic vessels as a chylomicron. It is speculated that this difference in absorption/metabolism mechanism(s) resulted in the specific action of MCTs on gene expression in small intestinal epithelial cells. Many previous studies, in addition to the data shown here, have demonstrated positive effects of MCTs on intestinal functions. Therefore, MCTs have been used to treat intestinal issues, such as bowel resection and intestinal malabsorption [15,16]. Therefore, this suggests that MCTs should be added with LCTs as lipid sources to elemental diets or EN.
In addition, when monosaccharides were administered, similar to the administration of lipids, differences in the induction of gene expression levels due to changes in chemical structure were observed. The initial expectation was that Glu is more directly useful than Fru as an energy source for small intestinal epithelial cells; it was predicted that Glu was more effective in inducing gene expression in epithelial cells. However, in fact, it was observed that Fru administration induced the expression of representative genes involved in the digestion and absorption of nutrients. From these results, it was suggested that chemical stimulation of Fru present in epithelial cells induces the expression of various genes, independently of the energy supply levels to epithelial cells. Fru, unlike Glu, is incorporated into epithelial cells in a facilitated manner via GLUT5, a specific transporter of Fru. The incorporated Fru is transported to the portal vein in a facilitated manner via GLUT2 that is localised to the basolateral side. Of note, there are genes present in small intestinal epithelial cells that are induced specifically by Fru have also been confirmed and include GLUT5, G6Pase, and others [17-19]. In addition, although Fru transported to the liver via the portal vein is immediately metabolised, it also has a specific effect that includes lipid synthesis enhancement in the liver. Due to this action in the liver, chronic excessive intake of Fru induces NAFLD and ultimately triggers non-alcoholic inflammatory liver disease [2,20]. Worldwide, the focus is on the negative effects of Fru on liver function. However, from the results of this study, it was shown that Fru stimulation can be useful for activating small intestinal epithelial cell functions. Therefore, it is necessary to demonstrate that short-term administration of Fru and that Fru levels in intestinal epithelial cells are important to activate small intestine function via the regulation of gene expression by Fru-stimuli specific.
As a current common guideline, PN is applied in cases when oral nutrition cannot be used, i.e. upper gastrointestinal tract disorders, immediately after digestive surgery, inflammatory bowel disease and malabsorption syndrome. On the other hand, digestive tract functions decline depending on the PN treatment period, and a gradual transition to EN as soon as possible is being encouraged. When recovery of a certain digestive tract function is confirmed, EN is transitioned to a normal diet, but there are individual differences for the transition period. In particular, it expects that the period of habituation in the case of the elderly tends to be longer than that of the young. It may be important to switch to oral nutrition as soon as possible in order to reduce patients’ mental and physical problems. In cases of serious issues for intestinal function during the habituation period, as a first step, an elemental diet should be selected because digestive functions are declining. During this time, it is important to determine what kinds of nutrients are required to efficiently recover the intestinal functions. Therefore, we need to investigate further whether it is useful to employ EN fluid containing MCTs as an additive lipid component and Fru as an additive carbohydrate component as the optimal nutrition for ingestion during the transition phase to EN.
In conclusion, our results indicated that oral administration of MCTs and/or Fru can efficiently improve small intestinal functions, such as digestion and absorption of nutrients as soon as possible following PN treatment. Additionally, we discovered that oral Fru intake after PN may be useful for the recovery of gastrointestinal functions. However, we should investigate additional treatments that elicit similar effects and/or possess a similar chemical structure to Fru, as Fru intake has some negative health outcomes.
We thank Dr. Nakayama and Dr. Yamaoka from Otsuka Pharmaceutical Factory, Inc for their technical support in the establishment of the TPN model. Further, the authors would like to thank Enago (www.enago.jp) for the English language review.
This work was supported by JSPS KAKENHI Grant Numbers JP23700909 and 18K11123, and Mishima Kaium Memorial Foundation Grant 2012.
- Oste M, De Vos M, Van Haver E, Van Brantegem L, Thymann T, et al. (2010) Parenteral and enteral feeding in preterm piglets differently affects extracellular matrix proteins, enterocyte proliferation and apoptosis in the small intestine. Br J Nutr 104: 989-997. [Crossref]
- Abdelmalek MF, Suzuki A, Guy C, Unalp-Arida A, Colvin R, et al. (2010) Increased fructose consumption is associated with fibrosis severity in patients with nonalcoholic fatty liver disease. Hepatology 51: 1961-71. [Crossref]
- Suzuki T, Douard V, Mochizuki K, Goda T, Ferraris RP (2011) Diet-induced epigenetic regulation in vivo of the intestinal fructose transporter Glut5 during development of rat small intestine. Biochem J 435: 43-53. [Crossref]
- Schwartz S, Farriol M, Garcia-Arumi E, Andreu AL, Lopez Hellin J, et al. (1994) Effect of medium chain triglycerides (MCT) on jejunal mucosa mass and protein synthesis. Gut 35: S39-S41. [Crossref]
- Dahlqvist A (1984) Assay of intestinal disaccharidases. Scand J Clin Lab Invest 44: 169-172. [Crossref]
- Buchman AL, Moukarzel AA, Bhuta S, Belle M, Ament ME, et al. (1995) Parenteral nutrition is associated with intestinal morphologic and functional changes in humans. JPEN J Parenter Enteral Nutr 19: 453-60. [Crossref]
- Groos S, Reale E, Hunefeld G, Luciano L (2003) Changes in epithelial cell turnover and extracellular matrix in human small intestine after TPN. J Surg Res 109: 74-85. [Crossref]
- Wildhaber BE, Yang H, Teitelbaum DH (2003) Total parenteral nutrition-induced apoptosis in mouse intestinal epithelium: modulation by keratinocyte growth factor. J Surg Res 112: 144-51. [Crossref]
- Burrin DG, Stoll B, Chang X, Van Goudoever JB, Fujii H, et al. (2003) Parenteral nutrition results in impaired lactose digestion and hexose absorption when enteral feeding is initiated in infant pigs. Am J Clin Nutr 78: 461-70. [Crossref]
- Ganessunker D, Gaskins HR, Zuckermann FA, Donovan SM (1999) Total parenteral nutrition alters molecular and cellular indices of intestinal inflammation in neonatal piglets. JPEN J Parenter Enteral Nutr 23: 337-44. [Crossref]
- Wildhaber BE, Yang H, Spencer AU, Drongowski RA, Teitelbaum DH (2005) Lack of enteral nutrition--effects on the intestinal immune system. J Surg Res 123: 8-16. [Crossref]
- Sun X, Yang H, Nose K, Nose S, Haxhija EQ, et al. (2008) Decline in intestinal mucosal IL-10 expression and decreased intestinal barrier function in a mouse model of total parenteral nutrition. Am J Physiol Gastrointest Liver Physiol 294: G139-G147. [Crossref]
- Yang H, Feng Y, Sun X, Teitelbaum DH (2009) Enteral versus parenteral nutrition: effect on intestinal barrier function. Ann N Y Acad Sci 1165: 338-346. [Crossref]
- Jeppesen PB, Mortensen PB (1998) The influence of a preserved colon on the absorption of medium chain fat in patients with small bowel resection. Gut 43: 478-483. [Crossref]
- Gracey M (1974) The use of medium-chain triglyceride in children with intestinal malabsorption. Paediatr Indones 14: 113-117.
- Vanderhoof JA, Grandjean CJ, Kaufman SS, Burkley KT, Antonson DL (1984) Effect of high percentage medium-chain triglyceride diet on mucosal adaptation following massive bowel resection in rats. JPEN J Parenter Enteral Nutr 8: 685-689. [Crossref]
- Shu R, David ES, Ferraris RP (1997) Dietary fructose enhances intestinal fructose transport and GLUT5 expression in weaning rats. Am J Physiol 272: G446-G453. [Crossref]
- Kishi K, Tanaka T, Igawa M, Takase S, Goda T (1999) Sucrase-isomaltase and hexose transporter gene expressions are coordinately enhanced by dietary fructose in rat jejunum. J Nutr 129: 953-956. [Crossref]
- Cui XL, Soteropoulos P, Tolias P, Ferraris RP (2004) Fructose-responsive genes in the small intestine of neonatal rats. Physiol Genomics 18: 206-217. [Crossref]
- Nomura K, Yamanouchi T (2012) The role of fructose-enriched diets in mechanisms of nonalcoholic fatty liver disease. J Nutr Biochem 23: 203-208. [Crossref]