Background/Objective:Myricetin, a flavonoid compound, is widely diffused in vegetables, fruits and beverages, well known for its antioxidant and anti-inflammatory properties. The present study was aimed to investigate the acute effects of myricetin on the pial microvascular alterations and oxygen-derived free radical formation, due to 30 min cerebral blood flow lowering (CBFL) and subsequent cerebral blood flow resumption (CBFR).
Methods:Rat pial microvasculature was investigated using fluorescence microscopy through a closed cranial window. At first, arterioles were classified according to the Strahler’s ordering scheme. Then, arteriolar diameter, permeability increase, leukocyte adhesion to venular walls, perfused capillary length (CPL) and red blood cell velocity (VRBC) were quantified by computerized methods. Finally, reactive oxygen species (ROS) production was investigated in vivo by 2′-7′-dichlorofluorescein-diacetate assay and infarct size by 2,3,5-triphenyltetrazolium chloride staining.
Results:After 30 min CBFL and 60 min CBFR, a decrease of arteriolar diameter, CPL and VRBC was detected; furthermore, increases in microvascular leakage and leukocyte adhesion were observed in hypoperfused animals. Conversely, myricetin administration induced dose-related arteriolar dilation, reduction in microvascular permeability as well as leukocyte adhesion when compared to those detected in bilateral common carotid artery occlusion-submitted animals; moreover, CPL and VRBC were preserved. In animals treated with myricetin the ROS production was blunted and infarct size significantly reduced.
Conclusion:In conclusion, myricetin acute administration showed dose-related protective effects on rat pial microcirculation during CBFL and subsequent CBFR, inducing arteriolar dilation and inhibiting ROS formation, consequently preserving the blood brain barrier integrity.
Hypoperfusion-reperfusion, Myricetin, Nitric oxide, Rat pial microcirculation, Reactive oxygen species
Emerging research provides substantial evidence to classify food rich in flavonoids and polyphenols as functional food with several preventive and therapeutic health benefits. Flavonoids are natural compounds widely diffused in nature and characterized by several phenolic structures [1,2]. They are responsible for the colors in the skins of fruits and vegetables and are abundant also in tea and wine [3-5]. Many Authors focused the attention on the biological properties of these natural molecules, suggesting their protective role against coronary heart disease and mortality [6]. Flavonoids can be classified according to their molecular structure as flavones, flavanones, catechins and anthocyanins and are all characterized by a strong antioxidant capacity [7]. In particular, many studies suggest that flavones and catechins show stronger scavenger activity compared to others [8]. Among flavones, myricetin, a molecule diffused and abundant in berries, vegetables, teas and wines, manifests interesting antioxidant, anti-inflammatory and anticancer properties [9,10] and is well recognized for its nutraceuticals value. The strong scavenger activity of myricetin was previously documented; Rusak, et al. showed that this compound was able to counteract the 1,1′-diphenyl-2-picrilhydrazyl (DPPH) radicals [11], while Husain, et al. demonstrated it was able to scavenge hydroxyl (.OH) radicals generated by UV photolysis of hydrogen peroxide [12]. Moreover, myricetin inhibits liposomes peroxidation [13] and its antioxidant properties appeared higher than Vitamin E (d-α-tocopherol) [14]. Tzeng, et al. showed that this flavonoid inhibits platelet aggregation in rabbits and this ability may be due to the inhibition of thromboxane formation [15]. The mechanism of anti-aggregating activity appeared related to the inhibition of phosphodiesterase activity [16]. A recent work indicated that a myricetin pretreatment, 25 or 50 mg/kg b.w., reduced rat intestinal ischemia-reperfusion injury [17]. On the other hand, epidemiological evidence indicates that the polyphenols have a protective effect against some chronic diseases [18]. They play an important role in human nutrition and are endowed with numerous biological properties, such as antioxidant activity [19], anti-tumor, anti-atherosclerotic, anti-inflammatory, hepatoprotective, anti-bacterial and anti-replicative for HIV [20]. Therefore, the aim of the present study was to in vivo assess the effects of myricetin on cerebral microvascular alterations caused by hypoperfusion and reperfusion in rat. We investigated the acute effects induced by myricetin on pial microcirculation in rats submitted to 30 min of cerebral blood flow lowering (CBFL) and 60 min of cerebral blood flow resumption (CBFR).
Experimental groups
Experiments were carried out utilizing male Wistar rats, 250–300g (Harlan, Italy), randomly assigned to three groups: (1) sham group (SH group), subjected to the same surgical procedure of the other experimental groups without changes in cerebral blood flow; (2) reduced blood flow group (RF group) and (3) myricetin-treated group (M group) underwent 30 min CBFL plus 60 min CBFR.
- SH animals were divided in subgroups:
- SH-Na subgroup (n=14) was injected with intravenous (i.v.) saline solution (0.9% NaCl);
- SH-M subgroup (n=14), successively divided in SH-M1 (n=7) and SH-M2 (n=7) subgroups, received i.v. myricetin, 10 mg/kg body weight (b.w.) and 35 mg/kg b.w., respectively;
- SH-L subgroup (n=5) was infused with i.v. N5-(1-iminoethyl)-L-ornithine (L-NIO), 10 mg/kg b.w.
- The animals of each subgroup received the substances twice within 40 min interval.
- RF group (n=14) was injected with i.v. saline solution (0.9% NaCl), 10 min before the
CBFL and at the beginning of CBFR.
- M group was differentiated in the following subgroups: (a) M1 (n=14) and M2 (n=14), administered with i.v. myricetin, 10 mg/kg b.w. or 35 mg/kg b.w., respectively, 10 min before the CBFL and at the beginning of CBFR; (b) L/M2 subgroup (n=14) was administered with i.v. L-NIO, 10 mg/kg b.w., prior to i.v. higher dosage myricetin (35 mg/kg b.w.).
Five animals for SH-Na subgroup, RF and M2 group were investigated by in vivo fluorescence microscopy, to detect microcirculation damage; six rats were utilized to assess oxidative stress by Dichloro-dihydro-fluorescein diacetate (DCFH-DA) assay after CBFL (n=3) and after CBFR (n=3); in three animals tissue damage was evaluated by TTC staining. The rats belonging to the SH-M2 and SH-L subgroups were utilized only for microcirculation investigations.
Drug administration
Each utilized drug (myricetin or L-NIO) was dissolved in 0.5 mL saline solution and, successively, i.v. injected to rats within 3 min, 10 min before CBFL and at the beginning of CBFR. We tested the effects of two different dosages of myricetin: 10 or 35 mg/kg b.w. The choice of the dosages derived from pilot experiment results indicating that myricetin dosages less than 10 mg / kg b.w. were ineffective on the pial microvasculature. On the other hand, dosages higher than 35 mg/kg b.w. did not improve microvascular protection detected in the animals administered with 35 mg/kg b.w myricetin before and after CBFL.
Finally, L-NIO, known to inhibit the NO release, was administered at the dosage of 10 mg/kg b.w., 10 min before i.v. infusion of the higher myricetin dosage (35 mg/kg b.w.) [21,22]. To test the right dosage of L-NIO, pilot experiments were performed where the intravenous administration L-NIO, at the dosage of 10 mg/kg b.w., was able to impede arteriolar dilation caused by i.v. injection of 10 mg/4 min L-arginine (diameter increase by 22.8 ± 2.0%, compared to basal values) or abolish the vasodilation due to topical administration of 100 μM acetylcholine (diameter increase by 5.0 ± 1.5%, compared to basal values). The protocol of drug administration was previously described [23]. Appropriately mixing 2′-7′-dichlorofluorescein-diacetate (DCFH-DA) and artificial cerebrospinal fluid (aCSF) allowed us to superfuse the pial layer with 250 mM DCFH-DA solution for 30 min after CBFL [24,25]. Sigma Chemical, St. Louis, MO, USA supplied all drugs.
Rat preparation
All experiments conform to the Guide for the Care and Use of Laboratory Animals published by the US National Institutes of Health (NIH Publication No. 85-23, revised 1996) and to institutional rules for the care and handling of experimental animals, as previously reported [22]. The protocol was approved by the Committee on the Ethics of Animal Experiments of the University of Pisa and Italian Health Ministry (Permit Number: 156/2017-PR).
Rats were anesthetized with intraperitoneal (i.p.) injection of α-chloralose, (60 mg/kg b.w. for induction; afterward 30 mg/kg b.w. for maintenance) and mechanically ventilated after tracheotomy, according to the protocol previously reported [22]. Two catheters were placed, one in the right femoral artery and the other in the left femoral vein, respectively, for the measurement of arterial blood pressure and to inject the fluorescent tracers [fluorescein isothiocyanate bound to dextran, molecular weight 70 kDa (FD 70), 50 mg/100 g b.w., as 5% wt/vol solution in 3 min just once at the start of experiment after 30 min of the preparation stabilization; rhodamine 6G, 1 mg/100 g b.w. in 0.3 mL, as a bolus with supplemental injection throughout CBFL and CBFR (final volume 0.3 mL·100 g−1·h−1) to label leukocytes for adhesion evaluation]. Both carotid arteries were prepared for clamping.
Blood gases were measured on arterial blood samples at 30 min intervals (ABL5; Radiometer, Copenhagen, Denmark). The parameters monitored in all animals were: heart rate, mean arterial blood pressure, respiratory CO2 and blood gases values. They were stable within physiological ranges. Rectal temperature was recorded and maintained at 37.0 ± 0.5°C, as previously reported [23].
The visualization of pial microvasculature was carried out as previously reported [14,22,26]. A closed cranial window was positioned at the level of the left frontoparietal cortex through an incision in the skin to operate a craniotomy. Cerebral cortex was preserved by overheating caused by drilling with saline solution superfusion of the skull. The dura mater was gently cut and displayed on the corner; a quarz microscope coverglass was bound to the skull bone. Artificial cerebrospinal fluid was superfused on the cerebral surface with a rate of 0.5 mL/min. The composition of the aCSF was 119.0 mM NaCl, 2.5 mM KCl, 1.3 mM MgSO4•7H2O, 1.0 mM NaH2PO4, 26.2 mM NaHCO3, 2.5 mM CaCl2 and 11.0 mM glucose (equilibrated with 10.0% O2, 6.0% CO2 and 84.0% N2; pH 7.38 ± 0.02).
The lowering in cerebral blood flow (CBFL) was produced by clamping both common carotid arteries, previously prepared. The clamping was removed after 30 min; thereafter, the pial microvasculature was investigated during the resumption of cerebral blood flow (CBFR), lasting 60 min [27].
Fluorescence microscopy
A fluorescence microscope was utilized to study pial microvascular networks as previously described [22]. In brief, the microscope (Leitz Orthoplan, Wetzlar, Germany) was equipped with long-distance objectives (2.5 x, numerical aperture (NA) 0.08; 10 x, NA 0.20; 20 x, NA 0.25; 32 x, NA 0.40) a 10x eyepiece. Moreover, a x10 eyepiece and a filter block (Ploemopak, Leitz) were used. A 100-Watt mercury lamp was used for epiillumination with the corresponding filters for FITC and rhodamine 6G. A heat filter prevented overheating of the preparations (Leitz KG1). Pial microvascular networks were televised with a DAGE MTI 300 low-light level camera and stored through a computer-based frame grabber (Pinnacle DC 10 plus, Avid Technology, Burlington, MA, USA).
Geometric detection of microvascular network
In each animal, first we characterized the arteriolar network by stop-frame images and pial arterioles were assigned order according to Strahler's method, starting from capillaries to the largest arterioles (centripetal method), as previously reported [28,29]. In each experiment we studied one order 4 arteriole, two order 3 and two order 2 arterioles. Furthermore, we assessed the functional changes of each arteriolar order under the experimental conditions. We report, however, the results detected in order 3 arterioles.
Microvascular parameter assessment
Microvascular parameters were measured off-line utilizing a computerized imaging technique, previously described in details by Lapi, et al. [22,23]. Concisely, arteriolar diameters were measured with a computerized method, Microvascular Imaging Program (MIP), frame by frame. The increase in permeability was measured by evaluating fluorescent dextran extravasation from venules and expressed as normalized gray levels (NGL): NGL = (I – Ir)/Ir, where Ir is the baseline gray level at the microvasculature filling with fluorescence, and I is the value at the end of CBFL or CBFR. Gray levels were obtained using the MIP image program by average of 5 windows, measuring 50 × 50 mM (10x objective) and located outside the venules. During recordings the same regions of interest were localized by a computer-assisted device for XY movement of the microscope table.
Leukocytes sticking to the vessel walls (45 venules for every group) over a 30-s time-period were reported as number of adherent cells/100 μm of venular length (v.l.)/30 s, utilizing appropriate magnification (20 x and 32 x, objectives) [22]. Perfused capillaries were evaluated as the length of the capillaries showing blood flow (CPL), assessed by MIP image in an area of 150 × 150 μm [23,24].
A Gould Windograf recorder (model 13-6615-10S, Gould, OH, USA) was utilized to record arterial blood pressure (mean), by Viggo-Spectramed P10E2 transducer; Oxnard, CA, USA, linked to catheterized femoral artery, and heart rate, as previously reported (Lapi, et al., 2012). We measured the arterial blood gases (ABL5; Radiometer, Copenhagen, Denmark) at 30 min intervals, as previously reported [22,30], as well as the hematocrit in basal conditions, at the end of CBFL and CBFR.
ROS production evaluation
Superfusion of the pial layer with artificial cerebrospinal fluid, containing 250 mM 2′-7′-dichlorofluorescein-diacetate (DCFH-DA) at 37.0 ± 0.5°, was carried out after 30 min CBFL (n=3) or 60 min CBFR (n=3), as previously reported [22]. DCFH-DA is widely used as a marker for oxidative stress of the cells and tissues [31]. DCF fluorescence intensity, related to the intracellular ROS level, was assessed using an appropriate filter (522 nm) and measured by NGL [25].
Tissue damage estimation
At the end of CBFR, rats were sacrificed to evaluate tissue damage. The brains were isolated and rostro-caudally cut into coronal sections (1 mm) with a vibratome (Campden Instrument, 752 M; Lafayette, IN, USA). Slices were incubated in 2% 2,3,5-triphenyltetrazolium chloride (TTC) (20 min) at 37 °C and in 10% formalin overnight, as previously reported [22]. TTC, a white salt, is reduced to red 1,3,5-triphenylformazan by dehydrogenases in living cells. The location and extent of necrotic areas were assessed by computerized image analysis (Image-Pro Plus; Rockville, MD, USA). Moreover, the infarct size was quantified by manual measurements, according to the following formula: [(area of nonhypoperfused, or area not subjected to cerebral blood flow lowering, cortex or striatum–area of remaining hypoperfused, or area subjected to cerebral blood flow lowering, cortex or striatum)/area of nonhypoperfused cortex or striatum] × 100 [32].
Western blotting
Bio-Rad protein assay (Bio-Rad, Berkeley, CA, USA) was utilized to evaluate the protein concentration. Equal amounts of proteins were separated by SDS-PAGE under reducing conditions and then transferred to PVDF (Invitrogen, Carlsbad, CA, USA). Successively, the immunoblot was blocked, incubated with specific antibodies at 4 °C overnight, washed and then incubated for one hour with horseradish peroxidase-conjugated secondary antibody (1:2000) (GE-Healthcare, Little Chalfont, UK). By enhanced chemiluminescence system (GE-Healthcare) was evaluated the peroxidase activity. The optical density of the bands was determined by the ChemiDoc Imaging System (Bio-Rad) and normalized to the optical density of α-Tubulin (1:5000). Finally, the protein of interest was detected by specific antibodies: rabbit polyclonal anti-eNOS (1:500) and rabbit polyclonal anti phosphorylated e NOS (Ser 1177) (1:200) (Santa Cruz, CA, USA).
Statistical analysis
All data were reported as mean ± SEM. Normal distribution of data was assessed with the Kolmogorov-Smirnov test. Parametric (Student's t-tests, ANOVA and Bonferroni post hoc test) or nonparametric tests (Wilcoxon, Mann-Whitney and Kruskal-Wallis tests) were utilized, according to data distribution; diameter and length data among experimental groups were compared with nonparametric tests, as previously reported [23]. Data derived from DCFH-DA treated rats were analyzed with non-parametric tests. SPSS 14.0 statistical package (IBM Italia, Segrate, MI, Italy) was used. Statistical significance was set at p < 0.05.
Pial microvascular networks were classified, under baseline conditions, according to the Strahler's method, as previously described [29]. Arterioles were classified in five orders; order five was assigned to the largest vessels (average diameter 60.8 ± 4.5 μm; average length: 1157 ± 212 μm, n= 88), the following were assigned decreasing orders up to the smaller arterioles of order 1 with an average diameter of 17.0 ± 2.3 μm and average length of 146 ± 58 μm (n=163); finally, order 0 was assigned to the capillaries that sprout from order 1 arterioles. The diameters and length were significantly different among the different orders (p<0.01).
SH group
At the end of observations, the animals belonging to the SH-Na subgroup did not show significant differences compared with the baseline conditions in microvascular parameters; moreover, we did not detect changes in fluorescence intensity after the DCFH-DA superfusion (Table 1).
Table 1. Changes of the microvascular parameters in S subgroups: SH-M1 (myricetin, 10 mg/kg b.w.), SH-M2 (myricetin, 35 mg/kg b.w.) and SH-L (L-NIO, 10 mg/kg b.w.)
S subgroups |
Number of rats (n) |
Microvascular leakage (NGL) |
Leukocyte adhesion (number of leukocyte/100 μm of v.l./30 sec) |
Capillary perfusion (% reduction compared to baseline) |
SH-Na |
14 |
0.03 ± 0.01 |
1.5 ± 0.2 |
2 ± 1.5 |
SH-M1 |
5 |
0.05 ± 0.02 |
2 ± 0.2 |
0 ± 3 |
SH-M2 |
5 |
0.03 ± 0.01 |
1 ± 0.5 |
0 ± 3 |
SH-L |
5 |
0.04 ± 0.02 |
1 ± 0.3 |
0 ± 3 |
The same behavior was observed in the rats treated with myricetin (at the dose 10 or 35 mg/kg b.w.) (SH-M1 and SH-M2 subgroup, respectively) as well as in the animals treated with L-NIO (SH-L subgrouo) (Table 1).
RF group
Thirty minutes of hypoperfusion induced a reduction in diameter of all arteriolar orders. In particular, order 3 arteriolar diameter decreased by 17.2 ± 1.5% of baseline (p < 0.01 vs. baseline and SH-Na subgroup) (Figure 1). Fluorescent spots along venular walls were detected, showing an increased microvascular permeability (NGL: 0.21 ± 0.02; p < 0.01 vs. baseline and SH-Na subgroup) (Figure 2). At the end of CBFR, all arteriolar orders showed a significant reduction in diameter (order 3 arterioles constricted by 20.1 ± 1.7% of baseline; p < 0.01 vs. baseline and SH-Na subgroup) (Table 2, Figure 1). Furthermore, a marked microvascular permeability was observed along venules (NGL: 0.40 ± 0.03; p < 0.01 vs. baseline and SO-Na subgroup) as well as a significant increase in leukocyte adhesion (10 ± 2/100 μm v.l./30 s; p < 0.01 vs. baseline and SH-Na subgroup) (Table 2, Figures 2, 3A, 3B and 4). The capillary perfusion was markedly compromised (CPL: - 43 ± 5% of baseline; p< 0.01 vs. baseline and SH-Na subgroup) (Table 2, Figure 5). Fluorescence intensity due to ROS formation was pronounced (NGL: 0.35 ± 0.02; p < 0.01 vs. SH-Na subgroup) (Table 2, Figure 6).
Table 2. Changes of the microvascular parameters in SH-Na subgroup, hypoperfused (RF) group, myricetin (M1) subgroup (10 mg/kg b.w.), myricetin (M2) subgroup (35 mg/kg b.w.) and L-NIO (10 mg/kg b.w.) and myricetin (35 mg/kg b.w.) (L-M2) group
Groups |
Number of rats (n) |
Microvascular leakage
(NGL) |
Leukocyte adhesion
(number of leukocyte/100 μm of v.l./30 sec) |
Capillary perfusion
(% reduction compared to baseline) |
SH-Na |
14 |
0.03 ± 0.01 |
1.5 ± 0.2 |
2 ± 1.5 |
RF |
14 |
0.40 ± 0.03°^ |
10 ± 2°^ |
43 ± 5°^ |
M1 |
14 |
0.20 ± 0.03°^* |
5 ± 1°^* |
30.5 ± 3.8°^* |
M2 |
14 |
0.14 ± 0.01°^* |
3 ± 1°^* |
15.0 ± 3.5°^* |
L-M2 |
14 |
0.17 ± 0.03°^* |
2 ± 1* |
18.5 ± 3.3°^* |
°p<0.01 vs. baseline, ^p<0.01 vs. SH-Na subgroup, *p<0.01 vs. RF group
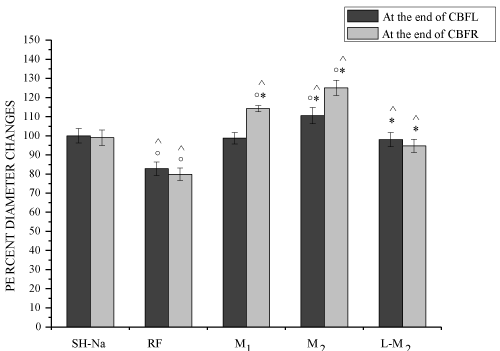
Figure 1. Order 3 arteriolar diameter changes in each experimental group. Diameter changes were expressed in percent of baseline at the end of CBFL and of CBFR in SH-Na = Sham-operated subgroup: RF = hypoperfused group, M1=myricetin subgroup (10 mg/ kg b.w.), M2 = myricetin subgroup (35 mg/kg b.w.), L/M2 = L-NIO (10 mg/kg b.w.) and myricetin (35 mg/kg b.w.) group.
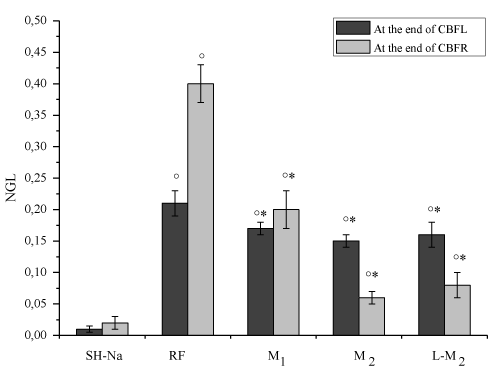
Figure 2. Permeability increase after hypoperfusion (CBFL) (left) and reperfusion (CBFR) (right) in the experimental groups: SH-Na=Sham-operated subgroup: RF = hypoperfused group, M1 = myricetin subgroup (10 mg/kg b.w.), M2 = myricetin subgroup (35 mg/kg b.w.), L/M2 = L-NIO (10 mg/kg b.w.) and myricetin (35 mg/kg b.w.) group. In SH-Na subgroup, data were evaluated at 45 and 75 min of observation.
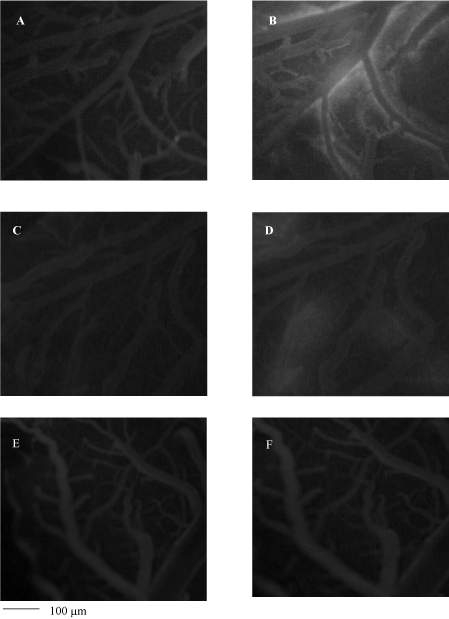
Figure 3. Images of pial microvascular network detected by a computer-assisted software. In A and in B pial microvascular network in baseline conditions and at the end of CBFR, respectively. The increased in microvascular leakage is marked in the interstitium that changed color from black at white. In C and in D pial microvascular network in baseline conditions and at the end of CBFR in a myricetin treated-rat (10 mg/kg b.w.), respectively; In E and in F pial microvascular network in baseline conditions and at the end of CBFR in a myricetin treated-rat (35 mg/kg b.w.), respectively; where the microvascular leakage is absent. -100 μm scale bar
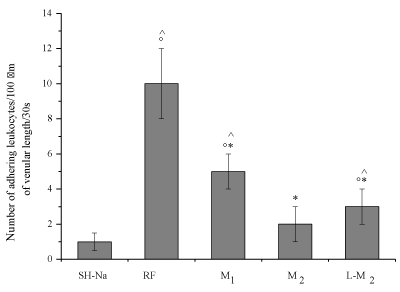
Figure 4. Number of leukocyte adhesion to venular walls at the end of reperfusion in the experimental groups: SH-Na = Sham-operated subgroup: RF = hypoperfused group, M1 = myricetin subgroup (10 mg/kg b.w.), M2 = myricetin subgroup (35 mg/kg b.w.), L/M2 = L-NIO (10 mg/kg b.w.) and myricetin (35 mg/kg b.w.) group.
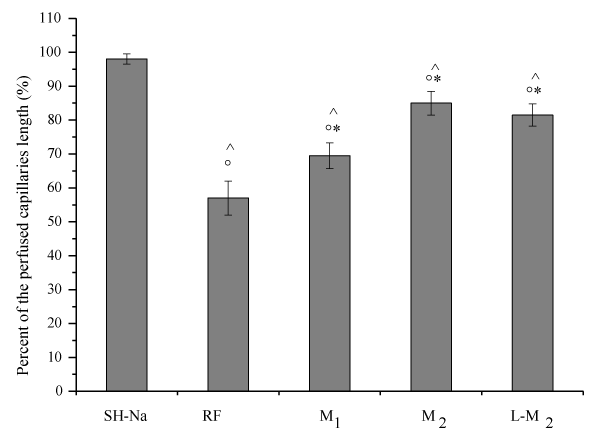
Figure 5. Percentage of the length of perfused capillaries at the end of reperfusion in the different experimental groups: SH-Na = Sham-operated subgroup: RF = hypoperfused group, M1 = myricetin subgroup (10 mg/kg b.w.), M2 = myricetin subgroup (35 mg/kg b.w.), L/M2 = L-NIO (10 mg/kg b.w.) and myricetin (35 mg/kg b.w.) group.
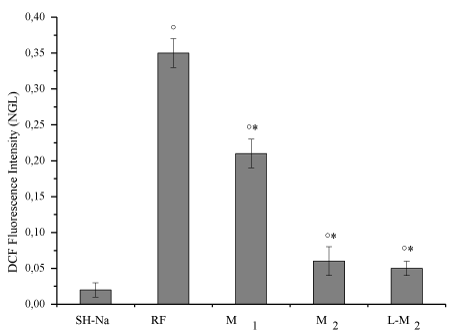
Figure 6. Changes in the intracellular ROS levels detected by variations in DCF fluorescence intensity at the end reperfusion in the different experimental groups: SH-Na = Sham-operated subgroup: SH-Na = Sham-operated subgroup: RF = hypoperfused group, M1 = myricetin subgroup (10 mg/kg b.w.), M2 = myricetin subgroup (35 mg/kg b.w.), L/M2 = L-NIO (10 mg/kg b.w.) and myricetin (35 mg/kg b.w.) group.
M group
Rats treated with 10 mg/kg b.w. myricetin (M1 subgroup) did not show significant changes in arteriolar diameter at the end of CBFL, compared to baseline conditions (Figure 1). Moreover, microvascular permeability was significantly reduced compared to RF group (NGL: 0.17 ± 0.02; p < 0.01 vs. baseline, SH-Na subgroup and RF group) (Figure 2).
At the end of CBFR, we observed a significant dilation of all pial arterioles. Order 3 arterioles dilated by 14.2 ± 1.6% of baseline (p < 0.01 vs. baseline, SH-Na subgroup and RF group) (Table 2, and Figure 1). Microvascular leakage was 0.20 ± 0.03 NGL (p < 0.01 vs. baseline, SH-Na subgroup and RF group) (Figure 2 and Figure 3C and 3D) and the average number of leukocytes adhering to venular walls was 5 ± 1/100 μm v.l./30 s (p < 0.01 vs. baseline, SH-Na subgroup and RF group) (Figure 4). Perfused capillary length was reduced by 35.5 ± 3.8% (p < 0.01 vs. baseline, SH-Na subgroup and RF group) (Figure 5). On the other hand, NGL related to DCF fluorescence intensity were 0.21 ± 0.02 (p < 0.01 vs. baseline, SH-Na subgroup and RF group) (Figure 6). In M2 subgroup (rats treated with 35 mg/Kg b.w.) pial arterioles significantly dilated (10.5 ± 1.6% of baseline, in order 3 arterioles) at the end of CBFL, compared to baseline and RF group (p < 0.01 vs. baseline, SH-Na subgroup and RF group) (Figure 1). The microvascular leakage did not change compared to M1 subgroup (NGL: 0.15 ± 0.01; p < 0.01 vs. baseline, SH-Na subgroup, RF group) (Figure 2). After 60 min of CBFR, we observed an important vasodilation (order 3 arterioles dilated by 25.0 ± 2.0% of baseline; p < 0.01 vs. baseline, SH-Na subgroup, RF group) (Table 2 and Figure 1). Moreover, microvascular leakage, leukocyte adhesion and ROS formation were prevented compared with RF group as well as the reduction in capillary perfusion (Table 2, Figure 2, Figure 3E and 3F, Figure 4, Figure 5 and Figure 6).
In animals treated with L-NIO (10 mg/kg b.w.) 10 min before myricetin infusion at the highest dose (with L-M2 subgroup) at the end of CBFL, a diameter reduction by 2.0 ± 1.5% of baseline in order 3 arterioles (p < 0.01 vs. RF group and M2 subgroup) was observed (Figure 1). Microvascular leakage decreased compared with RF group (NGL: 0.16 ± 0.03; p < 0.01 vs. RF group) (Figure 2).
At the end of CBFR, order 3 arterioles constricted by 5.3 ± 1.2% of baseline (p < 0.01 vs. RF group and M2 subgroup) (Table 2 and Figure 1). On the other hand, L-NIO did not reduce myricetin protective effects on microvascular permeability, leukocyte adhesion and ROS formation (Figure 2, Figure 4 and Figure 6), while CPL decreased by 31.5 ± 3.3% of baseline (p < 0.01 vs. RF group) (Table 2 and Figure 5).
No significant changes in MABP, heart rate, respiratory CO2 and blood gases were detected among the different subgroups under baseline conditions, at the end of CBFL and CBFR.
2,3,5-triphenyltetrazolium chloride (TTC) staining
Thirty minutes of CBFL and 60 min CBFR caused a significant damage in cerebral cortex and striatum of animals belonging to RF group (p < 0.01 vs. SO-Na subgroup, Figure 7A). The cortex infarct size was 6.5 ± 1.3% (p < 0.01 vs. nonhypoperfused cortex), while the extension of damage appeared particularly marked in the striatum (33.2 ± 2.5 %, p < 0.01 vs. nonhypoperfused cortex). Myricetin i.v. infused at the lower dosage slightly preserved the neuronal tissues from the damage induced by CBFL and CBFR (Figure 7B). The infarct size in the cortex was 3.5 ± 1.0% (p < 0.01 vs. nonhypoperfused cortex and RF group) while in the striatum was 20.5 ± 1.8% (p < 0.01 vs. nonhypoperfused cortex and RF group). On the other hand, myricetin administered at the higher dosage, significantly protected neuronal tissues from the hypoperfusion and reperfusion injury (Figure 7C). The infarct size, indeed, was 12.4 ± 1.5% in the striatum (p < 0.01 vs. hypoperfused striatum, M1 subgroup and RF group), while cerebral cortex appeared entirely protected (Figure 7C).
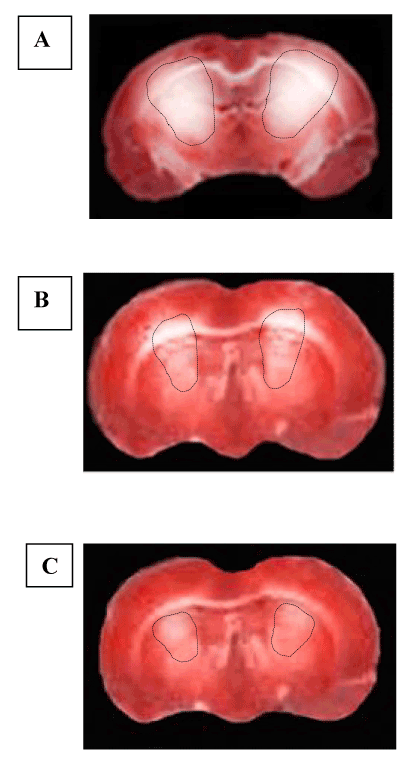
Figure 7. Images of the TTC staining of coronal brain slice. In A coronal brain slice of a rat submitted to CBFL and CBFR, the lesion in the cortex and striatum is delineated by the dashed black line. In B coronal brain slice of a rat treated with low dose myricetin (10 mg/ kg b.w.) where it is possible to observe a modest reduction of the lesion area.
eNOS protein expression
At the end of CBFR, in animals treated with myricetin at higher dosage we observed a significant increased of eNOS protein concentration by western blot analysis compared to RF group and SO-Na subgroup. In particular, the eNOS expression was higher in the cortex than in the striatum; the total and phosphorylated eNOS proteins increased to the same extent (Figure 8).
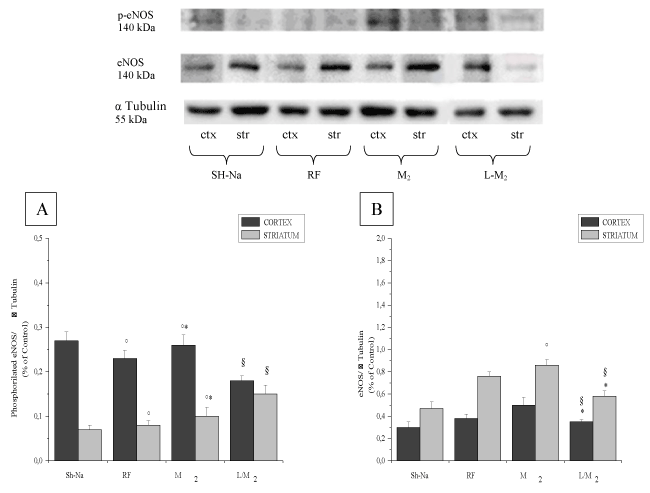
Figure 8. Western blotting of endothelial NO synthase (eNOS; A) phosphorylated eNOS (B) expression in two cerebral zone: cortex (ctx) and striatum (str) at the end reperfusion in the different experimental groups: SH-Na = Sham-operated subgroup: SH-Na = Sham-operated subgroup: RF = hypoperfused group, M2 = myricetin subgroup (35 mg/kg b.w.) and L/M2 = L-NIO (10 mg/kg b.w.) and myricetin (35 mg/kg b.w.) group.
Several experimental results indicate that the hypoperfusion and reperfusion injury is a common feature of ischemic stroke, which occurs when blood supply is restored after a period of ischemia. The spontaneous reperfusion that occurs after hypoperfusion, despite the beneficial effect of restored oxygen supply, also causes deleterious effects that include oxidative stress, leukocyte
infiltration, platelet adhesion and aggregation, complement activation, mitochondrial mediated mechanisms and blood-brain barrier disruption, ultimately leading to edema or hemorrhagic transformation in the brain [33-35]. Recently, against ischemia and reperfusion several studies have been focused on the fundamental role of antioxidant substances [24,36]. We have studied for the first time the effects of myricetin on damages induced by hypoperfusion and reperfusion on rat pial microcirculation, utilizing as experimental model the transient bilateral common carotid artery occlusion [37]. Although their numerous protective effects widely reported, myricetin (or flavonoids) have been poorly studied and few authors have analyzed the effects of hypoperfusion and reperfusion, showing often conflicting results [33]. The effects of myricetin have been detected in rat models of intestinal ischemia and reperfusion, demonstrating that the pretreatment with myricetin induced selective protection without affecting corresponding normal controls; moreover, p-MKK7 has been shown to be the key target in the protective actions [16]. Using the experimental model of permanent occlusion of the rat middle cerebral artery, myricetin exhibited marked effects by reducing ischemic cerebral injury; this protection may be associated to the reduction in the expression levels of IL-1β, IL-6, TNF-α, decrease in MDA (malondialdehyde) test and to the increase in GSH/GSSG ratio and SOD activity [38]. However, no data were reported on the direct effects of myricetin on smaller cerebral arterioles, representing the main site of the blood flow regulation in the capillary networks. We demonstrate, for the first time, that myricetin was able to counteract the microvascular changes induced by hypoperfusion and reperfusion in a dose-dependent manner. The administration of myricetin not only preserved the arteriolar diameter at the end of hypoperfusion, but also induced a dose-dependent vasodilatation, involving the small arterioles responsible for regulation of the capillary blood flow after 60 minutes of reperfusion. Moreover, it was observed a significant reduction in microvascular permeability and ROS formation that represent the key mechanisms of damage, induced by reperfusion. These results underline the protective effect of this antioxidant
drug on the blood brain-barrier. It is possible to suggest that the role of this drug is likely linked to the scavenger action against reactive oxygen species. Moreover, myricetin was able to prevent the adhesion of leukocyte to the venular walls and to preserve the capillary perfusion. In order to clarify the mechanism of action triggered by myricetin to induce vasodilation, L-NIO, a specific inhibitor of the eNOS, has been infused before the injection of higher-dose myricetin. In these rats, the vasodilation was completely abolished. Therefore, it is possible to hypothesize that myricetin stimulates eNOS expression and NO release. This hypothesis was confirmed by Western blotting analysis, carried out on samples of brain tissue. It has been shown, indeed, that the administration of myricetin induced a dose-dependent increase of eNOS expression. In contrast, a dramatic reduction of eNOS expression was observed in animals treated with L-NIO. These data are in agreement with a previous study demonstrating that myricetin is effective in the regulation of NO bioavailability, through the stimulation of the biosynthetic pathway of eNOS / NO by Akt phosphorylation [39].
In conclusion, myricetin protects the cerebral microcirculation in a condition of acute injury due to transient hypoperfusion and reperfusion; this effect appear to be related to its antioxidant properties and to modulation of NO release. However, further studies of these pathways are required to clarify all the mechanisms operative in the microvascular damages due to cerebral blood flow reduction.
- Wang T, Li Q, Bi K (2017) Bioactive flavonoids in medicinal plants: Structure, activity and biological fate. Asian J of Pharm Science 13: 12-23.
- Panche AN, Diwan AD, Chandra SR (2016) Flavonoids: an overview. J Nutr Sci 5: e47.
- Kazazić SP (2004) Antioxidative and antiradical activity of flavonoids. Arh Hig Rada Toksikol 55: 279-290.
- Kelly EH, Anthony RT, Dennis JB (2002) Flavonoid antioxidants: chemistry, metabolism and structure-activity relationships. J of Nutr Bioc 13: 572-584.
- Ojelabi OA, Lloyd KP, De Zutter JK, Carruthers A (2018) Red wine and green tea flavonids are cis-allosteric activators and competitive inhibitors of GLUT1-mediated sugar uptake. J Biol Chem 25: RA118.002326.
- Kähkönen MP, Henonen M (2003) Antioxidant Activity of Anthocyanins and Their Aglycons. J Agric Food Chem 51: 628-633.
- Van Acker SABE, Van Der Berg DJV, Tromp MENJL, Griffion DH, Van Bennekom PV, et al. (1996) Structural aspects of antioxidant activity of flavonoids. Free Radical Biol Med 20: 331-342.
- Ngai AC, Ko KR, Morii S, Winn HR (1988) Effect of sciatic nerve stimulation on pial arterioles in rats. Am J Physiol 254: H133-H139.
- Di Carlo G, Mascolo N, Izzo AA, Capasso F (1999) Flavonoids: Old and new aspects of a class of natural therapeutic drugs. Life Sciences 65: 337-353.
- Semwal DK, Semwal RB, Combrinck S, Viljoen A (2016) Myricetin: A Dietary Molecule with Diverse Biological Activities. Nutrients 8: 90.
- Sola L, Stipanićev M, Vujčić V, Mitić B, Huđek A, et al. (2018) Comparative Analysis of Native Crocus Taxa as a Great Source of Flavonoids with High Antioxidant Activity. Plant Foods Hum Nutr 73: 189-195.
- Husain E, Fatima RA, Ali IA, Naseem I (2006) Photoilluminated riboflavin/riboflavin-Cu(II) inactivates trypsin: Cu(II) tilts the balance. Indian J Biochem Biophys 43: 312-318.
- Chaudhuri S, Banerjee A, Basu K, Sengupta B, Sengupta PK (2007) Interaction of flavonoids with red blood cell membrane lipids and proteins: antioxidant and antihemolytic effects. Int J Biol Macromol 41: 42-48.
- Rice-Evans C, Miller N, Paganga G (1997) Antioxidant properties of phenolic compounds. Trends in Plant Science 2: 152-159.
- Tzeng SH, Ko WC, Ko FN, Teng CM (1991) Inhibition of platelet aggregation by some flavonoids. Thromb Res 64: 91-100.
- Sun Y, Lian M, Lin Y, Xu B, Li Y, et al. (2018) Role of p-MKK7 in myricetin-induced protection against intestinal ischemia/reperfusion injury. Pharmacol Res 129: 432-442.
- Cory H, Passarelli S, Szeto J, Tamez M, Mattei J (2018) The Role of Polyphenols in Human Health and Food Systems. Front Nutr 5: 87.
- Gonzàlez-Barrio R, Borges G, Mullen W, Crozier A (2010) Bioavailability of anthocyanins and ellagitannins following consumption of raspberries by healthy humans and subjects with an ileostomy. J Agric Food Chem 58: 3933-3939.
- Mertens-Talcott SU, Jilma-Stohlawetz P, Rios J, Hingorani L, Derendorf H (2006) Absorption, metabolism, and antioxidant effects of pomegranate (Punica granatum l.) polyphenols after ingestion of a standardized extract in healthy human volunteers. J Agric Food Chem 54: 8956-8961.
- Ceci C, Lacal PM, Tentori L, De Martino MG, Miano R, et al. (2018) Experimental Evidence of the Antitumor, Antimetastatic and Antiangiogenic Activity of Ellagic Acid. Nutrients 10: 2018.
- Moreau P, Takasa H, Küng CF, van Rooijen MM, Schaffner T, et al. (1995) Structure and function of the rat basilar artery during chronic nitric oxide synthase inhibition. Stroke 26: 1922-1928.
- Lapi D, Vagnani S, Pignataro G, Esposito E, Paterni M, et al. (2012) Protective Effects of Quercetin on Rat Pial Microvascular Changes during Transient Bilateral Common Carotid Artery Occlusion and Reperfusion. Front Physiol 3: 32.
- Lapi D, Chiurazzi M, Di Maro M, Mastantuono T, Battiloro L, et al. (2016) Malvidin's Effects on Rat Pial Microvascular Permeability Changes Due to Hypoperfusion and Reperfusion Injury. Front Cell Neurosci 10: 153.
- Lapi D, Vagnani S, Cardaci E, Paterni M, Colantuoni A (2011) Rat pial microvascular responses to melatonin during bilateral common carotid artery occlusion and reperfusion. J Pineal Res 51: 136-144.
- Watanabe S (1998) In vivo fluorometric measurement of cerebral oxidative stress using 2'-7'-dichlorofluorescein (DCF). Keio J Med 47: 92-98.
- Morii S, Ngai AC, Winn HR (1986) Reactivity of rat pial arterioles and venules to adenosine and carbon dioxide: with detailed description of the closed cranial window technique in rats. J Cereb Blood Flow Metab 6: 34-41.
- Hudetz AG, Fehér G, Weigle CG, Knuese DE, Kampine JP (1995) Video microscopy of cerebrocortical capillary flow: response to hypotension and intracranial hypertension. Am J Physiol 268: H2202-H2210.
- Kassab GS, Rider CA, Tang NJ, Fung YC (1993) Morphometry of pig coronary arterial trees. Am J Physiol 265: H350-H365.
- Lapi D, Marchiafava PL, Colantuoni A (2008) Geometric characteristics of arterial network of rat pial microcirculation. J Vasc Res 45: 69-77.
- Lapi D, Vagnani S, Pignataro G, Esposito E, Paterni M, et al. (2012) Rat Pial Microvascular Responses to Transient Bilateral Common Carotid Artery Occlusion and Reperfusion: Quercetin's Mechanism of Action. Front Physiol 3: 99.
- Wang H, Joseph JA (1999) Quantifying cellular oxidative stress by dichlorofluorescein assay using microplate reader. Free Radic Biol Med 27: 612-616.
- Bederson JB, Pitts LH, Germano SM, Nishimura MC, Davis RL, et al. (1986) Evaluation of 2,3,5-triphenyltetrazolium chloride as a stain for detection and quantification of experimental cerebral infarction in rats. Stroke 17: 1304-1308.
- Barber PA, Davis SM, Infeld B, Baird AE, Donnan GA, et al. (1998) Spontaneous reperfusion after ischemic stroke is associated with improved outcome. Stroke 29: 2522-2528.
- Lin L, Wang X, Yu Z (2016) Ischemia-reperfusion Injury in the Brain: Mechanisms and Potential Therapeutic Strategies. Biochem Pharmacol 5: 213.
- Sommer CJ (2017) Ischemic stroke: experimental models and reality. Acta Neuropathol 133: 245-261.
- Lalkovičová M, Danielisová V (2016) Neuroprotection and antioxidants. Neural Regen Res 11: 865-874.
- Eklöf B, Siesjö BK (1973) Cerebral blood flow in ischemia caused by carotid artery ligation in the rat. Acta Physiol Scand 87: 69-77.
- Sun L, Xu P, Fu T, Huang X, Song J, et al. (2018) Myricetin against ischemic cerebral injury in rat middle cerebral artery occlusion model. Mol Med Rep 17: 3274-3280.
- Angelone T, Pasqua T, Di Majo D, Quintieri AM, Filice E, et al. (2011) Distinct signalling mechanisms are involved in the dissimilar myocardial and coronary effects elicited by quercetin and myricetin, two red wine flavonols. Nutr Metab Cardiovasc Dis 21: 362-371.