Abstract
We have previously reported that 2D-SPR sensor can observe the intracellular reactions occurring near the bottom of rat myoblast cells cultured on a gold chip upon human insulin stimulation without probes [1]. In this paper, the myotube cells differentiated from myoblast cells were used as the molecular recognition element of the cell-based 2D-SPR for wild-type insulin and its analog. Though the time-course response pattern of the myotube-based sensor for insulin was similar to that of the myoblast-based sensor, the detection limit for human insulin of the myotube-based sensor increased approximately 50-fold as compared with the myoblast-based sensor. Detection range for insulin was 0.1-0.5 μM. The myotube-based sensor was further applied to insulin analog detection. Though the detection range for the analog was the same as for wild-type insulin, the time-course pattern of SPR signal was clearly different as compared with that for wild-type insulin. This difference of response pattern was considered as the difference of the relative amount of monomeric form of insulin and insulin analog. These results suggested the useful strategy for sensitivity improvement and the high discrimination ability of the cell-based 2D-SPR sensor.
Keywords
2D-SPR, Cell-based sensor, Rat myotube cells, Insulin analog, Sensitivity improvement, Discrimination ability.
Introduction
In the insulin signal transduction pathway of a living cell, translocation processes of some kinds of kinase and glucose transporter-embedded vesicles from cytosol to cell membrane play very important roles [2–4]. The conventional methods for real-time observation of these intracellular reactions need usually labeling of the target proteins with fluorescent dyes or GFP family proteins [5,6]. It has been reported that insulin receptors (IR) were expressed more in myotube cells differentiated from myoblast cells and insulin stimulation to the myotube cell induces the phosphorylation cascade reactions following translocation of the glucose transporter-embedded vesicles [2,7]. Therefore we expected the myotube cell-based 2D-SPR sensor could observe such intracellular reactions near the cell bottom upon insulin stimulation. Meanwhile, insulin concentration in the blood is one of utmost importance for patients with type 2 diabetes who need insulin injections. In recent years, ultra-fast acting type recombinant insulin analogs in which one or two amino acids are replaced by genetic engineering is widely applied for treatment of type 2 diabetes [8]. The monitoring of the amount of insulin in the blood and the determination of wild type insulin vs Injected recombinant insulin is very important in the treatment of the insulin-treated type2 diabetes patient who has developed insulin resistance. Immunochemical techniques such as ELISA are widely used for detection of wild-type insulin and insulin analogs. However, ELISA method needs several steps such as washing, blocking and antigen-antibody binding. These steps are very complicated and take time. For the development of more simple and rapid detection of insulin and insulin analog (Aspart: Mutated in B chain P28D), here we proposed the myotube cell-based 2D-SPR sensor.
Experiment
Reagents
L6 cells (JCRB9081) were obtained from the cell bank of National Institutes of Biomedical Innovation, Health and Nutrition (Japan). Minimum Essential Medium Alpha (MEM-α) and Penicillin-streptomycin were purchased from GIBCO (Tokyo, Japan). Fetal bovine serum (FBS) was obtained from ICN Biomedicals, Inc. Modified Hanks’ balanced salt solution (HBSS) was purchased from Sigma-Aldrich Japan Co. (Tokyo, Japan). Human insulin (Recombinant expressed in Yeast, Animal-Free) was purchased from Nacalaitesque, Inc. (Kyoto, Japan). Insulin analogs (Insulin Aspart; NovoRapid®; Novo Nordisk Pharma Ltd,) was kindly donated by Prof. M.Isobeand Prof. N.Kurosawa, Graduate School of Science and Engineering, University of Toyama, Japan. A 50 nm goldlayer-deposited high refractive index glass (SF6) chip (18x17 mm) was purchased from BAS Inc. (Japan), and flexiPERM® (11x17x10 mm) was purchased from Greiner Bio-One (Germany). Stock solutions of various concentration of insulin and insulin analog were diluted by HBSS to the desired concentration.
Cell differentiation
Rat myoblast (L6) cells were cultured in MEM-α supplemented with 10% (v/v) FBS and 1% (v/v) penicillin-streptomycin with culture flasks. Cultured cells were maintained at 37 ºC in a humidified atmosphere containing 5% CO2 for 5 days until reaching the 70% confluence. At the subconfluent state, the culture medium was exchanged with MEM-α supplemented with 2% (v/v) FBS and 1% penicillin-streptomycin, and the cells were maintained in this medium for additional 5 days to induce the differentiation of myoblast cells into myotube cells [9].
Experimental setup for 2D-SPR imaging
Initially, the 2D-SPR sensor chip was modified with myotube cells which were differentiated from myoblast cells for the aim of improvement of insulin sensitivity. Fig.1 shows the phase contrast images of cultured L6 myoblast cells and differentiated myotub ecells. The cultured cell was reseeded onto the gold sensor chip on which flexiPERM® (11×7×10 mm) was attached. The cell-seeded sensor chip was incubated for 24 hrs at 37 ºC in 5% CO2for cell adhesion. HBSS was first injected as a control experiment to the cells at 5 minutes from the SPR signal recoding start. The wild-type insulin solution or insulin analog solution was sequentially injected at 10 minutes and the reflection intensity in the cell regions was recorded for total 60 minutes. The detail procedure is referred to the previous papers [10,11].
Results and discussion
2D-SPR observation of cell response upon insulin stimulation
In order to evaluate the effectiveness of the myotube cells as an insulin recognition element on the cell-based 2D-SPR sensor, signal responses of myoblast and myotube cell to wild-type insulin were first compared. Figure 2 shows the time-course of reflection intensity change at representative myotube cell regions upon the stimulation with various concentration of wild-type insulin (0, 0.1, 0.25, 0.5, 1 μM). Injection of HBSS at 5 minutes from the recording start was performed as the control. Reflection intensity change at the cell regions by HBSS injection was less than 2%. On the other hand, the significant increase of reflection intensity was observed at the myotube cell regions upon insulin stimulation. The reflection intensity after 50 minutes from the insulin injection increased as the insulin concentration increased from 0.1 to 0.5 μM. Figure 3 shows the dependence of reflection intensity change at myotube cell regions on the concentration of the injected wild-type insulin. As a contrast, the myoblast cell-based sensor showed only 5% ± 2.2 % increase in reflection intensity for small 5 μM insulin stimulation, and the limit of detection for insulin with the myoblast-based sensor was 5 μM (data is not shown). The insulin sensitivity of the cell-based 2D-SPR sensor was certainly improved in approximately 50-fold by using myotube cells instead of myoblast cells. These data suggest that myotube cell-based 2D-SPR detection would provide a better insulin recognition element on the 2D-SPR sensor. This result collaborates a research report indicating increased expression of the insulin receptor in the myotube cells as compared with myoblast cells [12].
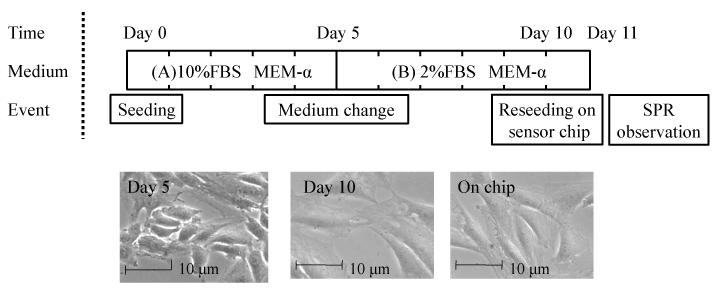
Fig.1 Phase contrast microscope images of L6 myoblast cells (day 5), myotube cells (day 10) in the culture flask and myotube cells reseeded on a gold chip (day 11).
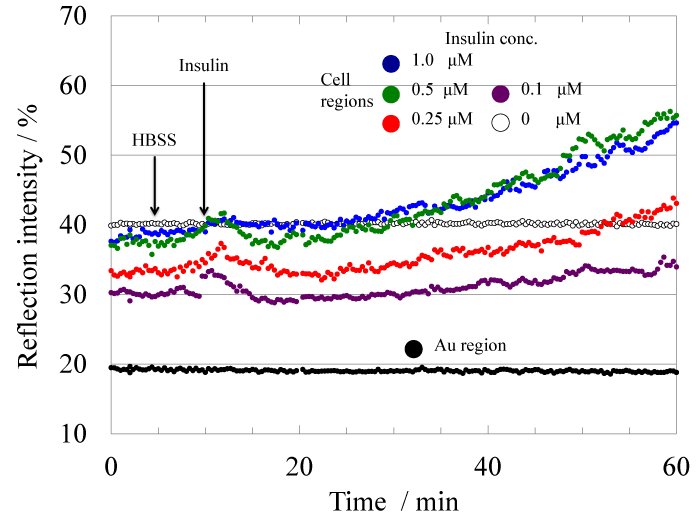
Fig.2Time-course of the reflection intensity change at the myotube cell regions upon stimulation with the various concentration of insulin. The color of the marker shows the concentration (white: 0 μM, purple: 0.1 μM, red: 0.25 μM, blue:0.5 μM, green: 1 μM).
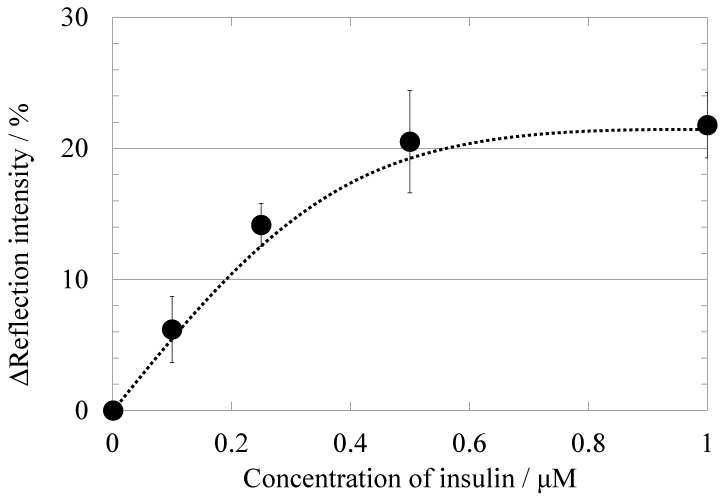
Fig.3 Dependence of the reflection intensity increase on the concentration of insulin with the myotube cell-based sensor. The reflection intensity increase was read after 50 minutes from insulin injection.
Detection of the insulin analog with myotube cell-based 2D-SPRsensor
Myotube cell-based 2D-SPRsensor technique was further applied to the detection of insulin analog. Figure 4 shows the time-course of reflection intensity change upon the stimulation with an insulin analog Aspart. The insulin analog injection also caused increase of reflection intensity in a concentration-dependent manner. Figure 5 shows the concentration dependence of the reflection intensity increases after 50 minutes from the analog injection. Detection range for the Aspart was 0.1-0.5 μM as same as Wild-type insulin. Furthermore, the pattern of 2D-SPR response upon insulin analog stimulation was obviously different as compared with that upon wild-type insulin stimulation. The difference in signal increase pattern of SPR response between wildtype insulin and insulin analog was considered to be a difference of the amount of relative monomeric insulin in a solution. It has been already shown that wild-type insulin usually forms homo-dimers and those three aggregates form homo-hexamers in a solution [13–15], though only monomeric insulin can bind to the insulin receptor. On the other hand, the homo-dimer formation of the insulin analog is inhibited because of the genetically exchanged amino acid sequence [16]. Therefore, we considered that the relative amount of insulin monomer in the solution may be involved in the SPR signal increase pattern [3,17].
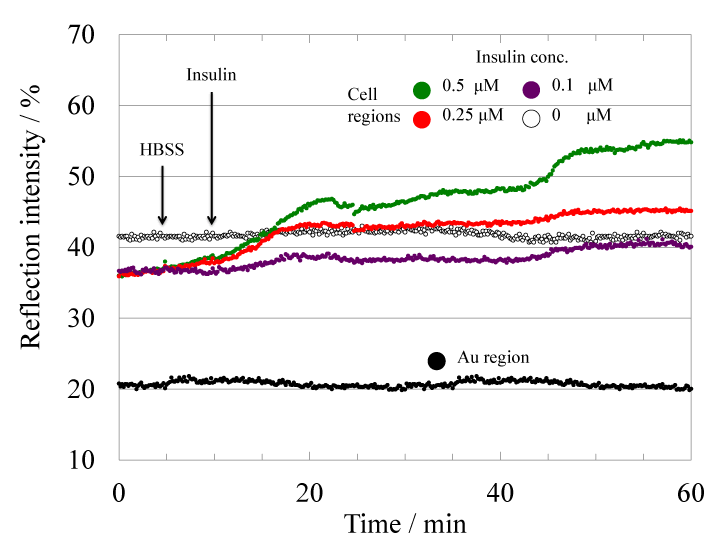
Fig.4 Time-course of the reflection intensity change at the myotube cell regions upon the stimulation with various concentration (0.1 to 0.5 μM) of insulin analog Aspart. The color of the marker shows the concentration (purple: 0.1 μM, red: 0.25 μM, blue:0.5 μM).
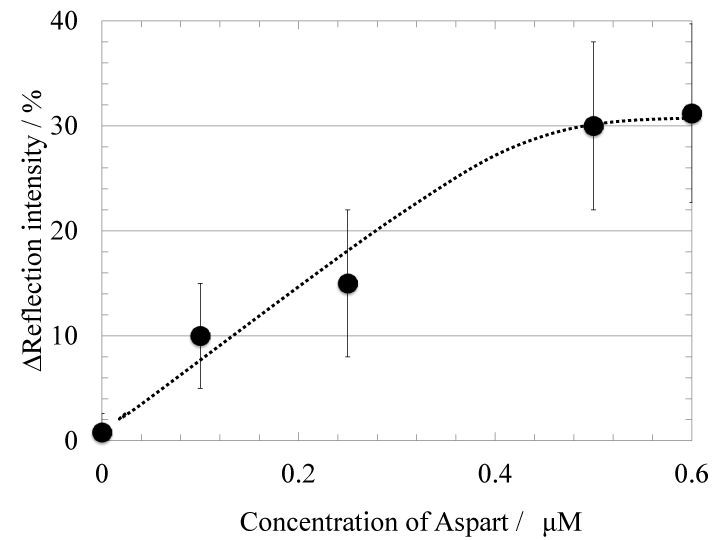
Fig.5 Dependence of the reflection intensity increase on the concentration of Aspart with the myotube cell-based sensor. The reflection intensity increase was read after 50 minutes from Aspart injection.
Conclusion
The detection limit and sensitivity for insulin with the cell-based SPR sensors were significantly improved by changing the bio-recognition element from myoblast cell to the differentiated myotube cell. Though this detection limits are still higher than that of ELISA method, this myotube cell-based SPR sensor is advantageous in the simple and rapid detection of cell active insulin. The result of this study suggested that application of differentiated cell to the recognition element for a target molecule might be one useful strategy for the improvement of the cell-based sensor. In addition, the result demonstrated that a combination of living myotube cells and a SPR sensor was useful for detection of not only wild-type insulin but also ultra-fast acting-type recombinant insulin analog. Insulin and Aspart were detected in the concentration range from 0.1 to 0.5 μM by SPR signal increase within 1 hr. Furthermore, we observed the different pattern of the SPR signal increase for wild-type insulin and insulin analog. This new finding suggested that the myotube cell-based 2D-SPR sensor could discriminate wild-type insulin and ultra-fast acting type insulin analog.
References
- Yuki S, Hiroaki S, Minoru S (2016) 2D-SPR Monitoring of Intracellular Reaction in Individual Skeletal Myoblast Cells Upon Insulin Stimulation. in The 16th International Meeting on Chemical Sensors Abstract Book (ed. Chong O. Park) 84.
- Beguinot F, Kahn CR, Moses AC, Smith RJ (1986) The Development of Insulin Receptors and Responsiveness Is an Early Marker of Differentiation in the Muscle Cell Line L6*. Endocrinology 118, 446–455.
- Chang L, Chiang SH, Saltiel AR (2004) Insulin signaling and the regulation of glucose transport. Mol Med 10: 65-71. [Crossref]
- Khayat ZA, Tong P, Yaworsky K, Bloch RJ, Klip A (2000) Insulin-induced actin filament remodeling colocalizes actin with phosphatidylinositol 3-kinase and GLUT4 in L6 myotubes. J Cell Sci. 113 Pt 2, 279–90. [Crossref]
- Saltiel AR, Pessin JE (2003) Insulin signaling in microdomains of the plasma membrane. Traffic 4: 711-716. [Crossref]
- Robinson LJ1, Pang S, Harris DS, Heuser J, James DE (1992) Translocation of the glucose transporter (GLUT4) to the cell surface in permeabilized 3T3-L1 adipocytes: effects of ATP insulin, and GTP gamma S and localization of GLUT4 to clathrin lattices. J Cell Biol. 117, 1181–1196. [Crossref]
- Watson RT, Pessin J2021 Copyright OAT. All rights reservf insulin signaling and GLUT4 translocation. Recent Prog Horm Res. 56, 175–193. [Crossref]
- Kalra S, Gupta Y (2014) Ultra-fast acting insulin analogues. Recent Pat Endocr Metab Immune Drug Discov 8: 117-123. [Crossref]
- Sarker KP, Lee KY (2004) L6 myoblast differentiation is modulated by Cdk5 via the PI3K-AKT-p70S6K signaling pathway. Oncogene 23, 6064–6070. [Crossref]
- Mir TA, Shinohara H (2013) Two-dimensional surface plasmon resonance imager: An approach to study neuronal differentiation. Anal Biochem. 443, 46–51. [Crossref]
- Shinohara H, Sakai Y, Mir TA (2013) Real-time monitoring of intracellular signal transduction in PC12 cells by two-dimensional surface plasmon resonance imager. Anal Biochem. 441, 185–189. [Crossref]
- Lawson MA, Purslow PP (2000) Differentiation of myoblasts in serum-free media: effects of modified media are cell line-specific. Cells. Tissues. Organs 167, 130–137. [Crossref]
- Emdin SO, Dodson GG, Cutfield JM, Cutfield SM (1980) Role of zinc in insulin biosynthesis. Some possible zinc-insulin interactions in the pancreatic B-cell. Diabetologia 19: 174-182. [Crossref]
- Brange J, Langkjœr L. in 315–350 (1993). doi:10.1007/978-1-4899-1236-7_11
- Huus K, Havelund S, Olsen HB, van de Weert M, Frokjaer S (2005) Thermal dissociation and unfolding of insulin. Biochemistry 44: 11171-11177. [Crossref]
- Pettus J, Santos Cavaiola T1, Tamborlane WV2, Edelman S1 (2016) The past, present, and future of basal insulins. Diabetes Metab Res Rev 32: 478-496. [Crossref]
- De Meyts P (2004) Insulin and its receptor: structure, function and evolution. Bioessays 26: 1351-1362. [Crossref]


