Abstract
Purpose: The purpose of this work is to explore the capability of the MCNP6 unstructured mesh geometry resources to create an eye and tumor anatomic model for ophthalmic brachytherapy dosimetry.
Methods: Abaqus/CAE software was utilized to construct three anatomic eye models using first order tetrahedral mesh elements: a model with a 2 cm in diameter deep tumor; a model with a 1.2 cm in diameter deep tumor; and a model with a 1.2 cm superficial tumor. 2 cm and 1.2 cm COMS applicators fully loaded with Amersham 6711125I seeds were coupled to the eye models for dose calculation using the MCNP6 code. The dose values in the structures of the eye were compared to those obtained using analytical models.
Results: Unstructured mesh model has small differences (maximum of 3.4%) in the mass values of the components of the eye comparing to those obtained in the analytical model. Excluding the optical nerve wall, all dose differences were beneath 4% for all structures. The overall dose in the eye agrees within 2% between different models.
Conclusions: The feasibility of using unstructured mesh based geometries to model fine structures of the eye has been verified in this study. It was possible to create adequately the anatomic model of the human eye with reproducible dose values compared to reference values.
Introduction
The necessity for a more accurate modeling of human body structures for dose calculation conducts to the application of new computational resources. In many situations in radiation therapy, the only way to estimate absorbed dose to important and critical parts of the body is performing computer simulations, so that, the accuracy of the geometry modeling of the problem, among other factors, is crucial to obtain reliable results.
One of the examples in which the dose verification is almost exclusively performed by simulations is the case of ophthalmic brachytherapy for melanoma intraocular cancer [1]. In this treatment modality, small sealed radioactive sources are placed adjacent to the eye lesion using specific removable applicator or plaque. The size of the plaque depends on the tumor base, usually, considering tumor-free margin of 2 to 3 mm [2] and the irradiation procedure is conducted under the recommendations of the report Task Group 43 (TG-43) [3]. As new source models are emerging, it reinforces the need for more accurate eye anatomical models [4].
Different types of radionuclides have been used for ophthalmic brachytherapy including 125I, 103Pd and 106Ru/106Rh in distinct arrangements to conform to the desired dose distribution usually with high gradients around the radioactive sources. This aspect contributes to the fact that any changes in the anatomy structure could be critical in determining accurately the dose. Recently, Caracappa et al [5] introduced a high-resolution eye model in an attempt to provide more accurate representation of the eye and particularly for the lens due to the increasing concern for cataract appearance. This model is built on CAD format and the final format is a voxel-based phantom able to be simulated in the MCNPX code [6]. Lesperance et al [7] also developed a voxelized eye model to study the effect of tissue composition on dose concluding that the accurate elemental composition is important for dose calculation.
The MCNP code incorporated in its version 6 release [8] an alternative option for geometry modeling based on unstructured mesh (UM) [9] representation that can be embedded to the constructive solid geometry (CSG). In this new feature, the MCNP code is capable of importing an external file containing a finite element based mesh geometry, generated, for example, using the Abaqus code [10]. This new MCNP capability allows the geometric description of complex shapes and it has been explored to model complex geometries like Fletcher Williamson GYN 192Ir HDR and an accelerated partial breast irradiation balloon brachytherapy applicator [11].
The goal of this work is to explore the capability of the MCNP unstructured mesh geometry resources to create a new eye and tumor anatomic model for ophthalmic brachytherapy dosimetry. The eye components shapes from the mathematical eye model formerly developed by Yoriyaz et al. [12] were used as a reference model.
Materials and methods
Analytical eye model
The analytical eye model is composed by ten distinct structures. Dose values to these structures due to the irradiation of 2 cm COMS applicator and 1.2 cm COMS applicators [1] fully loaded with Amersham 6711 125I seeds were calculated using the MCNP6 radiation transport code [8]. The anatomic eye models were constructed considering two different geometric approaches using: a) analytical geometry and b) first order tetrahedral mesh elements. Three different tumor sizes were considered: in the first case, a 2 cm (in diameter) tumor (at tumor base) to be irradiated with a 2 cm COMS applicator; in the second case a 1.2 cm (in diameter) deep tumor was considered and in the third case a 1.2 cm superficial tumor was considered, both irradiated with a 1.2 cm COMS applicator.
The equations for the analytical human eye models were based on Yoriyaz’s model [12], with some modifications to allow modeling in Abaqus to preserve shape. The eye center is located at y = −1.6 cm, and it is looking towards the +z direction. The analytical case was modeled using these equations in the MCNP6 input.
Sclera, choroid, retina and vitreous body. These four structures comprise the main body of the eye, and are defined as three concentric spherical shells 1 mm thick each and a concentric sphere with 1.05 cm radius, respectively. The equations for these structures are given below:
1.252 < x2 + (y + 1.6)2 + z2 ≤ 1.352
1.152 < x2 + (y + 1.6)2 + z2 ≤ 1.252
1.052 < x2 + (y + 1.6)2 + z2 ≤ 1.152
x2 + (y + 1.6)2 + z2 ≤ 1.052
These four structures were cut by the tumor and lens surfaces, so that, they also must satisfy equations (5) and (2), (3) or (4), depending on the model.
Tumor. The tumor was defined as an ellipsoid limited by the spherical surface of the sclera, resulting in an irregular structure starting at the eye surface and growing towards the nucleus of the vitreous body according to equations (2) for the 2-cm tumor model; equations (3) for the 1.2 cm deep tumor model; and equations (4) for the 1.2 cm superficial tumor model:
0.444(x)2 + 0.04(y − 3.6)2 + 0.444(z)2 ≤ 1
x2 + (y + 1.6)2 + z2 ≤ 1.352
2(x)2 + 0.04(y − 3.6)2 + 2(z)2 ≤ 1
x2 + (y + 1.6)2 + z2 ≤ 1.352
0.444(x)2 + 0.04(y − 4.45)2 + 0.444(z)2 ≤ 1
x2 + (y + 1.6)2 + z2 ≤ 1.352
Lens. The lens is the most radiosensitive structure of the eye, and was defined as an ellipsoid internal to and limited by the spherical surface of the sclera, given by:
2.04(x)2 + 2.04(y + 1.6)2 + 8.16(z − 1.18)2 ≤ 1
Cornea. The cornea was defined as a truncated elliptical shell, defined in the regions limited by the following equations:
1.45(x)2 + 1.45(y + 1.6)2 + 1.59(z − 0.73)2 > 1
1.35(x)2 + 1.35(y + 1.6)2 + 1.49(z − 0.73)2 ≤ 1
x2 + (y + 1.6)2 + z2 > 1.352
Anterior Chamber. The anterior chamber is the region between the cornea and the external surface of the sclera given by:
1.45(x)2 + 1.45(y + 1.6)2 + 1.59(z − 0.73)2 ≤ 1
x2 + (y + 1.6)2 + z2 > 1.352
Optical Nerve and Wall. These structures were represented as concentric cylinder and cylindrical shell, respectively, according to equations (8). Both start at the external surface of the sclera and were limited by the y = 2 cm plane, rotated 30° in relation to the coordinate system.
(x)2 + (z)2 ≤ 0.352
(x)2 + (z)2 ≤ 0.42
Eye plaque
A 1.2 cm COMS and 2 cm COMS eye plaques were modeled following the parameters given in the literature [1], and positioned in contact with the tumor’s outer surface, as indicated in Figure 1 for the 2 cm tumor, so that, the center of the central seed of the applicator is in the origin of the coordinate system. This entire setup is located inside a cubic water phantom with 6 cm edge, concentric to the eye’s main body. The densities and compositions of the soft tissue and applicator were taken from [13] and [1], respectively, and are shown in Table 1. The seed configuration for both applicators is indicated in Figure 2.
Table 1. Density and composition of materials used in the simulation.
Material |
Location |
Composition
(% weight) |
Density
(g/cm³) |
Soft Tissue |
Eye |
70.8% O; 14.3% C; 10.2% H; 3.4% N; 0.3% P;
0.3% S; 0.3% K; 0.2% Na; 0.2% Cl |
1.06 |
Silastic |
Eye Plaque |
39.9% Si; 28.9% O; 24.9% C; 6.3% H; 0.005% Pb |
1.12 |
Modulay (gold alloy) |
Eye Plaque |
77% Au; 14% Ag; 8% Cu; 1% Pd |
15.8 |
Silver |
Seed |
100% Ag |
10.5 |
Iodine |
Seed |
100% I |
1.30x10⁻² |
Air |
Seed |
75.53% N; 23.18% O; 1.28% Ar; 0.01% C |
5.03x10⁻⁵ |
Titanium |
Seed |
100% Ti |
4.54 |
Water |
Phantom |
100% H2O |
1.00 |
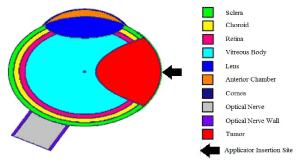
Figure 1. Eye analytical model (2 cm tumor), its structures and applicator site.Obtained with MCPlot tool [8].
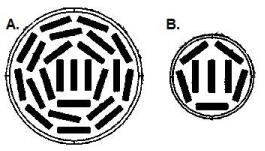
Figure 2. Seed configuration for: A. 2 cm COMS applicator; B. 1.2 cm COMS applicator.
Unstructured mesh model
The unstructured mesh model was designed based on the analytical eye model equations, using CAE software Abaqus 6.14 Student Edition [10]. The mesh model was built using first order tetrahedral elements, labeled as C3D4. These elements are defined by four nodes at its vertex. Figure 3 shows the definition of one of these elements and their nodes.
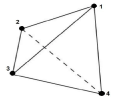
Figure 3. Unstructured mesh geometry elements used in this work: first order tetrahedron, C3D4.
The number of nodes and elements used for each structure of the eye and for the whole model are shown in Table 2. Although more elements can be used, either modeling in Abaqus or in other finite element editors (e.g. GMSH [14]), preliminary analysis showed that for this case, increasing the number of elements did not significantly affect results, but increases simulation time. Figure 4 shows each eye structure modeled and how they are assembled, and Figure 5 shows the three different tumors considered for each case.
Table 2. Number of nodes and elements for each structure of the eye using C3D4 elements.
Structures |
20 cm tumor |
12 cm deep tumor |
12 cm superficial tumor |
Nodes |
Elements |
Nodes |
Elements |
Nodes |
Elements |
Sclera |
970 |
2780 |
966 |
2815 |
972 |
2843 |
Choroid |
867 |
2466 |
908 |
2629 |
901 |
2612 |
Retina |
886 |
2541 |
970 |
2822 |
985 |
2897 |
Vitreous Body |
940 |
4316 |
902 |
4267 |
931 |
4187 |
Cornea |
432 |
1159 |
323 |
871 |
323 |
871 |
Anterior Chamber |
314 |
928 |
314 |
928 |
314 |
928 |
Lens |
563 |
2397 |
563 |
2397 |
563 |
2397 |
Optical Nerve |
433 |
1788 |
433 |
1788 |
433 |
1788 |
Optical Nerve Wall |
324 |
846 |
328 |
861 |
324 |
846 |
Tumor |
919 |
4193 |
961 |
4429 |
574 |
2362 |
Total |
6648 |
23414 |
6668 |
23807 |
6320 |
21731 |
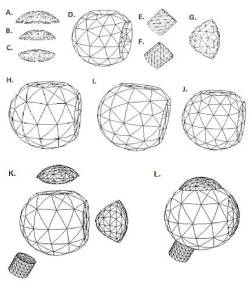
Figure 4. Structures of the human eye, modeled in Abaqus, and how they are assembled: A. Cornea; B. Anterior Chamber; C. Lens; D. Vitreous Body; E. Optical Nerve; F. Optical Nerve Wall; G. 20 cm Tumor; H. Sclera; I. Choroid; J. Retina; K. main body of the eye and accessory structures detached; L. full eye assembly.
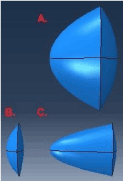
Figure 5. Different tumor size models used for each simulation: A. 2 cm tumor; B. 1.2 cm superficial tumor; C. 1.2 cm deep tumor.
The unstructured mesh geometry importation process in the MCNP6 code requires the definition of different kinds of geometry cells. The eye structures are imported as pseudo-cells, which is the terminology for a MCNP6 cell that is created with UM-geometry; a fill-cell must be defined as a regular cell that comprises the entire imported model. The interior of this cell is filled by the unstructured mesh geometry, while the outside is filled by the constructive solid geometry. A background-cell must also be defined as the material that fills the region inside the fill-cell that is not being occupied by the pseudo-cells [9]. These MCNP6 geometry concepts are illustrated in Figure 6.
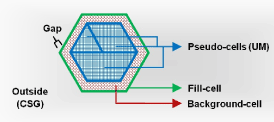
Figure 6. Definition of the fill-cell that contains the pseudo-cells (unstructured mesh) and the background-cell (that fills the empty space in the fill-cell creating a gap). The outside is filled with constructive solid geometry.
Volume calculation
The estimative of the volume for each structure of the eye models where obtained using the track-length estimator (F4) with statistical uncertainties, k=1, less than 1% using 107 particle histories.
Dose calculation
All simulations for dose calculation were ran with 107 particle histories, leading to a MCNP6 statistical error of less than 0.5% for most structures, except optical nerve and wall (respectively 1 and 1.2%), in all models. Only photons were transported, and secondary electrons generated are not tracked because the structures of the eye are much greater than the mean range of secondary electrons, so that, charged particles equilibrium was considered. Energy deposition per unit mass was calculated using tally F6 estimator.
Results
The volume of each eye structure for all three models used in this work is shown in Table 3. All relative differences to analytical model are less than 4%, except for the optical nerve wall. The total volume relative difference is less than 2% from reference.
Table 3. Mass calculated for each structure of the eye in each model and respective relative difference (in percentage) to the reference model (CSG).
Model |
2 cm deep tumor |
1.2 cm deep tumor |
1.2 cm superficial tumor |
Structure |
Volume (cm³) |
Rel. Diff.
(%) |
Volume (cm³) |
Rel. Diff.
(%) |
Volume (cm³) |
Rel. Diff.
(%) |
CSG |
UM |
CSG |
UM |
CSG |
UM |
Sclera |
1.73 |
1.72 |
-0.74 |
1.91 |
1.88 |
-1.18 |
1.91 |
1.89 |
-1.11 |
Choroid |
1.46 |
1.44 |
-1.57 |
1.62 |
1.60 |
-1.40 |
1.65 |
1.62 |
-1.88 |
Retina |
1.23 |
1.21 |
-1,60 |
1.37 |
1.35 |
-1.58 |
1.41 |
1.39 |
-1.58 |
Vitreous Body |
4.10 |
4.04 |
-1,43 |
4.58 |
4.49 |
-1.85 |
4.78 |
4.70 |
-1.55 |
Cornea |
0.06 |
0.06 |
-0.74 |
0.06 |
0.06 |
-1.82 |
0.06 |
0.06 |
-1.82 |
Anterior Chamber |
0.16 |
0.15 |
-2.25 |
0.16 |
0.15 |
-2.44 |
0.16 |
0.15 |
-2.44 |
Lens |
0.48 |
0.46 |
-2.87 |
0.48 |
0.46 |
-3.01 |
0.48 |
0.46 |
-2.91 |
Optical Nerve |
0.26 |
0.26 |
-1.58 |
0.26 |
0.26 |
-1.58 |
0.26 |
0.26 |
-1.58 |
Optical Nerve Wall |
0.08 |
0.09 |
11.65 |
0.08 |
0.09 |
11.65 |
0.08 |
0.09 |
11.65 |
Tumor |
1.32 |
1.30 |
-1.66 |
0.36 |
0.35 |
-3.97 |
0.09 |
0.09 |
-3.94 |
Total |
10.89 |
10.74 |
-1.36 |
10.89 |
10.71 |
-1.65 |
10.89 |
10.72 |
-1.52 |
The two smallest structures are the cornea and the optical nerve wall with respective volumes of 0.06 and 0.08 cm3. Although similar in volume these two structures present significant differences in volume estimates when using different geometry approach (CSG or UM). For example, the maximum difference in the volume estimate for cornea between CSG and UM geometry is only 1.82% while the difference for the optical nerve wall is almost 12%.
Calculated absorbed dose per photon and the respective percentage difference relative to reference model (CSG) are shown in Table 4. All differences in dose relative to reference model are less than 4%, except for the optical nerve wall. The difference in the total dose to eye between models is less than 1.7%.
Table 4. Absorbed dose calculated for each structure of the eye in each model, and relative difference (in percentage) to reference model (CSG).
Model Structure |
2 cm deep tumor |
1.2 cm deep tumor |
1.2 cm superficial tumor |
Absorbed Dose
(·10-15 Gy. photon-1) |
Relative Diff.
(%) |
Absorbed Dose
(·10-15 Gy.photon-1) |
Relative Diff.
(%) |
Absorbed Dose
(·10-15 Gy.photon-1) |
Relative Diff.
(%) |
CSG |
UM |
CSG |
UM |
CSG |
UM |
Sclera |
7.02 |
7.12 |
1.54 |
7.48 |
7.77 |
3.87 |
7.79 |
8.07 |
3.62 |
Choroid |
7.62 |
7.71 |
1.17 |
8.49 |
8.68 |
2.20 |
9.54 |
9.75 |
2.27 |
Retina |
7.77 |
7.90 |
1.68 |
9.00 |
9.21 |
2.38 |
10.67 |
10.91 |
2.23 |
Vitreous Body |
8.24 |
8.33 |
1.15 |
9.15 |
9.24 |
1.00 |
10.32 |
10.40 |
0.73 |
Cornea |
3.93 |
4.03 |
2.63 |
3.21 |
3.18 |
-0.82 |
3.21 |
3.18 |
-0.90 |
Anterior Chamber |
4.13 |
4.26 |
3.07 |
3.33 |
3.37 |
1.12 |
3.33 |
3.35 |
0.78 |
Lens |
6.05 |
6.02 |
-0.56 |
4.78 |
4.77 |
-0.16 |
4.78 |
4.76 |
-0.33 |
Optical Nerve |
2.10 |
2.12 |
0.85 |
1.81 |
1.78 |
-1.85 |
1.83 |
1.77 |
-3.36 |
Optical Nerve Wall |
2.12 |
2.97 |
40.04 |
1.79 |
2.28 |
26.97 |
1.78 |
2.25 |
26.67 |
Tumor |
39.79 |
40.43 |
1.62 |
65.71 |
67.98 |
3.46 |
118.30 |
122.29 |
3.37 |
Total |
11.37 |
11.52 |
1.32 |
10.08 |
10.25 |
1.70 |
10.08 |
10.24 |
1.52 |
2021 Copyright OAT. All rights reserv
Discussion
The new MCNP6 UM geometry resource gives us the possibility to lead with irregular shapes which overcomes several geometry limitations, however, the UM geometry importation process in MCNP6 must be taken into account carefully. The code uses the embed card to access the. inp file generated with Abaqus and match each eye structure with a MCNP cell. A fill cell must also be defined as a regular cell that comprises the universe that will contain the embedded UM geometry. Care must be taken to not allow the fill cell to clip the UM geometry, as it would create a particle lost region due to a known bug in MCNP version 6 [9]. Thus, a gap should exist between the outside of the fill cell (i.e., the applicator and the water phantom) and the mesh surface. This gap (represented in Figure 6) was made of water in this work to reduce differences in eye-phantom interface, as the eye model was already submerged in water.
The presence of this water gap is another factor that can affect dose distribution and its thickness should be chosen carefully, as it creates a greater water surface in increasing it, but leads to loss of particles in reducing it too much. For each different simulation geometry, the user must find the optimal gap thickness, as the material and irregular shape of mesh structure also affects dose distribution. A thickness value of 0.005 cm was used in this work.
For most part of the structures, dose relative differences to the CSG model are below 4%, an acceptable value for clinical purposes, thus allowing the UM models to be considered an interesting option for dosimetry simulations providing the issues discussed above are taken into account. Differences of more than 4% in dose are seen only for the optical nerve wall which is the smallest and most distant structure from the applicator, leading to a poor modeling with finite elements. It also has the lowest dose level (5% of the maximum dose), therefore, the dose differences shown in Table 4 actually represent smaller absolute differences, causing small clinical impact. Because this structure actually comprises the entire optical nerve, and both are distant from radiation source, the dose on the wall is expected to be approximately the same as in the nerve, which is achieved in the CSG reference simulation, but not in the mesh geometry simulation. The UM importation process discussed above is also a possible source of errors in simulation, as the optical nerve wall is in the interface between UM and CSG geometries, but the optical nerve is not.
Dose comparison between the two 1.2 cm tumor models agrees for most part of the structures, except by the sclera, choroid, retina and vitreous body, that have some of their extent replaced by the tumor, so that, they show greater dose in the superficial case. Dose to the tumor itself is approximately 80% greater in the superficial case, showing that this kind of tumor is more efficiently treated.
Conclusion
This work demonstrated the feasibility and precision of unstructured mesh geometries to represent fine structures of the eye. It was possible to create adequately the anatomic model of the human eye with reproducible dose values compared to reference values with dose relative differences within 4% for most of the clinical relevant structures. Although difference of more than 4% in the dose relative to analytical model was found for the optical nerve wall, this structure is small and distant to the applicator site, and the difference was partially attributed to the known problems with MCNP version 6 mesh importation capabilities.
Acknowledgment
This project was supported by Conselho Nacional de Desenvolvimento Científico e Tecnológico (CNPq) grant number 305924/2013-3.
References
- Chiu-Tsao ST, Astrahan MA, Finger PT, Followill DS, Meigooni AS, et al. (2012) Dosimetry of (125) I and (103) Pd COMS eye plaques for intraocular tumors: report of Task Group 129 by the AAPM and ABS.Med Phys39: 6161-6184. [Crossref]
- Melia BM, Abramson DH, Albert DM, Boldt HC, Earle JD (2001) Collaborative Ocular Melanoma Study Group. Collaborative Ocular Melanoma Study (COMS) randomized trial of I-125 brachytherapy for medium choroidal melanoma. I. Visual acuity after 3 years. Ophtalmology 108: 348-366. [Crossref]
- Rivard MJ, Coursey BM, DeWerd LA, Hanson WF, Saiful Huq M, et al. (2004) Update of AAPM Task Group No. 43 Report: A revised AAPM protocol for brachytherapy dose calculations. Med Phys 31: 633-674. [Crossref]
- Miras H, Terrón JA, Lallena AM (2013) Monte Carlo simulation of COMS ophthalmic applicators loaded with Bebig I25.S16 seeds and comparison with planning system predictions. Phys Medica 29: 670-676. [Crossref]
- Caracappa PF, Rhodes A, Fiedler D (2014) Multi-resolution voxel phantom modeling: a high-resolution eye model for computational dosimetry. Phys Med Biol 59: 5261-5275. [Crossref]
- Pelowitz DB (2011) MCNPX User’s Manual Version 2.7.0. LA-CP-11-00438.
- Lesperance M, Inglis-Whalen M, Thomson RM (2014) Model-based dose calculations for COMS eye plaque brachytherapy using an anatomically realistic eye phantom. Med Phys 41: 021717. [Crossref]
- Goorley T, James M, Booth T, Brown F, Bull J, et al. (2012) Initial MCNP6 Release Overview. Nucl Technol 180: 298-315.
- Martz RL (2014) The MCNP6 Book On Structured Mesh Geometry: User’s Guide. LA-UR-11-05668-rev8
- Abaqus/CAE User’s Guide (2014) Dassault Systèmes Simulia Corp., Providence, RI, USA.
- Fonseca GP, Reniers B, Landry G, White S, Bellezzo M, et al. (2014) A medical image-based graphical platform – Features, applications and relevance for brachytherapy. Brachytherapy 13: 632-639. [Crossref]
- Yoriyaz H, Sanchez A, dos Santos A (2005) A new human eye model for ophthalmic brachytherapy dosimetry.Radiat Prot Dosimetry115: 316-319. [Crossref]
- Sudhyadhom A (2017) Determination of mean ionization potential using magnetic resonance imaging for the reduction of proton beam range uncertainties: theory and application.Phys Med Biol62: 8521-8535. [Crossref]
- Geuzaine C, Remacle JF (2009) Gmsh: a three-dimensional finite element mesh generator with built-in pre- and post-processing facilities. Int J Numer Meth Eng 79: 1309-1331.


