In Canada, population over the age of 65 account for 17% of the country’s population in 2016, and for the first time the older adult population has surpassed that of children (0-14 years). The rapidly increasing older adult population creates a critical demand for health and social services tailored to their needs. The emphasis on “aging in place” in Canada and inadequate government funding of institutional long–term care beds have led to increased dependence on primary care and community services, such as adult day programs, to maintain their health and well-being. The study explores the geographic accessibility of older adults to primary care physicians (PCPs) and adult day programs (ADPs) within the Toronto Census Metropolitan Area, Canada’s largest urban centre. The study uses various methods including the two-step floating catchment area (2SFCA) accessibility model and location quotient to examine the spatial mismatch between the supply of and demand for PCPs and ADPs. A diverse range of data are used, including the 2016 geo-referenced Canadian census, location of PCPs and ADPs and road network. Multiple travel thresholds from 1 kilometre to 10 kilometres are used to calculate geographic accessibility for older adults with a low mobility (no access to a vehicle) and a higher mobility (with access to a personal vehicle). The results indicate that the City of Toronto consistently has high accessibility scores for all travel thresholds; accessibility is high in suburban areas along the fringes of the Toronto CMA when travelling up to 10 kilometres to reach a service location. Thematic mapping shows that ADPs are generally in close proximity to PCPs. The paper provides implications for identifying service shortage areas, developing programmes and health promotion strategies and enhancing the delivery of primary care and community service relevant for older adults.
As demographic transition progresses in Canada, a large number of aging baby boomers have accelerated the shift in the age and sex structure of the population. From 1982 to 2012 the population aged 65 and over had doubled, while the number of children has only grown by 2.5% [1]. This trend continued until 2015 when older adults finally outnumbered those aged 0 to 14 [2]. In 2017, one out of six Canadians were at least 65 years of age at 16.9% of the population, compared to those aged 0 to 14 comprising 16.0% [3].
The Canadian healthcare system faces many challenges to meet the growing healthcare demand among older adults. These challenges include a general shortage of physicians in Canada, the longer life expectancy, decreased funding on healthcare including long-term healthcare, and increased health complications among older adults [4-7]. Since Canada’s birth rate has remained steady for about 20 years, the increase in proportion of older adults has caused the dependency ratio (number of individuals aged 0 to 14 and 65 or older per 100 people aged 15 to 64) to increase and will continue to do so in the upcoming years. Advances in technology, the field of medicine and institutions addressing global health care access has allowed for individuals to live longer and treat their ailments, especially in developed nations. However, wait times in the Canadian health care system have become longer while hospitals discharge patients faster [8,9]. When it comes to older adults who are more vulnerable and use health care services more often, their access has been cut even further. The Canadian Institute for Health Information reported 143,219 individuals in hospital continuing care and private residential care beds in the province of Ontario, most of whom are 65 or older [10]. Statistics Canada reported about 2,251,000 individuals aged 65 or older in Ontario [11]. The monitoring and treatment of chronic conditions for over two million older adults are now mainly the onus of primary care physicians (PCPs) and community-based services, without intervention from specialists or treatment through in-hospital services [12].
Adult day services, also referred to as adult day programs, are very effective community-based services utilized by older adults across North America. They have been shown to increase the overall well-being of participants and play a role in chronic disease management [13-15]. Good geographic access to healthcare and social program provide a benefit to older adults in maintaining health and well-being. However, the intersection of these two types of supplementary services that critical to the wellbeing of older adults has rarely been investigated. The study explores the geographic accessibility of older adults to primary care physicians (PCPs) and adult day programs (ADPs) within the Toronto Census Metropolitan Area (CMA), Canada’s largest urban centre. It uses various methods including the two-step floating catchment area (2SFCA) accessibility model and location quotient to examine the spatial mismatch between the supply of and demand for PCPs and ADPs. A diverse range of data are used, including the 2016 geo-referenced Canadian census, location of PCPs and ADPs and road network. Multiple travel thresholds from 1 kilometre to 10 kilometres are used to calculate geographic accessibility for older adults with a low mobility (no access to a vehicle) and a higher mobility (with access to a personal vehicle). The study yields provide implications for identifying service shortage areas, developing programmes and health promotion strategies and enhancing the delivery of primary care and community service relevant for older adults.
In Canada, the emphasis on “aging in place” and inadequate funding of long-term-care beds have led to increased dependence on primary care, delivered mainly by family physicians to older adults living in private and community settings. Primary care physicians play a pivotal role in delivering primary healthcare to the older population in the Canadian healthcare system. They are also gate keepers to specialists [16]. Older adults have a higher risk of developing chronic conditions such as adult onset diabetes, lung disease, high blood pressure, heart disease, and mental illness. They are also large users of medical services and their use and population will only continue to grow [17]. As children become adults, the younger cohorts of the population move out of their family homes and the older cohort is referred to as empty nesters. Aging in place, which refers to older adults who choose or are forced to continue living independently in their private dwellings, becomes more difficult when there is less support and more responsibility placed on parents or grandparents to be self-reliant at an age when they are more fragile and more likely to have health complications. Those who do not have a partner or spouse to age alongside are even more vulnerable, especially older women since they have longer life expectancies than men. As mobility decreases this creates great implications when it comes to accessing primary care physician on a regular basis. Problems also arise when older adults find it difficult to maintain themselves and their household while dealing with a decline in health [18,19].
Adult day programs have offered opportunities for these vulnerable populations to gain access to a range of services. The first ADP to open in Canada was Baycrest Day Centre in 1959. ADPs offer counseling, support, social activities, health promotion, disease prevention, creative arts, meals, and education to older adults with different needs. Programming ranges from providing help to those who suffer from Alzheimer’s or Dementia to organizing social activities for older individuals to participate. Studies show that being social and amongst others contributes to the well-being of an individual and can accelerate their health recovery [20-22]. Social services work as a medium between primary care accessibility and aging in place to improve and maintain the overall well-being of the older population. Noninstitutionalized individuals who age in place alone or with family caregivers benefit from ADPs that offer opportunity for older adults to interact with others when they would otherwise be isolated in their homes [13].
Previous research has investigated the relationship between health care utilization and distance traveled by individuals. A distance decay trend is evident, whereby health care use and disease burden increase as distance between home to primary care physician increases [23-28]. Geographic access is considered a critical factor of accessing healthcare in Canada where the healthcare system is publically funded, and therefore, older adults in Canada face a less daunting barrier to care related to insurance, compared to counterparts in a private healthcare system [17,29].
Geographic, or spatial, accessibility refers to the relative ease with which individuals from one location can reach other specified zones or point locations and can be measured by geographical models such as the two-step floating catchment area (2SFCA) model and its variations [30-36]. The 2SFCA model integrates supply and competition for demand, while considering the number of service providers at each location, the population that falls within their catchment area and transportation pathways that allow individuals to travel to service locations. Spatial inequalities in accessing healthcare services are found between urban and non-urban areas that are characterized by different population densities and numbers of healthcare services; they also exist across different residential neighbourhoods in a city [37-38]. It is within the context of the changing demographics in Canada and the unequal distribution of health and social services that this study is conducted, in order to understand the geographic accessibility to primary care physicians and adult day programs of a vulnerable population with a high need for such services [39-43].
Table 1 provides a summary of the diverse datasets used in this study. The main data are extracted from the Canadian Medical Directory providing information on the location of primary care physicians and Census providing information on older adult population, census geographic boundary (i.e., census tract, census subdivision, and census metropolitan area) and road network, and various websites on location of adult day programs. Data on adult day program is retrieved from thehealthline.ca Information Network by Local Health Integration Network (LHIN) regions. Five LHIN regions intersect the study area: LHIN-05 Central West, LHIN-06 Mississauga Haltom, LHIN-07 Toronto Central, LHIN-08 Central and LHIN-09 Central East. Each adult day program was categorized by LHIN region and had an individual web page with attributes including name, address, phone number, accessibility (for those with a physical disability), cost and hours. The data of ADPs from the five LHIN regions that intersected the study area were retrieved from thehealthline.ca Information Network using the WebScraper.io Google Chrome extension.
Table 1. Datasets used in the study
Name |
Description |
Scale/Geometry |
Format |
Year |
Source |
Total population by broad age groups: 0-14, 15-64 & 65+ years |
Population counts and percentages in the Toronto CMA |
Census tract |
Excel file |
2016 |
Census of population – Statistics Canada |
2016 Census of population - Boundary files |
Census tracts/subdivisions that fall within the Toronto CMA and the boundary of the Toronto CMA |
Census tract; Census subdivision; Census metropolitan area |
Shapefile |
2016 |
Census of population – Statistics Canada |
2016 Census of population – Road network file |
Canada’s national road network file including street names, types and directions |
Road network |
Shapefile |
2016 |
Census of population – Statistics Canada |
Former municipality boundaries |
Boundaries of the former six municipalities in the City of Toronto: Etobicoke, York, former Toronto, North York, East York and Scarborough) |
Municipality (historical) |
Shapefile |
2012 |
Data catalogue – City of Toronto |
Adult day programs |
Attributes of every ADP available in the five LHIN regions that intersect the Toronto CMA |
Address |
Excel file |
2017 |
thehealthline.ca Information Network |
Canadian Medical Directory |
Locations of primary care physicians in the Toronto CMA |
Postal Code |
Shapefile |
2017 |
CMC |
Thematic mapping: Choropleth maps are used to visualize the distribution of older adults in the Toronto CMA, the distribution of primary care physicians and adult day programs. These maps enable an understanding of the broad geographic and sociocultural context of the study.
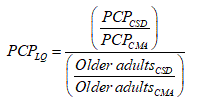
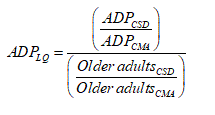
Location quotient: The location quotient (LQ) is a crude measure which quantifies how concentrated a feature is in an area in relation to the larger region. It is a ratio of percentages. A LQ over 1 generally indicates a relative over-representation of the feature, whereas a LQ under the value of 1 indicates an under-representation. The further the LQ value is away from 1, the more concentrated (over-represented) or dispersed (under-represented) the feature is in a given area. LQ is calculated per Census Subdivision (CSD) in the Toronto CMA for PCPs and ADPs separately using the following formula:
ADPs were then substituted into the equation to calculate the ADP location quotient:
2SFCA accessibility measure: The two-step floating catchment area (2SFCA) accessibility measure was used to assign each census tract in the study area an accessibility score to PCPs and ADPs. It is a simplified version of a gravity measure commonly used to calculate accessibility to physicians and integrating supply and demand. The first step of the method calculates physician-to-population ratios for each physician location [31]:
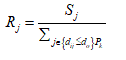
where Rj is the calculated ratio, Pk is the population of census tract k whose centroid falls within the catchment area (dkj ≤ d0), Sj is the number of physicians at physician location j, and dkj is the travel threshold between k and j. The second step is to sum the physician-to-population ratios which fall within the travel threshold of each census tract threshold [31]:
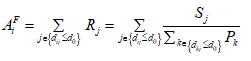
Where  is the accessibility score of location i, Rj is the physician-to-population ratio at physician location j which falls into the threshold of location i, and dij is the travel time between i and j. This method was performed using the four travel thresholds as catchment areas for the census tract centroids, reduced PCP locations and reduced ADP locations. ADP locations were treated as the same due to missing data on their program capacity, while the PCP calculation considered the number of physicians at each location. The resulting scores were multiplied by a factor of 10,000 for analysis purposes.
For the travel network, the Topology Checker plugin in QGIS 2.18.7 was used to calculate errors (disconnected roads) in the dataset. The v.clean tool (via the GRASS GIS extension) was used to fix these errors through three commands: snap, break and remove dangles. Completed successively, errors in the dataset were removed and a new road network file was exported. A network dataset was created in ArcMap 10.5.1 using the new road network file and selected within the Network Analyst extension. Census tract centroids were created, and their respective older adult population counts were spatially joined. A 1km travel threshold was used to calculate access to services within walking distance. A 2km threshold was used to calculate access to services within biking distance. A 5km threshold was used to calculate access to services by bus or car. Since the main method of transportation for individuals in suburban areas is by car, an additional 10km threshold was used to reflect those in the 905-region (outside the City of Toronto) who are more mobile.
Geographic distribution: Figures 1 and 2 depict the spatial distribution of older adults, PCPs and ADPs in the Toronto Census Metropolitan Area. The residential pattern of the older adult population in the Toronto CMA shows a scattered pattern. Brampton and Mississauga, to the west of the City of Toronto, are associated with a lower proportion of older adults. There are small clusters of census tracts with a higher proportion of older adults (26% or greater) along the northern border of the City of Toronto (Steeles Ave), along Lake Ontario in southern Oakville, in Rosedale (Toronto) and in Don Mills (North York). About 55 census tracts within the Toronto CMA have populations with at least 26% of individuals aged 65 or older (about 5% of all census tracts). Most of these census tracts are within the City of Toronto.
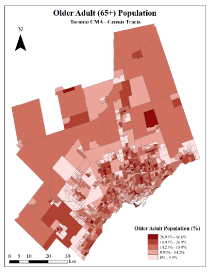
Figure 1. Spatial distribution of older adults in Toronto CMA.
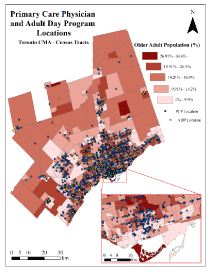
Figure 2. Spatial distribution of primary care physicians, adult day programs and older adults in Toronto CMA.
An overwhelmingly larger number of primary care physicians are located within the City of Toronto, with a dense cluster in the downtown core of Toronto where major hospitals are located. This can be attributed to the high population density in the city core and the traditional location practice of physicians around major hospitals. PCPs and ADPs are clustered around census tracts with a higher older adult population percentage in some areas, such as Brampton and along Lake Ontario in Oakville, Toronto, Pickering and Ajax. There are a few outliers scattered amongst subdivisions which stand alone, such as within Caledon and New Tecumseth. There is also a linear pattern visible from the downtown Toronto at Lake Ontario north through Richmond Hill, Aurora and Newmarket. Generally, where PCPs and ADPs are in close proximity to each other, with a few outliers.
Most of the older adult population of the Toronto CMA is located within the southern portion of the area (Figure 3). Most of the population lives within Scarborough, North York, former Toronto and Mississauga with proportion of older adults decreasing outwards from the downtown Toronto core. The same can be said with the distribution of total PCPs in the CMA. This resulted in former Toronto showing an over-representation of PCPs in the location quotient calculation. Oakville, Brampton, Mississauga, Etobicoke, East York, North York, Richmond Hill and Newmarket indicated an adequate number of PCPs in relation to their respective older adult populations out of the whole CMA. The remaining CSDs are under-represented in this aspect, with Orangeville acting as an outlier (high PCPs).
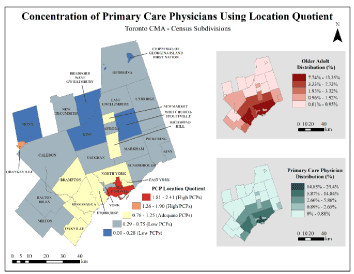
Figure 3. Location quotient scores of primary care physicians per census subdivision in Toronto CMA.
Although the distributions of ADPs follow the same pattern as that of PCPs (Figure 4), the calculated location quotient provided much different results. Former Toronto had an adequate number of ADPs to serve the older adult population in this area. Orangeville was one of the few consistent CSDs between results in Figures 3 and 4; it had an over-representation of ADPs. Mississauga and Brampton had a low number of ADPs in relation to their older adult population. Caledon, Vaughan, Aurora and Uxbridge showed a high amount of ADP representation.
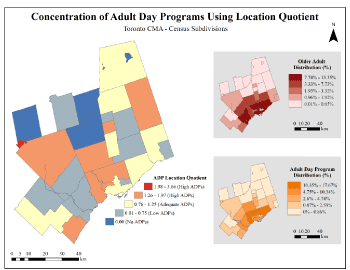
Figure 4. Location quotient scores of primary care physicians per census subdivision in Toronto CMA
Spatial pattern of Location Quotient: The calculated location quotient for PCPs and ADPs at the Census Subdivision level are reported in Table 2 and visualized in Figures 3 and 4. Most of the older adult population of the Toronto CMA is located within the southern portion of the CMA (Figure 3). Most of the population lives within Scarborough, North York, former Toronto and Mississauga with proportion of older adults decreasing outwards from the downtown Toronto core. The same can be said with the distribution of total PCPs in the CMA. This resulted in former Toronto showing an over-representation of PCPs in the location quotient calculation. Oakville, Brampton, Mississauga, Etobicoke, East York, North York, Richmond Hill and Newmarket indicated an adequate number of PCPs in relation to their respective older adult populations out of the whole CMA. The remaining CSDs are under-represented in this aspect, with Orangeville acting as an outlier (high PCPs).
Table 2. Location quotient per census subdivision for PCPs and ADPs
Municipality |
PCP Proportion |
ADP Proportion |
Older Adult
Proportion |
PCP Location
Quotient |
ADP Location
Quotient |
Ajax |
1.12% |
0.86% |
1.53% |
0.73 |
0.56 |
Aurora |
0.60% |
1.29% |
0.84% |
0.71 |
1.53 |
Bradford West Gwillimbury |
0.11% |
0.00% |
0.47% |
0.23 |
0.00 |
Brampton |
5.86% |
3.45% |
7.73% |
0.76 |
0.45 |
Caledon |
0.71% |
1.29% |
1.02% |
0.69 |
1.26 |
Chippewas of Georgina Island First Nation |
0.00% |
0.00% |
0.01% |
0.00 |
0.00 |
East Gwillimbury |
0.30% |
0.43% |
0.41% |
0.74 |
1.06 |
East York |
1.55% |
1.29% |
1.92% |
0.81 |
0.67 |
Etobicoke |
5.43% |
12.50% |
7.17% |
0.76 |
1.74 |
Georgina |
0.43% |
0.86% |
0.78% |
0.55 |
1.11 |
Halton Hills |
0.69% |
0.43% |
0.95% |
0.72 |
0.45 |
King |
0.11% |
0.00% |
0.44% |
0.25 |
0.00 |
Markham |
3.36% |
2.59% |
5.82% |
0.58 |
0.44 |
Milton |
0.84% |
1.29% |
1.18% |
0.71 |
1.09 |
Mississauga |
10.19% |
7.76% |
11.87% |
0.86 |
0.65 |
Mono |
0.02% |
0.00% |
0.18% |
0.12 |
0.00 |
New Tecumseth |
0.52% |
0.43% |
0.76% |
0.68 |
0.57 |
Newmarket |
1.53% |
0.86% |
1.35% |
1.14 |
0.64 |
North York |
14.84% |
17.67% |
13.35% |
1.11 |
1.32 |
Oakville |
3.70% |
4.31% |
3.29% |
1.13 |
1.31 |
Orangeville |
0.88% |
1.72% |
0.47% |
1.87 |
3.66 |
Pickering |
0.82% |
1.29% |
1.57% |
0.52 |
0.82 |
Richmond Hill |
2.65% |
3.88% |
3.32% |
0.80 |
1.17 |
Scarborough |
8.55% |
12.93% |
12.47% |
0.69 |
1.04 |
Toronto |
29.40% |
10.34% |
12.19% |
2.41 |
0.85 |
Uxbridge |
0.28% |
0.86% |
0.44% |
0.64 |
1.97 |
Vaughan |
3.40% |
6.47% |
5.07% |
0.67 |
1.27 |
Whitchurch-Stouffville |
0.24% |
0.43% |
0.85% |
0.28 |
0.50 |
York |
1.87% |
4.74% |
2.55% |
0.73 |
1.86 |
Although the distributions of ADPs follow a similar pattern as that of PCPs (Figure 4), the calculated location quotient shows different results. The city core (or the former Toronto census subdivision before the 1996 amalgamation) is associated with a high LQ (PCP) value of 2, as the area has an abundant number of ADPs, where as the area has an under presentation of older adult population (LQ ADP = 0.84). Orangeville in the suburbs is one of the few CSDs that consistently had an over-representation of ADPs and PCPs, as evident by its large LQ values. Mississauga and Brampton had low number of ADPs relative to their older adult population. Caledon, Vaughan, Aurora and Uxbridge showed a high amount of ADP representation.
Figures 5 to 8 provide a detailed geo-visualization of the calculated E2SFCA accessibility scores at a census travel, for PCPs and ADPs separately and by different hypothetical travel distance thresholds representing different transportation modes. Tables 3 and 4 provide the descriptive statistics for each 2SFCA accessibility scores, broken down for the City of Toronto and the suburbs. For PCP accessibility, the downtown core of Toronto shows the highest accessibility scores for individuals who may walk or bike to their physician or adult day program. Most suburban areas around the CMA had an accessibility score of 0.00 within the 1km catchment area, indicating a distance decay pattern from the center of downtown Toronto (Figure 5). This pattern was magnified when the 2km catchment area was used for the measure. The accessibility measures using both 1km and 2km thresholds follow the same pattern as the distribution of PCPs (Figure 2), where there is a liner pattern of high accessibility and PCPs along Lake Ontario, clusters within Mississauga and Brampton, overall high accessibility in Toronto and a linear pattern of high accessibility from downtown Toronto north to Newmarket.
Table 3. Descriptive statistics of PCP accessibility in the 416 and 905 area codes in Toronto CMA
|
2SFCA Accessibility Measure – Primary Care Physicians |
Catchment Area |
1km |
2km |
5km |
10km |
Area |
416 |
905 |
416 |
905 |
416 |
905 |
416 |
905 |
Count |
570 |
581 |
570 |
581 |
570 |
581 |
570 |
581 |
Minimum |
0.00 |
0.00 |
0.00 |
0.00 |
0.00 |
0.00 |
0.00 |
0.00 |
Maximum |
1525.86 |
532.80 |
591.50 |
2000.00 |
206.48 |
124.18 |
128.78 |
103.96 |
Sum |
40469.51 |
13762.79 |
43704.17 |
24477.19 |
41683.68 |
23497 |
45408.52 |
24499.89 |
Mean |
70.65 |
23.69 |
76.67 |
42.13 |
73.13 |
40.44 |
79.66 |
42.17 |
Standard Deviation |
140.48 |
61.19 |
94.05 |
95.05 |
49.02 |
24.31 |
31.05 |
17.47 |
Table 4. Descriptive statistics of ADP accessibility in the 416 and 905 area codes in Toronto CMA.
|
2SFCA Accessibility Measure – Adult Day Programs |
Catchment Area |
1km |
2km |
5km |
10km |
Area |
416 |
905 |
416 |
905 |
416 |
905 |
416 |
905 |
Count |
570 |
581 |
570 |
581 |
570 |
581 |
570 |
581 |
Minimum |
0.00 |
0.00 |
0.00 |
0.00 |
0.00 |
0.00 |
0.00 |
0.00 |
Maximum |
58.53 |
58.82 |
42.59 |
1000.00 |
8.44 |
17.02 |
7.13 |
14.49 |
Sum |
1226.82 |
489.73 |
1809.87 |
2128.41 |
1749.95 |
1297.60 |
1758 |
1303.73 |
Mean |
2.15 |
0.84 |
3.18 |
3.66 |
3.07 |
2.23 |
3.09 |
2.24 |
Standard Deviation |
6.53 |
4.49 |
5.04 |
41.70 |
1.57 |
2.42 |
0.98 |
1.45 |
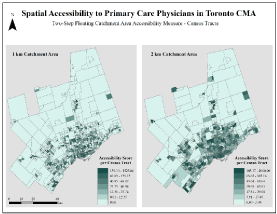
Figure 5. Spatial accessibility to PCPs using 2SFCA method with 1km and 2km catchment areas
The 1km and 2km scores indicate many census tracts with little to no accessibility to ADPs within the Toronto CMA (Figure 4). Due to the very small amount of ADP locations in relation to the study area, the calculation resulted with census tracts that had one ADP or no ADPs within a 1km proximity. The accessibility scores follow where ADPs are located and are scattered. The measure based on a 2km catchment shows a more clustering pattern in York, Etobicoke, Scarborough, Mississauga and Brampton, indicating areas where older adults are in biking distance of an ADP.
The PCP accessibility measure by car and transit shows an increase in accessibility for census tracts across the Toronto CMA. With the 5km threshold, Georgina, New Tecumseth, Uxbridge and Orangeville have high accessibility measures (Figure 7). There are two distinct patterns of high accessibility scores in Etobicoke and former Toronto within the City of Toronto. Accessibility remains high in the same areas of Brampton, Mississauga and Oakville as they did with the 2km PCP measure. The linear pattern from Toronto to Newmarket is distinct as well, indicating that travelling by vehicle may be the best way for older adults in this area to reach primary care physicians. The 10km measure showed the highest accessibility again in Etobicoke and former Toronto, but also census tracts in Brampton and Mississauga which previously had low accessibility scores. Halton Hills, Caledon and additional areas of Uxbridge increased in accessibility.
The ADP accessibility measure for car and transit indicates increased areas with accessibility than the measure for walking and biking (Figures 6 and 8). For both 5km and 10km thresholds, high scores are clustered in Etobicoke and Vaughan and continue in a linear pattern northeast into Richmond Hill, Aurora and Newmarket. A cluster of high accessibility is also found in Oakville and Mississauga. Georgina, Uxbridge, New Tecumseth and Caledon also have higher accessibility than Markham, Pickering and East Gwillimbury in the 10km threshold results (Figure 8). There is also a cluster of high accessibility scores in East York and Scarborough.
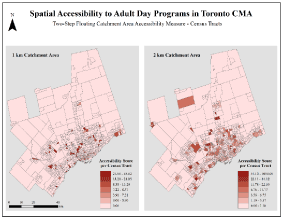
Figure 6. Spatial accessibility to ADPs using 2SFCA method with 1km and 2km catchment areas
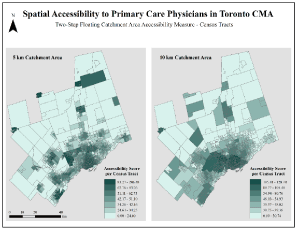
Figure 7. Spatial accessibility to PCPs using 2SFCA method with 5km and 10km catchment areas
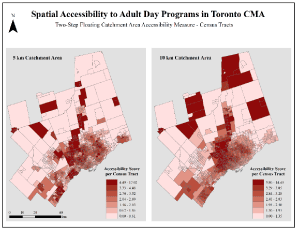
Figure 8. Spatial accessibility to ADPs using 2SFCA method with 5km and 10km catchment area
The results indicate that ADPs are spatially distributed and clustered near PCPs across the Toronto CMA, which are both clustered around the dispersed distribution of older adults in 2016. Areas in the suburbs have low accessibility to PCPs and ADPs for older adults who may have to walk to receive health care service or participate in an adult day program. The analyses indicate that 416 regions had an average score of 70.65 for PCP access and 2.15 for ADP access, while the 905 region average scores of 23.69 and 0.84, respectively. Although areas such as Georgina, Caledon, Markham and Vaughan were built to support car culture, older adults that have low mobility may not be able to operate vehicles and may need assistance or increased transit service to reach services. On the other hand, older adults who can still operate vehicles are more likely to travel further to reach services, and thus, individuals living in areas that appear to be underserviced can travel easily to other CSDs to receive care.
Another factor to consider is that Census Subdivisions with lower accessibility scores may also associate with a low older adult population. For instance, in Table 2 North York has the highest proportion of older adults in the CMA with 13.35%, while East Gwillimbury has only 0.41% and frequently had a low accessibility score. This is important to note, especially in areas where car culture is prominent, since underserviced areas may seem so in calculations but there may be a small number of older adults that are able to travel further to reach a PCP. This also applies inversely for areas with a low proportion of older adults but the perception that it is over serviced, such as Orangeville. Orangeville has 0.47% of the population of older adults in the Toronto CMA but had high location quotient scores (Figures 3 and 4) as well as high accessibility scores with the 2-10km thresholds. One can assume that Orangeville services many adults from surrounding CSDs and thus, has many PCP and ADP locations in proportion to its older adult population.
The use of census tract centroids for the 2SFCA method is suitable when census tracts are small and high in population density, such as within the urban core of the 416 region, but for suburban areas such as Uxbridge, Georgina or Caledon, running the measure using dissemination areas or using satellite imagery to identify areas of residential neighbourhoods would give a more realistic idea of where these groups actually reside. For instance, Mono is only one census tract and its population density is not near the centroid but rather closer to the southwest portion of the CSD and Orangeville. The 2SFCA leaves out opportunities that may have been available for older adults that fall outside the boundaries of the Toronto CMA, such as ADPs or PCPs located in Whitby or Oshawa to the east and Burlington or Hamilton to the west.
Due to the unavailability of data, the capacity of each ADP was not used as a gravity measure in the model and each ADP was treated as the same in terms of capacity, whereas the attractiveness of PCPs may depend on the number of physicians and medical offices at each location, language spoken by physician, gender of physician or other factors. In addition, some individuals may not have access to a vehicle and some ADPs may not subsidized and may charge a fee for service. This creates an economic barrier to services for this already vulnerable demographic. However, such data is not readily available.
Despite these limitations, the study provides a timely visualization of the distribution of PCPs and ADPs in relation to the residential pattern of older adults from the latest Canadian census. It also uses geo-spatial analytic methods to compute spatial accessibility to primary care physicians and adult day programs, each providing critical primary healthcare and community-based service to the fast-growing yet vulnerable older adult population. Future research can explore how the spatial variation of geographic access to PCPs and ADPs is related to the socioeconomic characteristics of older adults living in different neighbourhoods, in order to identify under-service area that is associated with a high proportion of marginalized low-income older adults. It is also of great importance to examine the healthcare access among older immigrants who comprise an increasing share of the population in large Canadian urban centres. Culturally distinct newcomer older adults may be further disadvantaged due to their length of residency in Canada, their socioeconomic status and language proficiency in communicating with PCPs and service providers.
The older adult population in Canada is expected to continue to grow rapidly. The paper provides important implications for identifying service shortage areas, developing programmes and health promotion strategies and enhancing the delivery of primary care and community service relevant for older adults. PCPs and ADPs are generally clustered together, with a few outliers, across the Toronto CMA in areas with high percentages of older adult populations. The number of community services that the provincial government is relying on to maintain their well-being isn’t keeping pace the growing older adult population, considering that there are only 232 available to over 850,000 older adults. More ADPs should be developed to accommodate them but data on the capacity and cost of existing ADPs is needed to properly evaluate their effectiveness and accessibility considering that additional factors such as subsidy, services offered, and eligibility come into play.
- Anderson KA, Dabelko-Schoeny H, Johnson TD (2012) The state of adult day services: Findings and implications from the MetLife national study of adult day services. J Appl Gerontol 32: 729-748. [Crossref]
- Canadian Institute for Health Information (2012) Health care in Canada, 2012: A focus on wait times.
2021 Copyright OAT. All rights reserv
- Canadian Institute for Health Information (2017) CCRS Profile of Residents in Continuing Care Facilities 2016-2017.
- Cao Y, Stewart K, Kalil R (2016) Geographic patterns of end-stage renal disease and kidney transplants in the Midwestern United States. Appl Geogr 71: 133-143.
- Dai D, Wang F (2011) Geographic disparities in accessibility to food stores in southwest Mississippi. Environ Plann B 38: 659-677.
- Chan A, Raman P, Ma S, Malhotr R (2015) Loneliness and all-cause mortality in community-dwelling elderly Singaporeans. Demogr Res 32: 1361-1382.
- Clark MC, Czaja SJ, Weber RA (1990) Older adults and daily living task profiles. Hum Factors 32: 537-549. [Crossref]
- Donohoe J, Marshall V, Tan X, Camacho FT, Anderson R, et al. (2016) Evaluating and comparing methods for measuring spatial access to mammography centers in Appalachia. Health Services and Outcomes Research Methodology 6: 22-40.
- Fausset CB, Kelly AJ, Rogers WA, Fisk AD (2011) Challenges to Aging in Place: Understanding Home Maintenance Difficulties. J Hous Elderly 25: 125-141. [Crossref]
- Fransen K, Neutens T, Farber S, De Maeyer P, Deruyter G, et al. (2015). Identifying public transport gaps using time-dependent accessibility levels. J Transp Geogr 48: 176-187.
- Gaugler JE, Zarit SH (2001) The effectiveness of adult day services for disabled older people. J Aging Soc Policy 12: 23-47. [Crossref]
- Hendryx M, Green CA, Perrin NA (2008) Social support, activities, and recovery from serious mental illness: STARS study findings. J Behav Health Ser R 36: 320-329. [Crossref]
- Hindhede AL, Bonde A, Schipperijn J, Scheuer SH, Sørensen SM, et al. (2016). How do socio-economic factors and distance predict access to prevention and rehabilitation services in a danish municipality? Prim Health Care Res 17: 578-585.
- Kim HY, Choi YH (2011) Factors affecting depression in elderly vulnerable people living alone. Korean Academy of Community Health Nursing 22: 355-364.
- Lee G, Hong I (2013) Measuring spatial accessibility in the context of spatial disparity between demand and supply of urban park service. Landscape Urban Plan 119: 85-90.
- Love D, Lindquist P (1995) The geographical accessibility of hospitals to the aged: A geographic information systems analysis within Illinois. Health Serv Res 29: 629-651. [Crossref]
- Lum JM, Shields J, Evans B (2016) Co-constructing performance indicators in home and community care: Assessing the role of NGOs in three Canadian provinces. Canadian Journal of Nonprofit and Social Economy Research 7: 46-67.
- Lum JM, Aikens A (2009) From Denmark to Deep River: integrating care in small and rural communities in Ontario. Healthc Pap 10: 50-57. [Crossref]
- Luo W, Wang F (2003) Measures of spatial accessibility to health care in a GIS environment: Synthesis and a case study in the Chicago region. Environ Plann B 30: 865-884.
- Luo W, Qi Y (2009) An enhanced two-step floating catchment area (E2SFCA) method for measuring spatial accessibility to primary care physicians. Health Place 15: 1100-1107. [Crossref]
- McGrail MR (2012) Spatial accessibility of primary health care utilising the two-step floating catchment area method: an assessment of recent improvements. Int J Health Geogr 11: 1-12.
- Ministry of Health and Long-Term Care. (2008) Ontario wait times.
- Ng E, Wilkins R, Pole J, Adams OB (1997) How far to the nearest physician? Health Reports 8: 19-31.
- Ngui AN, Vanasse A (2012) Assessing spatial accessibility to mental health facilities in an urban environment. Spatial and Spatio-temporal Epidemiology 3: 195-203. [Crossref]
- Nugent WC (2000) In health care, geography is destiny. J Thorac Cardiovasc Surg 120: 976-977. [Crossref]
- Ontario Association of Speech-Language Pathologists and Audiologists (2015) Pushed out of hospital, abandoned at home after twenty years of budget cuts, Ontario’s health system is failing patients. Toronto, ON: OSLA.
- Rosenberg MW, Hanlon NT (1996) Access and utilization: a continuum of health service environments. Soc Sci Med 43: 975-983. [Crossref]
- Rourke J (2005) Strategies to increase the enrolment of students of rural origin in medical school: recommendations from the Society of Rural Physicians of Canada. Can Med Assoc J 172: 62-65.
- Seidel D, Hjalmarson J, Freitag S, Larsson TJ, Brayne C, et al. (2011) Measurement of stressful postures during daily activities: An observational study with older people. Gait Posture 34: 397-401.
- Statistics Canada (2012) Annual Demographic Estimates: Canada, Provinces and Territories. Statistics Canada Catalogue no. 91-215-X. Ottawa. ON: Statistics Canada.
- Statistics Canada (2015). Annual Demographic Estimates: Canada, Provinces and Territories. Statistics Canada Catalogue no. 91-215-X. Ottawa. ON: Statistics Canada.
- Statistics Canada (2017a) Annual Demographic Estimates: Canada, Provinces and Territories. Statistics Canada Catalogue no. 91-215-X. Ottawa. ON: Statistics Canada.
- Statistics Canada (2017b) Census of population: Age-sex profile. Ottawa, ON: Statistics Canada.
- Sutherland JM, Crump RT (2013) Alternative level of care: Canada's hospital beds, the evidence and options. Healthc Policy 9: 26-34. [Crossref]
- Svidén GA, Tham K, Borell L (2004) Elderly participants of social and rehabilitative day centres. Scand J Caring Sci 18: 402-409. [Crossref]
- Tai WTC, Porell FW, Adams EK (2004) Hospital choice of rural Medicare beneficiaries: patient, hospital attributes, and the patient–physician relationship. Health Serv Res 39: 1903-1922. [Crossref]
- Wang L (2007) Immigration, Ethnicity, and Accessibility to Culturally Diverse Family Physicians Health Place 13: 656-671. [Crossref]
- Wang L (2014) Immigrant health, socioeconomic factors and residential neighbourhood characteristics: A comparison of multiple ethnic groups in Canada. Applied Geography 51: 90-98.
- Wang L (2018) Unequal spatial accessibility of integration-promoting resources and immigrant health: a mixed-methods approach. Applied Geography 92: 140-144.
- Wang L, Rosenberg M, Lo L (2008) Ethnicity and utilization of family physicians: A case study of Mainland Chinese immigrants in Toronto, Canada. Soc Sci Med 67: 1410-1422. [Crossref]
- Williams S, Wang F (2014) Disparities in accessibility of public high schools, in metropolitan Baton Rouge, Louisiana 1990-2010. Urban Geography 35: 1066-1083
- Wiles JL, Leibing A, Guberman N, Reeve J, Allen RE (2012) The meaning of "aging in place" to older people. Gerontologist 52: 357-366. [Crossref]
- Wranik DW, Durier-Copp M (2010) Physician remuneration methods for family physicians in Canada: expected outcomes and lessons learned. Health Care Anal 18: 35-59. [Crossref]