To assess psychometric properties of a recently-designed medical-homeness instrument, the Medical Home Attributes Scale (MHAS), we surveyed clinical practices with NCQA recognition as medical homes. Exploratory factor-analyses of the 25 clinician-rated MHAS items from 228 practices revealed four underlying factors: clinical team interactions, record review/documentation, reviewing patient needs, and quality improvement/monitoring. In multivariable regressions, MHAS scores were 8.5 points higher for multispecialty practices vs. primary-care only practices, and were 5.5 points lower for hospital-owned practices vs. other ownerships. The MHAS, a brief measure of medical-homenness of clinician practices, is highly reliable and sensitive to differences in practice specialty and ownership.
Among the many proposals for health care reform in the United States, one concept that has received increasing interest in recent years is the Patient-Centered Medical Home (PCMH) [1,2]. While numerous definitions have been offered for a PCMH, seven principles underlying the PCMH have been endorsed by four leading physician organizations [3,4]. These principles involve a personal physician, physician-directed medical practice, a whole person orientation, care coordination, quality and safety, enhanced access, and value-based payment.
In spite of the great interest in PCMHs, comparatively little research has been conducted on PCMH measurement. While all primary care clinical practices encompass some of the elements of a PCMH, it is not clear how to measure the extent to which a practice functions as a medical home; that is, its level of “medical homeness.” The Urban Institute identified more than 30 recognition tools for PCMHs [5]. One of the most widely used instruments, developed by the National Committee for Quality Assurance (NCQA), is the Physician Practice Connections – Patient-Centered Medical Home (PPC-PCMH) [5]. First released in 2008 and updated in 2011 and 2014, the PPC-PCMH contains nine standards, such as care management, patient tracking, and registry functions [6]. Thirty percent of the 2008 total PPC-PCMH score was based on the practice's health information technology [7], and some have questioned whether the extensive NCQA documentation process accurately measures homeness [8]. Other PCMH assessment tools emphasize different elements such as quality measurement, patient engagement, self-management support, referral practices, clinical outcomes, or patient experience of care. However, there is no consensus on the optimal mix of these elements, and almost no work has been done that directly compares instruments [9,10].
Under contract with the Centers for Medicare & Medicaid Services (CMS), RTI International (RTI) developed a new instrument, called the Medical Home Attributes Scale (MHAS), to capture key features of medical homeness. To develop the MHAS, we performed an extensive review of literature assessing characteristics and activities of patient centered medical homes as well as the NCQA standards. In this study, we use data collected from a sample of clinical practices to examine the psychometric properties of the MHAS.
Measures
The MHAS was developed following an iterative literature review process by the research team. Based on this review, a list of the key PCMH characteristics and activities were specified to be included in the draft MHAS. These included continuity of care, patient engagement, care coordination, and clinical team integration. Questions related to these aspects were obtained from other PCMH assessment instruments or developed by the research team if such questions were not already available. Where appropriate, questions were tailored specifically to Medicare beneficiaries, as the MHAS was initially developed for use in the evaluation of a Medicare medical home demonstration.
The MHAS consists of two sections. The first section of the questionnaire contains a set of questions regarding practice characteristics. Clinicians reported the practice’s ownership structure, network affiliations (significant relationship with an IPA, an integrated delivery system, or physician hospital organization), multispecialty vs. primary care group, prevalence of Medicare patients, and whether payments were being received from sources other than Medicare to encourage medical home transformation. The second section of the MHAS consists of 25 items organized around six attributes: access/continuity, patient engagement, care coordination, integrated team care, patient feedback, and clinical information systems (see Supplemental File for the items corresponding to the attributes).
Responses to the MHAS quantify the percentage of Medicare patients, visits or hospitalizations affected by each item. Individual items are scored from 0 (no patients or visits) to 4 (75% or more of the Medicare patients). The MHAS was designed to be completed by one or more clinician’s familiar with the services provided to the practice’s Medicare patients, and an office administrator most familiar with the practice characteristics.
Medical home sample and data collection procedures
The MHAS was embedded within a larger study of medical homes in the United States. By late 2010, more than 1,200 clinical practices had been recognized by NCQA as Physician Practice Connections – Patient-Centered Medical Homes (PPC-PCMHs). Recognition is conferred on individual office locations. We obtained the names and addresses of administrators for a random sample of PCMH office locations and sent them invitations to participate in the study with requests to sign data release authorization forms and to complete a hard copy version of the MHAS. A $25 electronic gift card was offered to each office administrator as an incentive to participate. To enhance response, we provided web-based, fax, regular mail, and e-mail reporting options. Follow-up contacts were made by telephone and e-mail to encourage study participation, update lists of providers affiliated with the practice, and check the eligibility status of each practice. All study forms and contact procedures were approved by RTI’s Institutional Review Board.
Factor analyses
We conducted two types of factor analysis to evaluate the item structure of the MHAS. Since the MHAS items are organized in six attribute categories, we began by conducting a confirmatory factor analysis of the instrument. Confirmatory factor analysis is a method for statistically testing a hypothesized item structure. We specified a model with 6 attributes in which each MHAS item loaded only on its proposed attribute. Attributes were permitted to be correlated with one another. We also conducted an exploratory factor analysis of the data. In an explanatory model, no hypothesized structure is imposed on the data, and a factor structure is inferred from the pattern of correlations among the items. We used an oblique rotation that allows factors to be correlated. For both types of analysis, we assessed model fit using both absolute fit measures (the Root Mean Square Error of Approximation (RMSEA) and Standardized Root Mean Square Residual (SRMR)) and incremental fit measures (the Comparative Fit Index (CFI) and the Tucker-Lewis Index (TLI)) [11].
Regression analysis
We estimated one multivariable regression model of MHAS total scores. The explanatory variables in the model were the practice characteristics reported by clinicians in the first section of the MHAS questionnaire. The purpose of this analysis was to determine the extent to which homeness scores were influenced by practice ownership, network affiliations, and payments to encourage medical home transformation. All analyses were performed using Stata 14.0.
Response rates
We contacted a random sample of 941 adult practices that had achieved NCQA medical home recognition to request data release authorizations and completed MHASs. Thirty-one PCMHs that did not serve at least 30 Medicare patients were removed. A total of 265 practices (29.1% response rate) returned MHAS forms. Seventy percent of the practices had achieved Level 3 recognition, the highest recognition level.
Sixty percent of the practices completed all MHAS items, while 14.0% failed to answer 4 or more items. Each item is scored from zero points to a maximum of 4 points. Item scores were imputed (assigned a value of 1) for practices with only 1-3 missing items; those with 4 or more missing items were excluded from further analyses. A total of 228 practices were used for analysis.
Factor analysis results
The first set of factor analyses was designed to confirm the 6 major domains into which MHAS items were categorized in the survey instrument. The initial attempts to conduct confirmatory factor analyses failed because the method’s iterative maximum likelihood procedure failed to converge, meaning that the algorithm could not derive a mathematical solution for the likelihood. Convergence problems continued even for increasingly simpler 3- and 2-factor models. We eventually abandoned the confirmatory approach in favor of an exploratory analysis that placed no restrictions on the number of factors or item loadings.
The exploratory analysis derived four factors with eigenvalues exceeding 1 as shown in Table 1. Most items had loadings exceeding 0.30 on only one factor, but items from different domains were frequently mixed together on a factor. Based on the item content, the factors may be interpreted as clinical team interactions (factor 1), care documentation (factor 2), reviewing patient needs (factor 3), and quality improvement and monitoring (factor 4). The last factor merges the Clinical Information Systems and Patient Feedback domains. The correlation between the first two factors was 0.37. The other factors were relatively independent of one another, with intercorrelations ranging only from -0.13 to 0.23. One unusual item (item 11C: patients update their own records) did not have a loading exceeding 0.30 on any factor. Item 12G was deliberately withheld from the factor analysis because its responses are dependent on the response to item 12F. Item 12G is therefore most closely associated with factor 1. Otherwise, the entire content of the MHAS was associated with one of the four exploratory factors.
Table 1. Exploratory factor analysis loadings, MHAS items.
|
|
Factor Loading |
Item |
Description |
Factor 1 |
Factor 2 |
Factor 3 |
Factor 4 |
12B |
Communicate specialist results |
0.72 |
|
|
|
12F |
Adhere to post-hosp. procedures |
0.70 |
|
|
|
10B |
Respond to messages |
0.66 |
|
|
|
11A |
Materials for self-management |
0.54 |
|
|
|
12D |
See pts. In hospital |
0.53 |
|
|
|
10D |
Same team for urgent care |
0.52 |
|
|
|
10C |
Same team for routine care |
0.42 |
0.31 |
|
|
10A |
Open scheduling |
0.33 |
|
|
|
12E |
Follow-up procedures |
|
0.75 |
|
|
11B |
Reminders |
|
0.64 |
|
|
11D |
Plan of care |
|
0.50 |
|
|
12A |
Record review |
|
0.49 |
|
|
12C |
Know when pt. hospitalized |
0.34 |
0.42 |
|
|
13A |
Meet to discuss pt. needs |
|
|
0.60 |
|
15C |
Disease registries |
|
|
0.58 |
|
13B |
Discuss needs |
|
|
0.37 |
|
13C |
Non-MDs provide clinical care |
|
|
0.34 |
|
15A |
Unnecessary tests |
0.30 |
|
|
0.53 |
14B |
Use pt. data for QI |
|
|
|
0.51 |
15B |
Overdue for care |
|
|
0.41 |
0.44 |
15D |
EMR integrated with system |
|
|
0.35 |
0.41 |
14A |
Pt. experience data collected |
|
0.35 |
|
0.39 |
14C |
Staff manages QI |
|
|
|
0.36 |
12G |
Discharge follow-up time |
X |
|
|
|
11C |
Pts. update their own records |
|
|
|
|
Based on the exploratory factors analysis results, we created an MHAS total score based on all 25 items with scores normalized to range from 0 (lowest possible homeness) to 100 (highest possible homeness score). Additional scoring details are provided in the Supplemental File. Cronbach’s alpha for the 25 items was 0.766. The distribution of MHAS scores among the 228 clinical practices included in this study is shown in the histogram in Figure 1. The mean score was 71.5 in this sample of NCQA recognized practices (SD =12.7; score range = 8 to 100 points).
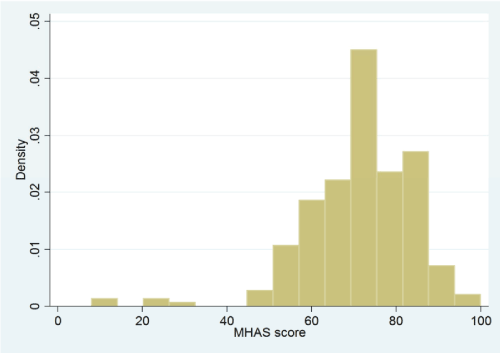
Figure 1. Distribution of MHAS scores among the 228 medical practices participating in the study.
Regression analysis results
Table 2 shows the coefficient estimates obtained by regressing MHAS scores on features of the practices. Scale scores increased as the share of Medicare patients in a practice’s caseload rose. Two other practice features had sizable, statistically significant impacts on MHAS scores. Scores were 8.5 points higher for multispecialty practices compared to primary care only practices, and were 5.5 points lower for hospital-owned practices contrasted with other forms of ownership. Affiliations with an IPA, IDS, or PHO were not significantly related to MHAS scores, nor was receiving payments from non-Medicare sources to promote medical home transformation. Just over half of the sample practices were receiving these payments.
Table 2. Regression Model Estimates for MHAS Scoresa. aN=221 practices; R2 = 0.181; ** = p < 0.001, * = p < 0.02.
Practice-Level Explanatory Variable |
Parameter Estimate |
Standard Error |
Variable mean |
Multispecialty practice |
8.50** |
2.43 |
12.8% |
Physician-owned practice |
-0.85 |
2.01 |
47.4% |
Hospital-owned practice |
-5.51* |
2.26 |
28.5% |
Medicare patient share (%) |
0.226** |
.044 |
24.1 |
IPA, IDS, PHO affiliation |
2.40 |
1.66 |
59.3% |
Medical home payments |
1.81 |
1.68 |
54.2% |
Constant |
64.54 |
2.46 |
--- |
In this study, we conducted a psychometric analysis of the item structure of the MHAS, a recently designed measure of medical homeness. While the instrument did not conform to initial hypotheses about a domain-based structure, an exploratory factor analysis pointed to a four-factor solution with high reliability. All 25 scale items were combined to produce a summary index of medical homeness.
The internal consistency reliability of all MHAS items as measured by Cronbach’s alpha was 0.766. This is higher than the usual recommendation (alpha = 0.70) recommended for a reliable scale for a unidimensional construct [12]. In the absence of a recognized gold standard for medical homes, we were unable to directly evaluate instrument validity but scale scores were sensitive to differences in practice structure and ownership. The attributes measured by the MHAS capture all but one of the PCMH principles endorsed by a consortium of physician organizations, the only exception being a value-added payment structure. The instrument content is also very similar to attributes independently developed by the Oregon PCMH Advisory Committee [13].
Unlike other instruments, the MHAS is based on clinician reports of the care provided to Medicare beneficiaries by a practice. The item structure revealed by factor analysis did not appear to be affected by the denominator used for these assessments (patients, visits, or hospitalizations) since the denominators did not align with factors. However, the regression results indicated that MHAS scores were positively correlated with the proportion of the practice’s patients that were covered by Medicare. It is not clear why this would be, since clinicians are asked to report only about Medicare patients. One possibility is that in practices with comparatively few Medicare beneficiaries, clinicians are less familiar with these patients and therefore more reluctant to report that MHAS attributes apply to a large percentage of them. Alternatively, practices with a greater proportion of Medicare beneficiaries may tailor their systems and services to be responsive to the needs of this patient population, thereby creating structures that are more strongly associated with the domains of medical homeness captured by the MHAS.
Several features of our study limit the generalizability of the findings. First, MHAS ratings were generally provided by a single clinician. While this clinician may have been the most informed reporter, we do not know how accurate or reliable his or her ratings were. If multiple knowledgeable clinicians were available, it would be helpful to assess inter-rater reliability and form consensus ratings to score the MHAS. Second, the response rate for eligible practices was only 29%. While non-response was mostly due to refusals to sign a data release agreement for NCQA scores, it reduced the number of practices that could provide MHAS assessments. Third, the study design was based only on practices that had already achieved NCQA recognition as medical homes. As a result, our sample consisted of practices that presumably had comparatively high levels of homeness to begin with.
2021 Copyright OAT. All rights reserv
There are several ways that future research could advance the assessment of the MHAS. First, score variability could be increased by evaluating a broader array of practices including those had not previously been designated as medical homes. Second, using the 4-factor model presented here, it would be helpful to conduct a confirmatory factor analysis to determine whether the same factor structure persists in other samples. Finally, while the validity of homeness scores is difficult to assess in the absence of a gold standard, it would be helpful to collect validity indicators such as NCQA or state-based designations of medical home status, or expert opinions about the relative homeness of practices comprising a health care network.
Development of this manuscript was supported by Center for Medicare & Medicaid Services Contract No. 500-2005-000291.
The authors declare no conflicts of interest.
The contents of this publication are solely the responsibility of the authors and do not necessarily represent the official views of the U.S. Department of Health and Human Services, or any of its agencies.
- Rogers JC (2008) The patient-centered medical home movement--promise and peril for family medicine. JABFM 21: 370-374.
- Rosenthal TC (2008) The medical home: growing evidence to support a new approach to primary care. JABFM 21: 427-440.
- Joint Principles of the Patient-Centered Medical Home (2007) American College of Family Physicians, American Academy of Pediatrics, American College of Physicians, American Osteopathic Association.
- Stange KC, Nutting PA, Miller WL, Jaén CR, Crabtree BF, Et al. (2010) Defining and Measuring the Patient-Centered Medical Home. J Gen Intern Med 25: 601-612.
- Burton RA, Devers KJ, Berensen RA (2011) Patient-Centered Medical Home Recognition Tools: A Comparison of Ten Tools’ Content and Operational Details. The Urban Institute.
- Bitton A, Martin C, Landon BE (2010) A nationwide survey of patient centered medical home demonstration projects. J Gen Intern Med 25: 584-592.
- Carrier E, Gourevitch MN, Shah NR (2009) Medical homes: challenges in translating theory into practice. Med Care 47: 714-722. [Crossref]
- Ho L, Antonucci J (2015) The Dissenter's Viewpoint: There Has to Be a Better Way to Measure a Medical Home. Ann Fam Med 13: 269-272. [Crossref]
- Ferrante JM, Balasubramanian BA, Hudson SV, Crabtree BF (2010) Principles of the patient-centered medical home and preventive services delivery. Annals of family medicine 8:108-116.
- Jackson GL, Powers BJ, Chatterjee R (2013) Improving patient care. The patient centered medical home. A Systematic Review. Annals of internal medicine 158: 169-178.
- Hooper D, Coughlan J, Mullen MR (2008) Structural equation modelling: Guidelines for determining model fit. Electronic Journal of Business Research Methods 6: 53-60.
- Nunnally JC, Bernstein I (1994) Psychometric Theory. (3rd Edn) McGraw-Hill, New York.
- Stenger RJ, Smith J, McMullan JB Jr, Rodriguez GS, Dorr DA, et al. (2012) Defining the medical home: the Oregon experience. J Am Board Fam Med 25: 869-877. [Crossref]