Abstract
Journals nowadays typically have an acceptance ratio for submitted technical reports at a rate less than 1 in 5 (20% acceptance for some journals, p=0.20). The purpose of this report is to determine how exactly the likelihood of success subsequently improves, with several sequential submissions, assuming random selection. More commonly for the very busy journals, the rate is less than 1 in 10 (p=0.10 "acceptance probability"). The likelihood of failure q=(1-p) will diminish according to a power law as (1-p) ^ N, where N is the number of sequential submissions. For journals that are not as busy, where the acceptance probability is higher, p=0.20, the statistics show that at least 3 submissions are required to achieve a 50% likelihood of success, and 10 submittals are required to achieve a 90% likelihood of success. In recent years, there have appeared completely new scientific and medical journal groups, not necessarily “predatory”, with 10 or 20 different sub-specialities in each group. Beall (2016) discusses practical implications in terms of the so-called predatory journals.
Key words
journal submission rates, likelihood of acceptance, rejection ratios, predatory journals, 1-parameter mathematical model
Highlights
- Journals nowadays typically have an acceptance rate less than 10%.
- Repeat journal submissions are necessary to achieve a reasonable likelihood of success.
- A single-parameter mathematical model is developed, showing that 7 repeat attempts are necessary to achieve a 50%-percent likelihood of success.
- It is shown that these results are relevant to the newly developing “predatory” journals, now numbering more than 2,000.
Introduction
Nowadays scientific journals typically have an acceptance ratio for submitted technical reports at a rate less than 1 in 5 (i.e. 20% acceptance for some journals, p<0.20), and more commonly for the very busy journals, a rate less than 1 in 10 (i.e. p<0.10 acceptance probability for most journals nowadays). Equivalently, we can consider the problem in terms of q, the rejection ratio or rejection probability: q=1– p=0.80 to 0.90 [1].
The new and rapidly developing phenomenon of predatory journals is an important consideration nowadays, especially in the biomedical fields, so an attempt is made to address these statistics using a simple 1-parameter mathematical model. This model can be used to predict an estimate of the # of repeated submission attempts required (depending on the journal's advertised acceptance rate) and subsequently an estimate of the likely time-delay factor.
The purpose of this report is to calculate and demonstrate how exactly the likelihood of success significantly improves, with several sequential submissions, assuming random selection.
Methods
It is standard procedure for authors to resubmit repeatedly, applying to several journals sequentially (parallel submittals are specifically not allowed, as each journal usually requires a written pre-assurance of “exclusivity”). Each individual subsequent submission (assumed to be independent events) has a 10% to 20% chance of success, the likelihood of failure F is given by:
Equation (1) F=q= (1–p) for N = 1 attempt
The likelihood of failure F will diminish with increasing N as:
Equation (2) F=q ^ N= (1 – p) ^ N
where N is the number of sequential submissions.
For this simplified 2-state “success or failure” model, the result is only a success likelihood S or failure likelihood F (other possibilities are possible, but not considered at this stage), so:
Equation (3) S+F=1.0
Combining Equations 1,2, and 3 above, the probability of success S is found to improve with repeated attempts N, according to the following power law:
Equation (4) S=1–q ^ N=1– (1–p) ^ N
Aarssen et al. [1] discuss journal rejection rates for failure rates q in the range 0.2<q< 0.8.
Results
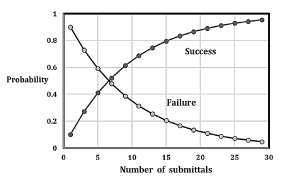
Equations 2 and 3 are plotted in Figures 1 and 2 for typical values of success p. For busy journals, where the probability of success is 10% (p=0.10, Figure 1) this means that during the 1st submittal, 2nd, 3rd, and so forth, there is always a constant 10% chance of acceptance. However, considered from the point of view of failure probability q, the likelihood of failing during the 1st AND 2nd attempt is q^2. The likelihood of failing during the 1st, 2nd AND 3rd attempt is q^3, and so forth, as N increases. Trying one attempt after another, submittals to at least 7 subsequent equivalent journals are required, just to achieve a 50% likelihood of success. Note that a 90% likelihood of success will require N=20 submittals, Figure 1, for p=0.10, a surprisingly large number, though an entirely logical result from this type of mathematical model.

Figure 1. Probability of success for each submittal=1 in 10 (p=0.10). Seven (7) submittals are required to achieve 50% likelihood of success
Discussion
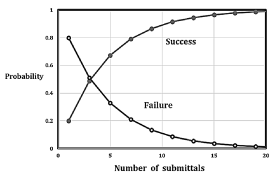
These results can be used to check whether manuscript selection is to a large extend random by comparing the statistics of actual submissions to the random model. For journals that are not as busy, Figure 2 below, with higher acceptance probability, i.e. p=0.20, this statistical model shows that at least 3 submissions are required to achieve a 50% likelihood of success, 10 submittals are required to achieve a 90% likelihood of success. Beall [2] discusses the practical implications in terms of the modern day so-called “predatory journals”, numbering more than 2,000. These can be quantified using p>0.20, that is to say, higher success rates. There is a preponderance of completely new scientific and medical journal groups (not necessarily “predatory”) with 10 or 20 different sub-specialities in each group. One must distinguish between a new journal’s editorial staff, the reviewers, and the business departments, in terms of adhering to the scientific standards we have come to expect with well-established high-quality technical journals. Whether or not a particular journal should be classified as “predatory” is indeed difficult to say [2].

Figure 2. Probability of success for each submittal=1 in 5 (p=0.20). Three (3) submittals are required to achieve 50% likelihood of success
Practical applications
These statistical results, while not immediately obvious, are nevertheless entirely consistent with the on-line submission process to various scientific journals, with some reports achieving success after just 2 or 3 attempts, others requiring 15 or 20 resubmits. It is indeed “counter-intuitive” that repeated attempts will significantly improve the chances of success, but the simplified 1-parameter mathematical model developed here confirms that is the case. More advanced mathematical models can include other journal priority considerations as they modify the likelihood of success, such as relevance, research objectives, continuity, etc.
Other relevant concerns
New journals, not yet established, perhaps gain some prestige by advertising a low “acceptance rate” R. Journals calculate this rate in two ways. For some journals the rate R might be defined as:
Equation (5) 1/R= (# of submissions received)/ (# of papers actually published)
Others might define it this way:
Equation (6) 1/R= (# papers sent for peer review)/ (# papers actually published)
The first method generates a different “acceptance rate”. Since some journals will do what is called a "desk rejection", rejecting a submission without sending it off for peer review (as when someone submits an obviously low-quality paper), this factor will figure into the calculations in Equations 5 and 6 above, yielding slightly different acceptance rates.
Specific economic examples
Perhaps an approximate example will serve to illustrate, from the field of gaming theory [3]. Let’s say the local Lion’s Club is sponsoring a raffle, where 1st prize is $100-dollars US, and there are 5 such winning tickets, out of a total of 100 tickets sold. That is to say, the chances of success are p=0.05, i.e. a 5%-percent chance of success. Each ticket sells for $10-dollars, so the Lions Club will ultimately collect $1,000, of which $500 is re-distributed to the winning members, netting $500 profit remaining for the organization. While the analogy is not exact, clearly one’s chances of success are improved by buying additional tickets, up to a point, so this is a reasonable strategy.
A more exact analogy would be given by an individual travelling across country, visiting many such organizations (each simultaneously holding identical raffles with a 5%-percent chance of success) buying sequentially just 1-ticket at each establishment. In this case, the likelihood S of success is given by S=1– (1-p) ^ N=1– (0.95) ^ N where N is the number of said Lions Clubs visited. For this example, in order to achieve a 50%-percent likelihood of success, one must visit 14 such organizations (i.e. 1–0.95^14=0.51), at a cost of $140 (not including travel).
Conclusion
The classical educational proverb from Thomas Palmer [4], writing about the American educational system, advises “If at first you don’t succeed, then try, try, again”, that is to say, try at least 3-times. This appears to be sound advice, particularly with respect to scientific publishing, which is absolutely necessary nowadays, at our colleges and universities. However, now, it seems we must square (32=9 attempts) or even cube this advice (33=27 attempts), when submitting new scientific work to the well-established conventional journals, as shown in Figures 1 and 2, with probability of success in the range 0.10<p<0.20, typical of scientific journals. In terms of time delay, since each subsequent rejection appraisal and evaluation usually takes 2 to 4 weeks, (sometimes 2 to 4 months), a 1-year delay will often accumulate.
Nomenclature
q=probability of failure, 0.2<q<0.8 for journal submittals
p=probability of success, 0.2<p<0.5 (i.e. 20% to 50% chance of success)
q+p=1 (2-state model, success or failure)
R=journal acceptance rate (see text for exact definitions)
N=number of repeat submittal attempts, typically 1<N<20
F=F(N)=failure likelihood after N attempts, F=q ^ N= (1–p) ^ N
S=S(N)=success likelihood after N attempts, S=1- (1–p) ^ N
Acknowledgement
The authors have no proprietary or financial conflicts of interest. Special thanks to Jeffrey Beall for many helpful comments.
References
- Aarssen LW, Tregenza T, Budden AE, Lortie CJ, Koricheva J, et al. (2008) Bang for your buck: Rejection rates and impact factors in ecological journals. The Open Ecology J 1: 14.
- Beall J (2016) Best practices for scholarly authors in the age of predatory journals. Ann Royal College Surg Eng 98: 77.
- Chen AC, Yang YH, Chen FF (2010) A Statistical Analysis of Popular Lottery “Winning” Strategies. Chance 47: 66.
- Palmer TH (2007) The Teacher’s Manual, an Exposition of an Efficient and Economical System of Education. Marsh, Capen, Lyon and Webb pp: 1-263.


