Take a look at the Recent articles

Long-term survival and acute kidney injury during hospitalization after major neurosurgical procedure

Tezcan Ozrazgat-Baslanti

Division of Nephrology, Hypertension and Transplantation, Department of Medicine, University of Florida College of Medicine, Gainesville, Florida, USA

Daniel R Layon

Division of Critical Care Medicine, Department of Anesthesiology, University of Florida College of Medicine, Gainesville, Florida, USA

Peggy White

Division of Critical Care Medicine, Department of Anesthesiology, University of Florida College of Medicine, Gainesville, Florida, USA

Charles E Hobson

Department of Health Services Research, Management and Policy, College of Public Health and Health Professions, University of Florida, Gainesville, FL, USA

Azra Bihorac

Division of Nephrology, Hypertension and Transplantation, Department of Medicine, University of Florida College of Medicine, Gainesville, Florida, USA

DOI: 10.15761/NRD.1000151

Article
Article Info
Author Info
Figures & Data

Abstract

Objective: Study the effect of acute kidney injury (AKI) on long-term survival in a large cohort of neurosurgical patients who were admitted to the intensive care unit (ICU) for at least 24 hours.

Design: Retrospective cohort study.

Setting: Academic tertiary medical center.

Patients: The study consisted of 3,299 consecutive patients with no history of chronic kidney disease who were discharged after a major neurosurgical procedure at the University of Florida between 1992 and 2002. All patients were admitted to ICU postoperatively for at least twenty-four hours.

Interventions: AKI was defined by the RIFLE classification (Risk, Injury, Failure, Loss, and End stage), which requires at least a 50% increase in serum creatinine, and stratifies patients into three grades of AKI: Risk, injury, and failure. Patient survival was determined through a search of the National Social Security Death Index. Long-term survival was analyzed with a risk-adjusted Cox proportional hazards regression model.

Measurements and Main Results: Among hospital survivors, 10% had an episode of AKI while in the hospital; the occurrence of AKI was dependent on the type of surgery. In the risk-adjusted model, long-term mortality was proportional to the severity of kidney injury, with an adjusted hazard ratio (AHR) of 1.15 (95% confidence interval [CI], 1.09 to 1.22) for RIFLERisk class and 1.45 (1.40-1.75) for the RIFLEFailure class compared to patients without AKI (p<0.001). The association between AKI and long-term mortality risk was dependent on the type of surgery. The survival rate was worse for patients with AKI among all surgery types, except spinal surgery.

Conclusion: Postoperative AKI of even mild severity adversely impacts the long-term outcome of hospital survivors after major neurosurgical procedures. The degree of impact on mortality is dependent on the type of surgery.

Keywords

Acute kidney injury, neurosurgery, intensive care unit, long-term outcome

Introduction

Acute kidney injury (AKI) during hospitalization after major surgical procedures is a risk factor for short-term mortality [1,2]. In the past, studies have focused on severe AKI, defined either as a need for hemodialysis or a substantial increase in serum creatinine (sCr), often including patients with preexisting chronic kidney disease (CKD). Using RIFLE (Risk, Injury, Failure, Loss, and End stage) AKI classification system, several studies have been able to identify the importance of small changes in sCr on patients’ outcomes [3,4]. Additionally, the effect of AKI among neurosurgical patients with aneurysmal subarachnoid hemorrhage (aSAH) was found to be an independent risk factor for short-term mortality [5,6].

Although several studies have reported a higher prevalence of RIFLE-defined AKI in various patient populations, and confirmed the association of less severe AKI with short-term mortality,[4,7,8] few studies have focused on AKI in the cohort of neurosurgical patients[9,10]. Furthermore, several studies have reported, that RIFLE-defined AKI is associated with a significant risk for long-term mortality in several different cohorts including large cohort of surgical patients as demonstrated in our previous study[11]. This association may vary with the type of surgery, and studies in more homogenous patient populations may be warranted[12] .

The goals of this study were to evaluate the long-term mortality risk associated with RIFLE-defined AKI in a large, single-center cohort of neurosurgical patients with no history of chronic kidney disease (CKD), who required at least a 24-hour admission to an intensive care unit (ICU), and to determine whether this association is dependent on the type of surgery and specific patient population.

Materials and methods

Patient population

This study was approved by the Institutional Review Board of the University of Florida as a retrospective cohort study. 11,080 adult patients who were admitted to a surgical ICU for at least 24 hours after any type of general/gastrointestinal, vascular, CT, or neurosurgical operative procedure, and who survived to be discharged from the hospital, were identified through a search of the billing database between the years 1992 and 2002 [11]. Among this cohort, we selected 3,299 patients who underwent any type of neurosurgical procedure, with subsequent admission to a neurosurgical ICU (NeuroICU), for inclusion in this study.

Patients with a history of CKD at any stage were excluded. History of CKD was established through review of all relevant clinical notes and sCr values prior to surgery and by analysis of the International Classification of Diseases, 9th Revision, Clinical Modification (ICD-9-CM) codes for end-stage renal disease (ESRD) and CKD. Patients were categorized by type of operative procedure or primary condition as follows: spinal surgery (SS); vascular surgery (VS) (includes all patients with subarachnoid hemorrhage, aneurysmal surgery and arteriovenous malformation surgeries); craniotomy for tumor (CT); craniotomy for non-tumor surgery (CNT); and patients with intracerebral hemorrhage (ICH) (all ICH not related to SAH, intracerebral aneurysms or AVM; includes traumatic subdural and epidural hematoma). The need for renal replacement therapy (RRT) was recorded for each patient.

Definition of acute kidney injury

AKI is defined by RIFLE classification by comparing changes in sCr during hospitalization to baseline sCr. For baseline sCr, we used the lowest of two values: the lowest measured sCr at hospital admission or the expected sCr value (CrMDRD), calculated using the abbreviated “Modification of diet in renal disease” (MDRD) equation [13]. Patients who met the RIFLE criteria for AKI were classified as “AKI”, while those who did not were classified as “no AKI”. Patients with AKI were stratified according to the maximum RIFLE class (RIFLEmax) reached during hospital admission. RIFLE-R corresponds to a 150% increase in sCr, RIFLE-I to a 200% increase in sCr, and RIFLE-F to a 300% increase in sCr. RIFLEmax was determined by comparing the highest sCr during hospitalization with the baseline sCr. Renal outcome at the time of discharge was evaluated by comparing the discharge sCr to the baseline sCr. Complete renal recovery was recorded if the sCr returned to a level less than 50% above baseline sCr, whereas partial renal recovery was recorded when sCr was greater than 50% above baseline sCr, but with no need for RRT. No renal recovery implied a need for RRT at the time of hospital discharge.

Definition of outcomes and covariates

Comorbidities and surgical complications were identified by ICD-9-CM codes based on previously published criteria [14-16]. The billing codes used for acute renal failure (ARF) were ICD-9-CM diagnostic codes 584.XX or 997.5. Disposition upon discharge was determined from discharge summaries. Patient survival following discharge was determined through a search in 2006 of the National Social Security Death Index.

Statistical analysis

Results are expressed as means (SD) for variables with normal distribution. The Shapiro-Wilk W test and distribution plots were used to test normality of distribution. For data that did not meet normality assumptions, median and interquartile ranges were displayed (IQR), and the Kruskal-Wallis test was utilized to evaluate the independence of group levels. For categorical variables, the Pearson χ2 test or Fisher's exact test was applied as appropriate.

Survival probabilities were estimated with the product-limit method (Kaplan–Meier algorithm). Survival differences between groups were analyzed using the log-rank tests. Adjusted hazard ratios (AHR) were generated by Cox proportional hazard models, with adjustment for factors potentially associated with patient survival. These factors were chosen a priori, based on the literature on AKI in surgery patients and our clinical experience with AKI in these patients. Survival models were initiated from time of hospital discharge and followed until death or date of last follow up. Adjusted survival curves were also generated to demonstrate the impact of the individual surgery type on the degree of AKI, based on the mean level of model covariates. A double-sided P value less than 0.05 was considered statistically significant for all tests. Statistical analyses were performed with Statistica (version 8.0, Tulsa, OK) and SAS (v.9.1.3, Cary, NC). The authors had full access to the data and take responsibility for its integrity.

Results

Among the 3,299 patients who were discharged after major neurosurgical procedure, 323 patients (10%) had an episode of AKI during hospitalization. Of the patients with AKI, only 11% had the most severe form of AKI (RIFLEmaxF), while the majority of patients had mild to moderate AKI (Table 1). The prevalence of AKI during hospitalization was dependent on the type of surgery, with the highest prevalence being among ICH patients (n=64, 17%) and the lowest among patients who underwent a non-tumor craniotomy (n=18, 6%) (Table 2). However, patients undergoing different types of surgery represented distinctive cohorts with major differences in demographic characteristics and comorbid conditions that might have constituted risk factors for AKI and other hospital complications (Table 1). Patients in ICH group were older, more likely to be of AA ethnicity and to have comorbid conditions, all of which are risk factors for AKI. Although other hospital complications were clustered in different patterns among surgical groups, mechanical ventilation, acute postoperative anemia and AKI remained uniformly the most common three complications (Table 1). Interestingly, although previous reports in literature have focused on AKI requiring RRT, only nine patients (3%) in our cohort required RRT, emphasizing the fact that severe RRT-requiring AKI is rare in this population. Only 62% of all AKI patients had complete renal recovery at the time of discharge while 37% had partial renal recovery (Table 3). On the other hand, only 35 (11%) of RIFLE-defined AKI patients had ICD-9-CM codes for acute renal failure (ARF) in the billing database.

Table 1. Demographic and Clinical Characteristics of Patients


No AKI

N=2976 (90%)

AKI

P*

P


All AKI

N=323 (10%)

RIFLEmax R

N=222 (7%)

RIFLEmax I

N=64 (2%)

RIFLEmax F

N=37 (1%)

Demographics


Age 52 (16)

51 (16)

61 (16)

60 (16)

62 (16)

63 (15)

<0.001

0.58

Female sex (1897, 58%)

1697 (57%)

200 (62%)

148 (67%)

33 (52%)

19 (51%)

0.09

0.03

African-American ethnicity (326, 10%)

289 (10%)

37 (11%)

16 (10%)

15 (7%)

6 (23%)

0.43

0.38

Baseline serum creatinine level (mg/dL)

0.77 (0.20)

0.76 (0.25)

0.73 (0.23)

0.81 (0.28)

0.87 (0.23)

<0.001

<0.001

Baseline glomerular filtration rate, mL/min/1.73 m2

104 (25)

100 (30)

102 (31)

97 (31)

87 (23)

<0.001

0.01

Highest serum creatinine level (mg/dL)

0.83 (0.23)

1.63 (1.40)

1.16 (0.39)

1.74 (0.61)

4.25 (2.74)

<0.001

<0.001

Comorbidities


Hypertension (1076, 33%)

924 (31%)

152 (47%)

103 (46%)

34 (53%)

15 (41%)

<0.001

0.45

Diabetes mellitus (207, 6%)

168 (6%)

39 (12%)

24 (11%)

14 (22%)

1 (3%)

<0.001

0.01

Atrial fibrillation (123, 4%)

87 (3%)

36 (11%)

17 (8%)

8 (13%)

11 (30%)

<0.001

<0.001

Congestive heart failure (99, 3%)

63 (2%)

36 (11%)

16 (7%)

12 (19%)

8 (22%)

<0.001

0.003

Chronic pulmonary disease (295, 9%)

255 (9%)

40 (12%)

27 (12%)

7 (11%)

6 (16%)

0.02

0.73

Chronic liver disease (38, 1%)

30 (1%)

8 (2%)

2 (1%)

2 (3%)

4 (11%)

0.02

0.001

Coronary heart disease (242, 7%)

194 (7%)

48 (15%)

29 (13%)

10 (16%)

9 (24%)

<0.001

0.20

Malignancy (605, 18%)

565 (19%)

40 (12%)

26 (12%)

9 (14%)

5 (14%)

0.004

0.86

Chronic anemia (247, 7%)

200 (7%)

47 (15%)

27 (12%)

12 (19%)

8 (22%)

<0.001

0.18

Depression (82, 2%)

77 (3%)

5 (2%)

3 (1%)

2 (3%)

0 (0%)

0.25

0.43

Categorical variables are presented as number (percentages within columns).  *Comparing patients without AKI to all patients with AKI. †Comparing patients within the three subgroups of AKI patients.

Table 2. AKI by type of surgery


No AKI

N=2976 (90%)

AKI

P*

P†


All AKI

N=323 (10%)

RIFLEmax R

N=222 (7%)

RIFLEmax I

N=64 (2%)

RIFLEmax F

N=37 (1%)

Type of surgery


<0.001

<0.001

Craniotomy, non-tumor surgery (n=312; 9%)

294 (94%)

18 (6%)

11 (4%)

6 (2%)

1 (0%)


Vascular surgery (n=1314, 40%)

1192 (91%)

122 (9%)

88 (7%)

21 (2%)

13 (1%)


Spinal surgery (n=499, 15%)

441 (88%)

58 (12%)

43 (9%)

6 (1%)

9 (2%)


Craniotomy, tumor (n=807, 25%)

746 (92%)

61 (8%)

49 (6%)

7 (1%)

5 (1%)


ICH (n=367, 11%)

303 (83%)

64 (17%)

31 (8%)

24 (7%)

9 (2%)


Categorical variables are presented as number (percentages within the rows).  *Comparing patients without AKI to all patients with AKI. †Comparing patients within the three subgroups of AKI patients.

Kaplan-Meier plots show that patients who developed AKI had significantly worse long-term survival than patients with no AKI (p<0.001). Survival rate at five years was 82% for patients without AKI and 61% for patients with AKI. At 10 years, the survival rate drops to approximately 73% for patients without AKI and 49% for patients with AKI (Figure 1). Among patients with AKI, according to RIFLEmax class, survival rate at 10 years was: Risk 55%, Injury 38%, and Failure 33% (Figure 2).
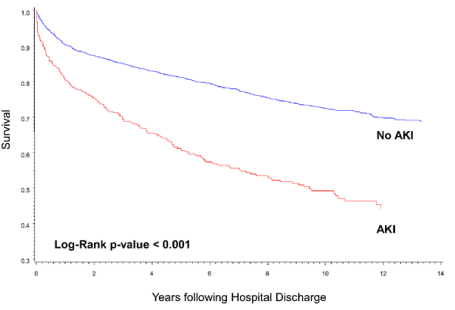
Figure 1. Long-term survival rate of patients with and without an AKI during hospitalization
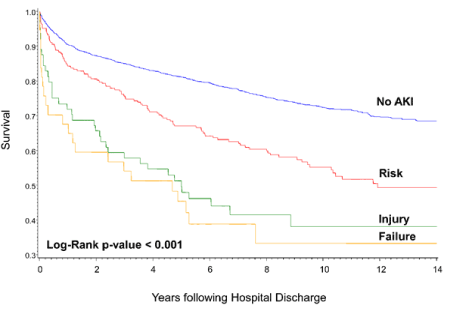
Figure 2. Long-term survival of patients stratified by AKI severity

The Cox proportional hazard model established that AKI (AHR = 1.34, 95% CI 1.11 - 1.61) is a predictor of mortality when all types of surgery are considered together. The severity of AKI in this model was also associated with an increased mortality rate. Patients with RIFLEmaxR had AHR of 1.26 (95% CI 1.01-1.56), patients with RIFLEmaxI had AHR of 1.49 (95% CI 1.06-2.10), and patients with RIFLEmaxF had AHR of 1.63 (95% CI 1.01-2.64). Moreover, male gender, older age (>61 years), chronic pulmonary disease, malignancies, chronic anemia, prolonged length of stay, and discharge to a site other than home further contributed to the increased risk for death in this model (Table 4). Among surgery types, the highest mortality was seen in the tumor craniotomy subgroup, which was used as a reference group in the Cox proportional hazard model. Compared to the reference group, all other types of surgery were associated with a significantly lower risk for long-term mortality.

Table 4. Cox proportional hazard model for patient mortality following hospital discharge

Parameter

(reference level)


Level

All patients


(n=3299)

Vascular surgery

(n=1314, 40%)

Craniotomy, tumor

 (n=807, 25%)

Spinal surgery


(n=499, 15%)

ICH


(n=367, 11%)

Craniotomy, non-tumor surgery

(n=312, 9%)

AHR (95%CI)

P value

AHR (95%CI)

P value

AHR (95%CI)

P value

AHR (95%CI)

P value

AHR (95%CI)

P value

AHR (95%CI)

P value

AKI (No AKI)


1.34 (1.11 - 1.61)

0.002

1.27 (0.88 -1.84)

0.20

1.65 (1.12 – 2.43)

0.01

0.92 (0.58 – 1.46)

0.71

2.00 (1.32 – 3.04)

0.001

2.88 (0.94 – 8.80)

0.06

Type of surgery

(Craniotomy, tumor surgery)

Vascular surgery

0.48 (0.40 – 0.58)

<0.001


Spinal surgery

0.64 (0.52 – 0.78)

<0.001


Craniotomy, non-tumor surgery

0.73 (0.55 – 0.97)

0.03


ICH

0.77 (0.62 – 0.97)

0.03


Demographics


Age Group

(18-45) years)

46-60 years

1.97 (1.60 – 2.43)

<0.001

1.74 (1.11 – 2.70)

0.01

1.81 (1.31 – 2.50)

<0.001

1.75 (1.03 – 2.98)

0.04

3.20 (1.54 – 6.65)

0.002

2.91 (1.38 – 6.14)

0.005


61-70 years

3.17 (2.55 – 3.93)

<0.001

3.24 (2.07 – 5.08)

<0.001

3.00 (2.13 – 4.21)

<0.001

2.89 (1.65 – 5.06)

<0.001

3.23 (1.49 – 7.01)

0.003

11.94 (4.94 – 28.83)

<0.001


71+ years

5.60 (4.48 – 7.01)

<0.001

7.59 (4.73 – 12.17)

<0.001

4.07 (2.73 – 6.06)

<0.001

4.14 (2.33 – 7.34)

<0.001

12.08 (6.27 – 23.28)

<0.001

17.89 (5.78 – 55.41)

<0.001

Gender

(Male)

Female

0.62 (0.61 – 0.79)

<0.001

0.64 (0.49 – 0.85)

0.002

0.58 (0.46 – 0.73)

<0.001

0.72 (0.51 – 1.02)

0.06

0.80 (0.55 – 1.17)

0.25

1.20 (0.64 – 2.25)

0.57

Ethnicity (Caucasian)

African American

0.91 (0.72 – 1.16)

0.43

0.83 (0.50 – 1.40)

0.49

1.04 (0.66 – 1.64)

0.86

0.65 (0.34-1.24)

0.19

0.94 (0.60 – 1.47)

0.79

1.11 (0.38 – 3.24)

0.85


Other*

0.75 (0.56 – 1.02)

0.06

0.64 (0.38 – 1.09)

0.10

0.84 (0.46 – 1.55)

0.58

1.23 (0.61 – 2.49)

0.56

0.66 (0.31 – 1.42)

0.29

0.50 (0.07 – 3.41)

0.48

Comorbidities


Diabetes Mellitus (None)

Yes

1.0 (0.79 – 1.26)

0.99

1.00 (0.60 – 1.67)

0.99

1.13 (0.73 – 1.75)

0.58

0.944 (0.56 – 1.58)

0.83

0.89 (0.51 – 1.56)

0.68

1.52 (0.40 – 5.82)

0.54

Congestive Heart Failure

(None)

Yes

1.11 (0.83 – 1.49)

0.47

0.94 (0.55 -1.62)

0.83


1.29 (0.59 – 2.84)

0.52

1.40 (0.74 – 2.68)

0.30

1.34 (0.72 – 2.49)

0.36

1.19 (0.14 – 10.37)

0.87

Chronic Pulmonary Disease (None)

Yes

1.46 (1.21 – 1.78)

<0.001

1.28 (0.90 -1.82)

0.18

1.75 (1.22 – 2.50)

0.002

1.60 (0.99 – 2.59)

0.05

0.88 (0.50 – 1.57)

0.67

1.62 (0.59 – 4.46)

0.35

Hypertension (None)

Yes

1.09 (0.94 – 1.25)

0.26

1.65 (1.26 – 2.15)

<0.001


0.95 (0.72 – 1.24)

0.69

1.56 (1.08 – 2.24)

0.02

0.79 (0.55 – 1.14)

0.21

0.40 (0.29 – 1.42)

0.27

Atrial Fibrillation (None)

Yes

1.10 (0.85 – 1.44)

0.49

1.09 (0.63 – 1.87)

0.77

1.38 (0.72 – 2.66)

0.34

0.93 (0.51 – 1.70)

0.81

1.34 (0.83 – 2.17)

0.23

0.72 (0.13 – 4.04)

0.71

Coronary Heart Disease

(None)

Yes

1.10 (0.90 - 1.36)

0.37

1.69 (1.18 – 2.41)

0.004

0.74 (0.48 – 1.14)

0.17

1.42 (0.87 – 2.31)

0.16

0.97 (0.56 – 1.68)

0.90

0.78 (0.19 – 3.16)

0.73

Liver Disease (None)

Yes

1.83 (1.14 - 2.93)

0.01


2.18 (0.72 – 6.55)

0.17

0.89 (0.12 – 6.82)

0.91

1.67 (0.63 – 4.43)

0.31

1.70 (0.74 – 3.93)

0.21

1.60 (0.26 – 9.94)

0.61

Malignancies (None)

Yes

3.92 (3.38 - 4.55)

<0.001

1.54 (1.02 – 2.32)

0.04

7.40 (5.60 – 9.79)

<0.001

4.40 (3.00 – 6.44)

<0.001

1.22 (0.69 – 2.18)

0.49

7.09 (3.54 – 14.20)

<0.001

Chronic Anemia (None)

Yes

1.46 (1.18 - 1.79)

<0.001

1.16 (0.75 – 1.80)

0.50

0.85 (0.52 - 1.39)

0.51

2.27 (1.48 – 3.49)

<0.001

1.40 (0.83 – 2.37)

0.21

1.42 (0.58 – 3.52)

0.45

Depression

(None)

Yes

1.52 (1.04 - 2.22)

0.03

1.75 (0.86 – 3.56)

0.12

3.08 (1.55 – 6.12)

0.001

0.74 (0.18 – 3.13)

0.68

2.47 (0.84 – 7.29)

0.10

3.26 (1.05 – 10.15)

0.04

Complications


Mechanical ventilation > 96 hrs (None)

Yes

1.07 (0.87 – 1.32)

0.49

0.98 (0.67 – 1.45)

0.93

1.35 (0.85 – 2.14)

0.21

1.00 (0.60 – 1.64)

0.99

1.58 (0.99 – 2.50)

0.05

0.49 (0.14 – 1.70)

0.26

Tracheostomy (None)

Yes

1.26 (0.98 - 1.64)

0.08

3.49 (2.22 – 5.47)

<0.001

1.28 (0.65 – 2.52)

0.47

1.33 (0.63 – 2.83)

0.46

0.64 (0.39 – 1.07)

0.09

0.45 (0.06 – 3.23)

0.43

Acute anemia (None)

Yes

0.98 (0.82 -1.18)

0.81

1.01 (0.74 – 1.40)

0.93

1.02 (0.71 – 1.47)

0.92

0.96 (0.62 – 1.49)

0.86

0.96 (0.58 – 1.60)

0.88

0.45 (0.13 – 1.61)

0.22

Coagulopathy (None)

Yes

0.91 (0.64 - 1.29)

0.58

0.54 (0.26 – 1.14)

0.11

1.49 (0.69 – 3.21)

0.31

1.37 (0.58 – 3.25)

0.47

0.60 (0.29 – 1.24)

0.17

4.13 (0.70 – 24.27)

0.12

Sepsis

(None)

Yes

1.24 (0.90 – 1.69)

0.20

0.75 (0.42 – 1.31)

0.31

3.41 (1.42 – 8.19)

0.006

0.86 (0.33 – 2.25)

0.76

1.72 (0.98 – 3.03)

0.06

1.35 (0.21 – 8.71)

0.76

Discharge site (Home)

Other†

1.39 (1.17 – 1.66)

<0.001

1.37 (0.98 – 1.93)

0.07


1.87 (1.34 – 2.62)

<0.001

0.84 (0.54 – 1.30)

0.43

1.78 (1.20 – 2.65)

0.004

2.80 (1.14 – 6.85)

0.02

Hospital LOS

(0-7 days)

8-11 days

1.02 (0.84 – 1.24)

0.85

0.92 (0.58 – 1.46)

0.72

1.00 (0.75 – 1.34)

0.99


0.84 (0.52 – 1.38)

0.49

1.18 (0.65 – 2.14)

0.60

1.38 (0.62 – 3.07)

0.43


12-19 days

1.12 (0.91 – 1.37)

0.29

1.26 (0.85 – 1.87)

0.25

0.86 (0.59 – 1.26)

0.44

1.35 (0.85 – 2.15)

0.20

1.21 (0.68 – 2.15)

0.51

1.25 (0.49 – 3.15)

0.64


20+ days

1.53 (1.20 – 1.94)

0.0006

1.26 (0.79 – 2.01)

0.33

1.04 (0.62 – 1.75)

0.88

2.41 (1.41 – 4.11)

0.001

1.09 (0.58 – 2.07)

0.78

3.24 (1.26 – 8.30)

0.01

*Other includes Asian, Hispanic, and unknown.  †Other includes discharge to in-patient rehabilitation facility, nursing home and other acute care facilities.

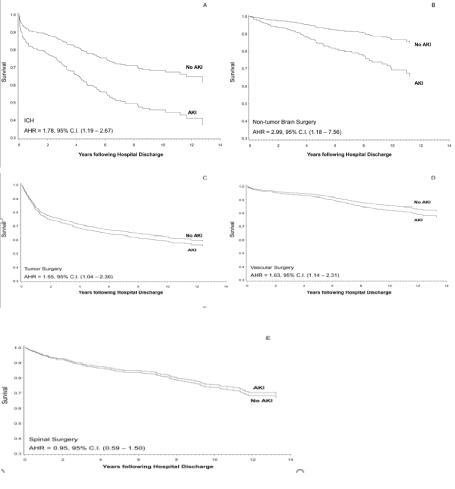
In the subgroup analysis, AKI was associated with an increased risk of death among patients undergoing all types of neurosurgery, except spinal surgery. This association was highly significant for post-tumor craniotomy and ICH patients. In other types of surgery, there was a trend towards worse outcomes, but it did not reach statistical significance (Table 4 and Figure 3). ICH patients with AKI had only a 45% survival rate after 10 years compared to a 78% survival rate for those who did not develop AKI (Figure 3). Similarly, patients who underwent a tumor craniotomy had a 69% 10-year survival rate, as opposed to an 88% survival rate in patients who did not develop AKI (Figure 3). Other factors associated with long-term mortality varied per type of surgery, although AKI, older age (>61 years), prolonged hospital stay (>21 days), and discharge to a location other than home remained the most consistent factors associated with an elevated risk of mortality. The correlation between type of surgery and effect of AKI on mortality was statistically significant (P<0.05).

Figure 3. Long-term survival of patients with and without an AKI during hospitalization, stratified by individual surgery type (A-E). AKI group includes all patients with AKI, regardless of severity. Survival curves are adjusted for the mean level of model covariates listed in Table 2

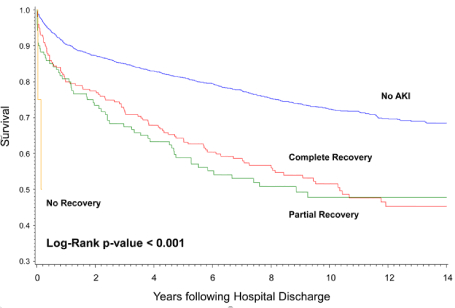
Analysis of the impact of renal recovery on survival was limited due to the small number of patients (four) with no recovery (Table 3). Nonetheless, patients with complete and partial renal recovery after AKI still showed a significantly higher risk of death than patients with no AKI (Figure 4). AKI patients with complete renal recovery at discharge had a 10-year survival rate of 46% compared to 68% for patients without AKI (Figure 4). Lastly, patients who did not recover renal function upon discharge (required RRT) had a very high rate of mortality: none of the four patients with no recovery of renal function survived beyond one year of discharge.

Figure 4. Long-term survival of patients with and without an AKI during hospitalization, stratified by degree of renal recovery

Table 3. Complications and short-term outcomes


No AKI

N=2976 (90%)

AKI

P*

P†


All AKI

N=323 (10%)

RIFLEmax R

N=222 (7%)

RIFLEmax I

N=64 (2%)

RIFLEmax F

N=37 (1%)

Complications


Acute (postoperative) anemia (506, 15%)

437 (15%)

69 (21%)

49 (22%)

15 (23%)

5 (14%)

0.002

0.452

Coagulopathy (89, 3%)

63 (2%)

26 (8%)

12 (5%)

5 (8%)

9 (24%)

<0.001

<0.001

Mechanical ventilation (598, 18%)

477 (16%)

121 (37%)

63 (28%)

35 (55%)

23 (62%)

<0.001

<0.001

Tracheostomy (246, 7%)

177 (6%)

69 (21%)

32 (14%)

20 (31%)

17 (46%)

<0.001

<0.001

Sepsis (128, 4%)

83 (3%)

45 (13%)

18 (8%)

11 (17%)

16 (43%)

<0.001

<0.001

Renal replacement therapy (9, 0%)


9 (3%)

0 (0%)

0 (0%)

9 (24%)


<0.001

Renal recovery at discharge


Complete recovery


199 (62%)

155 (70%)

31 (48%)

13 (35%)


<0.001

Partial recovery


120 (37%)

67 (30%)

33 (52%)

20 (54%)


<0.001

No recovery


4 (1%)

0 (0%)

0 (0%)

4 (11%)


<0.001

Days in hospital

8 (5, 125)

16 (8, 34)

14 (7, 25)

25 (10, 44)

43 (15, 63)


Days in ICU

1 (1, 4)

5 (1, 12)

3 (1, 9)

9 (3, 20)

19 (6, 29)


Billing code for acute renal failure


35 (11%)

5 (2%)

11 (17%)

19 (51%)


<0.001

Continuous variables are presented as the mean (standard deviation) or as the median (interquartile interval) when not normally distributed. Categorical variables are presented as number (percentages within the columns).  *Comparing patients without AKI to all patients with AKI. †Comparing patients within the three subgroups of AKI patients. ‡ICD-9 codes 584.XX or 997.5.

Discussion

In a large, single-center cohort of patients with no history of CKD, discharged after a neurosurgical procedure, AKI during hospitalization was associated with an increased long-term risk of death. Ten percent of the survivors developed AKI in-hospital, and patients with even the mildest form of AKI had significantly higher long-term mortality than patients without AKI. The association of AKI with long-term mortality risk was strongly dependent on the type of surgery. This association was most pronounced among patients with ICH and tumor craniotomy, who had up to a two-fold increase in long-term mortality risk after hospital discharge.

The adverse effects of all severity stages of AKI on in-hospital mortality is becoming increasingly recognized in various patient populations [7], including neurosurgical patients, where a study examined the impact of mild to moderately severe AKI [4]. The dearth of data in the literature may reflect a lack of appreciation in current clinical practice for the significance of small changes in sCr. It is especially surprising given that patients with aSAH are often exposed to nephrotoxic agents, such as radiographic contrast and vasopressors, used for the treatment of vasospasm [17]. In our study, the most severe AKI requiring RRT comprised only 11% of all AKI patients identified, while 89% of AKI patients had mild to moderate forms of kidney injury. The mean highest level of sCr among patients with mild AKI (70% of all AKI patients with RIFLE-R stage AKI) was only 1.16 mg/dL, a value that rarely elicits serious clinical attention in this population. In addition, only 11% of all RIFLE-defined AKI patients had an ICD-9-CM code for ARF in the administrative database, which emphasizes that the prevalence and clinical significance of postoperative AKI may be underestimated when based solely on ICD-9-CM codes.

The modifying effect of the type of surgical procedure on the association between AKI and long-term mortality risk is reiterated by our findings. The stratification of patients into surgical procedure subgroups and the exclusion of patients with documented CKD provided a better-defined study population. Each procedure incurs different risks for long-term mortality, which, in turn, exposes patients to risk factors for the development of AKI. In the present study, AKI was associated with a higher long-term mortality risk for all types of surgical procedures, except spinal surgery. This correlation was highly significant among patients with ICH and craniotomy for tumor, as this group likely had more risk factors for developing AKI, such as older age, underlying atherosclerotic vascular disease, and more infectious complications [18-20]. Similar to AKI, sepsis was more likely to be associated with a long-term mortality risk in both subgroups. An overlap between the effects of AKI and sepsis is possible, especially among patients with tumor craniotomy, who may suffer from the prolonged immunosuppressive effects of anticancer treatment [21,22]. Other factors associated with risk for long-term mortality in the Cox regression model varied among surgical subgroups. The fact that we found no consistent significance among recorded comorbidities and complications may be due to a low prevalence of chronic conditions, such as diabetes and heart disease, in this patient population. Nonetheless, this finding further reiterates that some comorbidities and hospital complications may be procedure–specific, and future outcome studies should focus on even more homogenous patient populations [12].

 The exclusion of patients with preoperative CKD, a well-recognized risk factor for in-hospital and post-discharge mortality after different types of surgery, allowed better discrimination between the effects of acute changes in kidney function and chronic kidney disease [23-25]. Patients with CKD are also more likely to present with other chronic illnesses, and are more susceptible to acute worsening of kidney function [26]. Although we could potentially have underestimated the occurrence of CKD by using sCr estimates, this is the first study that demonstrates the adverse effects of small changes in kidney function among patients with no previously known kidney disease. In addition, we found that even patients who experienced an episode of AKI, but recovered full renal function at discharge, nevertheless had significantly higher long-term mortality risk than patients without AKI, suggesting that, whether small or transient, derangements in kidney function profoundly impact long-term outcome. This finding has been previously demonstrated in other patient populations [11,27,28], but our study is the first to confirm its occurrence among patients undergoing different types of neurosurgical procedures.

Although we cannot draw any conclusions based on causality, we propose that AKI should no longer be viewed solely as an indicator of overall severity of illness, but also as a factor that can independently impose significant effects on other organs, including the lungs [29-31]. Once acquired, AKI incites a cascade of inflammatory processes both locally and systemically [32]. AKI patients may remain ill for longer than the duration of hospitalization and, as a result, have an increased risk of death, as has been shown for severe sepsis and septic shock [33]. Studies have demonstrated that renal blood flow and clearance function can remain impaired for a prolonged period of time following an episode of AKI, despite the apparent normalization of sCr [34-36].This evidence may account for our finding that patients whose sCr levels return to baseline upon discharge still have an increased risk of mortality. More recent studies have indicated ongoing damage after AKI, resulting in decreased capillary density in the peritubular capillaries, a process known as rarefication [37]. The accelerated progression towards CKD may potentially provide an explanation for the adverse long-term outcomes of patients with AKI. Ishani et al reported that elderly individuals with AKI and no previous history of CKD had an AHR of 13 (95% CI 10.6 –16.0) for the development of ESRD [38]. In current clinical practice, there is no recommendation for post discharge follow-up for patients who experience mild and moderate AKI, and prospective data on the progression of kidney function after AKI are missing. Although Bagshaw et al suggested that a 90-day period may be needed for ascertainment of survival for critically-ill patients with severe AKI requiring RRT [39], our study demonstrates that, for patients with all stages of AKI, increased mortality continues even beyond the 90-day time point, with the steepest portion of the survival curve in the first year. Future studies will need to address the use of novel biomarkers of tubular damage and kidney function as a means to follow the progression of AKI after hospital discharge.

Our study is a retrospective observational analysis and, as such, is subject to bias due to the impact of any unmeasured factors in our data. The homogenous (all neurosurgical patients without CKD) sample size presented a higher statistical power, imposing reservations on the study findings that may not have been an issue with a larger, more diverse patient sample. Although various adjustments were made through multivariate statistical methods and risk adjustment models, the potential for residual confounding could not be entirely eliminated. Due to the fact that a patient ‘s co-morbidities and postoperative complications were obtained through the hospital’s billing database, using ICD-9-CM codes, we relied heavily on the integrity of that information. The potential for inaccurate coding is not unusual. Patients can be coded differently, depending on the person entering the information. This variable, along with subtle differences in coding between institutions, could potentially result in underrepresentation of these factors. Although the above factors may cause errors and variance in the data, we assume that they are randomly distributed, and therefore should not cause any significant bias in our conclusions.

Conclusion

In a large single-center cohort of discharged post neurosurgery patients with no history of CKD, all severity stages of AKI were associated with an increased long-term risk of death. The degree of AKI effect on long-term mortality was strongly dependent upon the type of surgery and was most pronounced for patients with ICH and tumor craniotomy. Since there are few, if any, literature sources detailing the effects of AKI in the post neurosurgical setting, future studies will need to address optimal post discharge follow-up for these patients and to further elucidate potential causes for the observed adverse effect.

Acknowledgements

Matthew Ruppert, BS and Haleh Hashemighouchani, MD for their assistance formatting and revising the manuscript

Funding Source

Financial support was solely through departmental and institutional sources.

References

  1. Leblanc M, Kellum JA, Gibney RT, Lieberthal W, Tumlin J, et al. (2005) Risk factors for acute renal failure: inherent and modifiable risks. Curr Opin Crit Care 11: 533-536. [Crossref] 
  2. Sykes E, Cosgrove JF (2007) Acute renal failure and the critically ill surgical patient. Ann R Coll Surg Engl 89: 22-29. [Crossref]
  3. Bagshaw SM, George C, Dinu I, Bellomo R (2007) A Multi-Centre Evaluation of the Rifle Criteria for Early Acute Kidney Injury in Critically Ill Patients. Nephrol Dial Transplant 23: 1203-1210. [Crossref] 
  4. Hoste EA, Schurgers M (2008) Epidemiology of acute kidney injury: how big is the problem? Crit Care Med 36: S146-151. [Crossref]
  5. Zacharia BE, Ducruet AF, Hickman ZL, Grobelny BT, Fernandez L, et al. (2009) Renal Dysfunction as an Independent Predictor of Outcome After Aneurysmal Subarachnoid Hemorrhage. A Single-Center Cohort Study. Stroke 40: 2375-2381. [Crossref]
  6. Sadan O, Singbartl K, Kandiah PA, Martin KS, Samuels OB (2017) Hyperchloremia Is Associated with Acute Kidney Injury in Patients with Subarachnoid Hemorrhage. Crit Care Med 45: 1382-1388. [Crossref] 
  7. Kellum JA (2008) Acute kidney injury. Crit Care Med 36: S141-145. [Crossref] 
  8. Ricci Z, Cruz D, Ronco C (2008) The RIFLE criteria and mortality in acute kidney injury: A systematic review. Kidney Int 73: 538-546. [Crossref]
  9. Deng Y, Yuan J, Chi R, Ye H, Zhou D, et al. (2017) The Incidence, Risk Factors and Outcomes of Postoperative Acute Kidney Injury in Neurosurgical Critically Ill Patients. Sci Rep 7: 4245. [Crossref]
  10. Büttner S, Stadler A, Mayer C, Patyna S, Betz C, et al. (2018) Incidence, Risk Factors, and Outcome of Acute Kidney Injury in Neurocritical Care. J Intensive Care Med. [Crossref] 
  11. Bihorac A, Yavas S, Subbiah S, Hobson CE, Schold JD, et al. (2009) Long-term risk of mortality and acute kidney injury during hospitalization after major surgery. Ann Surg 249: 851-858. [Crossref] 
  12. Hobson CE, Yavas S, Segal MS, Schold JD, Tribble CG, et al. (2009) Acute kidney injury is associated with increased long-term mortality after cardiothoracic surgery. Circulation 119: 2444-2453. [Crossref]
  13. Rinaldo Bellomo, Claudio Ronco, John A Kellum, Ravindra L Mehta, Paul Palevsky, et al. (2004) Acute renal failure – definition, outcome measures, animal models, fluid therapy and information technology needs: The Second International Consensus Conference of the Acute Dialysis Quality Initiative (ADQI) Group. Crit Care Med 8: 204-212. [Crossref]
  14. Elixhauser A, Steiner C, Harris DR, Coffey RM (1998) Comorbidity measures for use with administrative data. Med Care 36: 8-27. [Crossref] 
  15. Reker DM, Rosen AK, Hoenig H, Berlowitz DR, Laughlin J, et al. (2002) The hazards of stroke case selection using administrative data. Med Care 40: 96-104. [Crossref] 
  16. Martin GS, Mannino DM, Eaton S, Moss M (2003) The epidemiology of sepsis in the United States from 1979 through 2000. N Engl J Med 348: 1546-1554. [Crossref] 
  17. Cronin R (2009) Contrast-induced nephropathy: pathogenesis and prevention. Pediatr Nephrol.
  18. Haeusler KG, Schmidt WU, Föhring F, Meisel C, Helms T, et al. (2008) Cellular immunodepression preceding infectious complications after acute ischemic stroke in humans. Cerebrovasc Dis 25: 50-58. [Crossref] 
  19. Qureshi AI, Mendelow AD, Hanley DF (2009) Intracerebral haemorrhage. Lancet 373: 1632-1644. [Crossref]
  20. Ciccone A, Pozzi M, Motto C, Tiraboschi P, Sterzi R (2008) Epidemiological, clinical, and therapeutic aspects of primary intracerebral hemorrhage. Neurol Sci 29: 256-257. [Crossref]
  21. Kennedy BC, Maier LM, D'Amico R, Mandigo CE, Fontana EJ, et al. (2009) Dynamics of central and peripheral immunomodulation in a murine glioma model. BMC Immunol 10: 11. [Crossref] 
  22. Vega EA, Graner MW, Sampson JH (2008) Combating immunosuppression in glioma. Future Oncol 4: 433-442. [Crossref]
  23. Ko BS, Lee JK, Seo BR, Moon SJ, Kim JH, et al. (2008) Clinical analysis of risk factors related to recurrent chronic subdural hematoma. J Korean Neurosurg Soc 43: 11-15. [Crossref]
  24. Yanaka K, Nagase S, Asakawa H, Matsumaru Y, Koyama A, et al. (2004) Management of unruptured cerebral aneurysms in patients with polycystic kidney disease. Surg Neurol 62: 538-545. [Crossref]
  25. Yoon DH, Shin HC, Kim KN, Lee SW, Yi S, et al. (2005) Surgical management of spinal disease in renal recipients. Clin Transplant 19: 632-637. [Crossref]
  26. Thakar CV, Worley S, Arrigain S, Yared JP, Paganini EP (2005) Influence of renal dysfunction on mortality after cardiac surgery: modifying effect of preoperative renal function. Kidney Int 67: 1112-1119. [Crossref]
  27. Goldberg R, Dennen P (2008) Long-term outcomes of acute kidney injury. Adv Chronic Kidney Dis 15: 297-307. [Crossref]
  28. Bagshaw SM (2006) The long-term outcome after acute renal failure. Curr Opin Crit Care 12: 561-566. [Crossref]
  29. Feltes CM, Van Eyk J, Rabb H (2008) Distant-organ changes after acute kidney injury. Nephron Physiol 109: p80-84. [Crossref]
  30. Hassoun HT, Grigoryev DN, Lie ML, Liu M, Cheadle C, et al. (2007) Ischemic acute kidney injury induces a distant organ functional and genomic response distinguishable from bilateral nephrectomy. Am J Physiol Renal Physiol 293: 30-40. [Crossref]
  31. Druml W (2005) Long term prognosis of patients with acute renal failure: is intensive care worth it? Intensive Care Med 31: 1145-1147. [Crossref]
  32. Bonventre JV (2007) Pathophysiology of acute kidney injury: roles of potential inhibitors of inflammation. Contrib Nephrol 156: 39-46. [Crossref]
  33. Perl TM, Dvorak L, Hwang T, Wenzel RP (1995) Long-term survival and function after suspected gram-negative sepsis. JAMA 274: 338-345. [Crossref]
  34. Briggs JD, Kennedy AC, Young LN, Luke RG, Gray M (1967) Renal function after acute tubular necrosis. Br Med J 3: 513-516. [Crossref]
  35. Bull G, Joekes, Lowe (1950) Renal function studies in acute tubular necrosis. Clinical Science 9: 379-404. [Crossref]
  36. Hall JW, Johnson WJ, Maher FT, Hunt JC (1970) Immediate and long-term prognosis in acute renal failure. Ann Intern Med 73: 515-521. [Crossref]
  37. Basile DP (2004) Rarefaction of peritubular capillaries following ischemic acute renal failure: a potential factor predisposing to progressive nephropathy. Curr Opin Nephrol Hypertens 13: 1-7. [Crossref]
  38. Ishani A, Xue JL, Himmelfarb J, Eggers PW, Kimmel PL, et al. (2009) Acute kidney injury increases risk of ESRD among elderly. J Am Soc Nephrol 20: 223-228. [Crossref]
  39. Bagshaw SM, Mortis G, Doig CJ, Godinez-Luna T, Fick GH, et al. (2006) One-year mortality in critically ill patients by severity of kidney dysfunction: a population-based assessment. Am J Kidney Dis 48: 402-409. [Crossref] 

Editorial Information

Editor-in-Chief

Yohei Miyamoto
General Manager in Toray Industries,Tokyo, Japan

Article Type

Research Article

Publication history

Received date: January 14, 2019
Accepted date: January 28, 2019
Published date: January 31, 2019

Copyright

©2019 Azra Bihorac. This is an open-access article distributed under the terms of the Creative Commons Attribution License, which permits unrestricted use, distribution, and reproduction in any medium, provided the original author and source are credited.

Citation

Azra Bihorac (2019) Long-term survival and acute kidney injury during hospitalization after major neurosurgical procedure. Nephrol Renal Dis 4: DOI: 10.15761/NRD.1000151

Corresponding author

Azra Bihorac

Department of Medicine, Division of Nephrology, Hypertension and Renal Transplantation, PO Box 100224, Gainesville, FL 32610-0224

E-mail : bhuvaneswari.bibleraaj@uhsm.nhs.uk

Figure 1. Long-term survival rate of patients with and without an AKI during hospitalization

Figure 2. Long-term survival of patients stratified by AKI severity

Figure 3. Long-term survival of patients with and without an AKI during hospitalization, stratified by individual surgery type (A-E). AKI group includes all patients with AKI, regardless of severity. Survival curves are adjusted for the mean level of model covariates listed in Table 2

Figure 4. Long-term survival of patients with and without an AKI during hospitalization, stratified by degree of renal recovery

Table 1. Demographic and Clinical Characteristics of Patients


No AKI

N=2976 (90%)

AKI

P*

P


All AKI

N=323 (10%)

RIFLEmax R

N=222 (7%)

RIFLEmax I

N=64 (2%)

RIFLEmax F

N=37 (1%)

Demographics


Age 52 (16)

51 (16)

61 (16)

60 (16)

62 (16)

63 (15)

<0.001

0.58

Female sex (1897, 58%)

1697 (57%)

200 (62%)

148 (67%)

33 (52%)

19 (51%)

0.09

0.03

African-American ethnicity (326, 10%)

289 (10%)

37 (11%)

16 (10%)

15 (7%)

6 (23%)

0.43

0.38

Baseline serum creatinine level (mg/dL)

0.77 (0.20)

0.76 (0.25)

0.73 (0.23)

0.81 (0.28)

0.87 (0.23)

<0.001

<0.001

Baseline glomerular filtration rate, mL/min/1.73 m2

104 (25)

100 (30)

102 (31)

97 (31)

87 (23)

<0.001

0.01

Highest serum creatinine level (mg/dL)

0.83 (0.23)

1.63 (1.40)

1.16 (0.39)

1.74 (0.61)

4.25 (2.74)

<0.001

<0.001

Comorbidities


Hypertension (1076, 33%)

924 (31%)

152 (47%)

103 (46%)

34 (53%)

15 (41%)

<0.001

0.45

Diabetes mellitus (207, 6%)

168 (6%)

39 (12%)

24 (11%)

14 (22%)

1 (3%)

<0.001

0.01

Atrial fibrillation (123, 4%)

87 (3%)

36 (11%)

17 (8%)

8 (13%)

11 (30%)

<0.001

<0.001

Congestive heart failure (99, 3%)

63 (2%)

36 (11%)

16 (7%)

12 (19%)

8 (22%)

<0.001

0.003

Chronic pulmonary disease (295, 9%)

255 (9%)

40 (12%)

27 (12%)

7 (11%)

6 (16%)

0.02

0.73

Chronic liver disease (38, 1%)

30 (1%)

8 (2%)

2 (1%)

2 (3%)

4 (11%)

0.02

0.001

Coronary heart disease (242, 7%)

194 (7%)

48 (15%)

29 (13%)

10 (16%)

9 (24%)

<0.001

0.20

Malignancy (605, 18%)

565 (19%)

40 (12%)

26 (12%)

9 (14%)

5 (14%)

0.004

0.86

Chronic anemia (247, 7%)

200 (7%)

47 (15%)

27 (12%)

12 (19%)

8 (22%)

<0.001

0.18

Depression (82, 2%)

77 (3%)

5 (2%)

3 (1%)

2 (3%)

0 (0%)

0.25

0.43

Categorical variables are presented as number (percentages within columns).  *Comparing patients without AKI to all patients with AKI. †Comparing patients within the three subgroups of AKI patients.

Table 2. AKI by type of surgery


No AKI

N=2976 (90%)

AKI

P*

P†


All AKI

N=323 (10%)

RIFLEmax R

N=222 (7%)

RIFLEmax I

N=64 (2%)

RIFLEmax F

N=37 (1%)

Type of surgery


<0.001

<0.001

Craniotomy, non-tumor surgery (n=312; 9%)

294 (94%)

18 (6%)

11 (4%)

6 (2%)

1 (0%)


Vascular surgery (n=1314, 40%)

1192 (91%)

122 (9%)

88 (7%)

21 (2%)

13 (1%)


Spinal surgery (n=499, 15%)

441 (88%)

58 (12%)

43 (9%)

6 (1%)

9 (2%)


Craniotomy, tumor (n=807, 25%)

746 (92%)

61 (8%)

49 (6%)

7 (1%)

5 (1%)


ICH (n=367, 11%)

303 (83%)

64 (17%)

31 (8%)

24 (7%)

9 (2%)


Categorical variables are presented as number (percentages within the rows).  *Comparing patients without AKI to all patients with AKI. †Comparing patients within the three subgroups of AKI patients.

Table 3. Complications and short-term outcomes


No AKI

N=2976 (90%)

AKI

P*

P†


All AKI

N=323 (10%)

RIFLEmax R

N=222 (7%)

RIFLEmax I

N=64 (2%)

RIFLEmax F

N=37 (1%)

Complications


Acute (postoperative) anemia (506, 15%)

437 (15%)

69 (21%)

49 (22%)

15 (23%)

5 (14%)

0.002

0.452

Coagulopathy (89, 3%)

63 (2%)

26 (8%)

12 (5%)

5 (8%)

9 (24%)

<0.001

<0.001

Mechanical ventilation (598, 18%)

477 (16%)

121 (37%)

63 (28%)

35 (55%)

23 (62%)

<0.001

<0.001

Tracheostomy (246, 7%)

177 (6%)

69 (21%)

32 (14%)

20 (31%)

17 (46%)

<0.001

<0.001

Sepsis (128, 4%)

83 (3%)

45 (13%)

18 (8%)

11 (17%)

16 (43%)

<0.001

<0.001

Renal replacement therapy (9, 0%)


9 (3%)

0 (0%)

0 (0%)

9 (24%)


<0.001

Renal recovery at discharge


Complete recovery


199 (62%)

155 (70%)

31 (48%)

13 (35%)


<0.001

Partial recovery


120 (37%)

67 (30%)

33 (52%)

20 (54%)


<0.001

No recovery


4 (1%)

0 (0%)

0 (0%)

4 (11%)


<0.001

Days in hospital

8 (5, 125)

16 (8, 34)

14 (7, 25)

25 (10, 44)

43 (15, 63)


Days in ICU

1 (1, 4)

5 (1, 12)

3 (1, 9)

9 (3, 20)

19 (6, 29)


Billing code for acute renal failure


35 (11%)

5 (2%)

11 (17%)

19 (51%)


<0.001

Continuous variables are presented as the mean (standard deviation) or as the median (interquartile interval) when not normally distributed. Categorical variables are presented as number (percentages within the columns).  *Comparing patients without AKI to all patients with AKI. †Comparing patients within the three subgroups of AKI patients. ‡ICD-9 codes 584.XX or 997.5.

Table 4. Cox proportional hazard model for patient mortality following hospital discharge

Parameter

(reference level)


Level

All patients


(n=3299)

Vascular surgery

(n=1314, 40%)

Craniotomy, tumor

 (n=807, 25%)

Spinal surgery


(n=499, 15%)

ICH


(n=367, 11%)

Craniotomy, non-tumor surgery

(n=312, 9%)

AHR (95%CI)

P value

AHR (95%CI)

P value

AHR (95%CI)

P value

AHR (95%CI)

P value

AHR (95%CI)

P value

AHR (95%CI)

P value

AKI (No AKI)


1.34 (1.11 - 1.61)

0.002

1.27 (0.88 -1.84)

0.20

1.65 (1.12 – 2.43)

0.01

0.92 (0.58 – 1.46)

0.71

2.00 (1.32 – 3.04)

0.001

2.88 (0.94 – 8.80)

0.06

Type of surgery

(Craniotomy, tumor surgery)

Vascular surgery

0.48 (0.40 – 0.58)

<0.001


Spinal surgery

0.64 (0.52 – 0.78)

<0.001


Craniotomy, non-tumor surgery

0.73 (0.55 – 0.97)

0.03


ICH

0.77 (0.62 – 0.97)

0.03


Demographics


Age Group

(18-45) years)

46-60 years

1.97 (1.60 – 2.43)

<0.001

1.74 (1.11 – 2.70)

0.01

1.81 (1.31 – 2.50)

<0.001

1.75 (1.03 – 2.98)

0.04

3.20 (1.54 – 6.65)

0.002

2.91 (1.38 – 6.14)

0.005


61-70 years

3.17 (2.55 – 3.93)

<0.001

3.24 (2.07 – 5.08)

<0.001

3.00 (2.13 – 4.21)

<0.001

2.89 (1.65 – 5.06)

<0.001

3.23 (1.49 – 7.01)

0.003

11.94 (4.94 – 28.83)

<0.001


71+ years

5.60 (4.48 – 7.01)

<0.001

7.59 (4.73 – 12.17)

<0.001

4.07 (2.73 – 6.06)

<0.001

4.14 (2.33 – 7.34)

<0.001

12.08 (6.27 – 23.28)

<0.001

17.89 (5.78 – 55.41)

<0.001

Gender

(Male)

Female

0.62 (0.61 – 0.79)

<0.001

0.64 (0.49 – 0.85)

0.002

0.58 (0.46 – 0.73)

<0.001

0.72 (0.51 – 1.02)

0.06

0.80 (0.55 – 1.17)

0.25

1.20 (0.64 – 2.25)

0.57

Ethnicity (Caucasian)

African American

0.91 (0.72 – 1.16)

0.43

0.83 (0.50 – 1.40)

0.49

1.04 (0.66 – 1.64)

0.86

0.65 (0.34-1.24)

0.19

0.94 (0.60 – 1.47)

0.79

1.11 (0.38 – 3.24)

0.85


Other*

0.75 (0.56 – 1.02)

0.06

0.64 (0.38 – 1.09)

0.10

0.84 (0.46 – 1.55)

0.58

1.23 (0.61 – 2.49)

0.56

0.66 (0.31 – 1.42)

0.29

0.50 (0.07 – 3.41)

0.48

Comorbidities


Diabetes Mellitus (None)

Yes

1.0 (0.79 – 1.26)

0.99

1.00 (0.60 – 1.67)

0.99

1.13 (0.73 – 1.75)

0.58

0.944 (0.56 – 1.58)

0.83

0.89 (0.51 – 1.56)

0.68

1.52 (0.40 – 5.82)

0.54

Congestive Heart Failure

(None)

Yes

1.11 (0.83 – 1.49)

0.47

0.94 (0.55 -1.62)

0.83


1.29 (0.59 – 2.84)

0.52

1.40 (0.74 – 2.68)

0.30

1.34 (0.72 – 2.49)

0.36

1.19 (0.14 – 10.37)

0.87

Chronic Pulmonary Disease (None)

Yes

1.46 (1.21 – 1.78)

<0.001

1.28 (0.90 -1.82)

0.18

1.75 (1.22 – 2.50)

0.002

1.60 (0.99 – 2.59)

0.05

0.88 (0.50 – 1.57)

0.67

1.62 (0.59 – 4.46)

0.35

Hypertension (None)

Yes

1.09 (0.94 – 1.25)

0.26

1.65 (1.26 – 2.15)

<0.001


0.95 (0.72 – 1.24)

0.69

1.56 (1.08 – 2.24)

0.02

0.79 (0.55 – 1.14)

0.21

0.40 (0.29 – 1.42)

0.27

Atrial Fibrillation (None)

Yes

1.10 (0.85 – 1.44)

0.49

1.09 (0.63 – 1.87)

0.77

1.38 (0.72 – 2.66)

0.34

0.93 (0.51 – 1.70)

0.81

1.34 (0.83 – 2.17)

0.23

0.72 (0.13 – 4.04)

0.71

Coronary Heart Disease

(None)

Yes

1.10 (0.90 - 1.36)

0.37

1.69 (1.18 – 2.41)

0.004

0.74 (0.48 – 1.14)

0.17

1.42 (0.87 – 2.31)

0.16

0.97 (0.56 – 1.68)

0.90

0.78 (0.19 – 3.16)

0.73

Liver Disease (None)

Yes

1.83 (1.14 - 2.93)

0.01


2.18 (0.72 – 6.55)

0.17

0.89 (0.12 – 6.82)

0.91

1.67 (0.63 – 4.43)

0.31

1.70 (0.74 – 3.93)

0.21

1.60 (0.26 – 9.94)

0.61

Malignancies (None)

Yes

3.92 (3.38 - 4.55)

<0.001

1.54 (1.02 – 2.32)

0.04

7.40 (5.60 – 9.79)

<0.001

4.40 (3.00 – 6.44)

<0.001

1.22 (0.69 – 2.18)

0.49

7.09 (3.54 – 14.20)

<0.001

Chronic Anemia (None)

Yes

1.46 (1.18 - 1.79)

<0.001

1.16 (0.75 – 1.80)

0.50

0.85 (0.52 - 1.39)

0.51

2.27 (1.48 – 3.49)

<0.001

1.40 (0.83 – 2.37)

0.21

1.42 (0.58 – 3.52)

0.45

Depression

(None)

Yes

1.52 (1.04 - 2.22)

0.03

1.75 (0.86 – 3.56)

0.12

3.08 (1.55 – 6.12)

0.001

0.74 (0.18 – 3.13)

0.68

2.47 (0.84 – 7.29)

0.10

3.26 (1.05 – 10.15)

0.04

Complications


Mechanical ventilation > 96 hrs (None)

Yes

1.07 (0.87 – 1.32)

0.49

0.98 (0.67 – 1.45)

0.93

1.35 (0.85 – 2.14)

0.21

1.00 (0.60 – 1.64)

0.99

1.58 (0.99 – 2.50)

0.05

0.49 (0.14 – 1.70)

0.26

Tracheostomy (None)

Yes

1.26 (0.98 - 1.64)

0.08

3.49 (2.22 – 5.47)

<0.001

1.28 (0.65 – 2.52)

0.47

1.33 (0.63 – 2.83)

0.46

0.64 (0.39 – 1.07)

0.09

0.45 (0.06 – 3.23)

0.43

Acute anemia (None)

Yes

0.98 (0.82 -1.18)

0.81

1.01 (0.74 – 1.40)

0.93

1.02 (0.71 – 1.47)

0.92

0.96 (0.62 – 1.49)

0.86

0.96 (0.58 – 1.60)

0.88

0.45 (0.13 – 1.61)

0.22

Coagulopathy (None)

Yes

0.91 (0.64 - 1.29)

0.58

0.54 (0.26 – 1.14)

0.11

1.49 (0.69 – 3.21)

0.31

1.37 (0.58 – 3.25)

0.47

0.60 (0.29 – 1.24)

0.17

4.13 (0.70 – 24.27)

0.12

Sepsis

(None)

Yes

1.24 (0.90 – 1.69)

0.20

0.75 (0.42 – 1.31)

0.31

3.41 (1.42 – 8.19)

0.006

0.86 (0.33 – 2.25)

0.76

1.72 (0.98 – 3.03)

0.06

1.35 (0.21 – 8.71)

0.76

Discharge site (Home)

Other†

1.39 (1.17 – 1.66)

<0.001

1.37 (0.98 – 1.93)

0.07


1.87 (1.34 – 2.62)

<0.001

0.84 (0.54 – 1.30)

0.43

1.78 (1.20 – 2.65)

0.004

2.80 (1.14 – 6.85)

0.02

Hospital LOS

(0-7 days)

8-11 days

1.02 (0.84 – 1.24)

0.85

0.92 (0.58 – 1.46)

0.72

1.00 (0.75 – 1.34)

0.99


0.84 (0.52 – 1.38)

0.49

1.18 (0.65 – 2.14)

0.60

1.38 (0.62 – 3.07)

0.43


12-19 days

1.12 (0.91 – 1.37)

0.29

1.26 (0.85 – 1.87)

0.25

0.86 (0.59 – 1.26)

0.44

1.35 (0.85 – 2.15)

0.20

1.21 (0.68 – 2.15)

0.51

1.25 (0.49 – 3.15)

0.64


20+ days

1.53 (1.20 – 1.94)

0.0006

1.26 (0.79 – 2.01)

0.33

1.04 (0.62 – 1.75)

0.88

2.41 (1.41 – 4.11)

0.001

1.09 (0.58 – 2.07)

0.78

3.24 (1.26 – 8.30)

0.01

*Other includes Asian, Hispanic, and unknown.  †Other includes discharge to in-patient rehabilitation facility, nursing home and other acute care facilities.