Medical genetics concepts are needed in many courses throughout the medical school. Their early introduction are recommended; however, no study indicates at which year should medical genetics be introduced with the new teaching method, Team-based learning (TBL). Here, we aim to compare introduction of medical genetics TBL sessions by comparing the students’ performance and evaluation of sessions between the first and second year of medical education. The same TBL sessions of medical genetics were introduced to both first year of medical education (Med-I) and second year of medical education (Med-II) students. The test scores and evaluation questionnaire scores were gathered. All these data were compared statistically between the two years, where p< 0.01 indicated a significant difference. Hundred- two Med-I students and eighty-six Med-II students completed the sessions. The test scores showed significantly higher or similar values for Med-I than Med-II students for the medical genetics TBL sessions. Also, both Med-I and Med-II students evaluated these sessions highly. Thus, the medical genetics course using TBL methodology can be introduced in the first year of medical school instead of second year as evidenced by the good performance outcomes and high scores of students’ evaluations.
academic year, medical genetics, students’ performance, students’ session evaluation, team-based learning
Medical genetics course introduces the medical students to the basic concepts in mode of inheritance, cytogenetics, etiology and pathology of various diseases, in addition to some advanced concepts and molecular diagnostics. These concepts are mostly applied rather than used as theoretical data in other medical courses.
Teaching of medical genetics concepts is recommended to be divided throughout the four years medical education [1]. A survey of US and Canadian medical schools showed that 77% of them introduced medical genetics early on the first year. However, 86% reported introduction of general concepts and only 11% introduced practical application [2]. Earlier introduction to various medical concepts will provide students with the basis necessary to better understand and incorporate these genetic concepts in subsequent courses. Moreover, the early introduction of medical genetics will decrease the load of knowledge to be learned in the second year and enable focusing more on disease-specific topics.
Some studies have introduced teaching methodologies to improve the application of genetics knowledge in the first year students. Simulation-based virtual learning experience in medical genetics in a class consisting of a majority of medical students increased their comprehension of material and its applicability as well as increasing motivation and self-efficacy feelings [3]. Also, virtual diagnostic laboratory methodology has been used for teaching genetic testing in first year medical students [4].
The TBL method is being currently used extensively in medical education and has been established as teaching method for the medical genetics course at our institution. Team-based learning (TBL) is proposed as teaching method in medical education because it reinforces the course concepts with hands-on case discussions, in addition to being a resource-conscious method [5]. TBL session used in first year medical curriculum has shown to enhance students’ understanding of the course content and has improved their engagement [6]. So, we hypothesize that TBL can be used to teach medical genetics in the first year medical students.
Both basic and advanced concepts of medical genetics can be successfully incorporated in the first year medical curriculum with TBL methodology because it will help in learning basic concepts as well as advanced concepts through the case discussions and it will help improve the practical application of knowledge lacking in current curriculums. However, whether first or second year will be more appropriate for introduction of medical genetics course using TBL methodology in medical school has, to be the best of our knowledge, not been reported in literature.
In this study, we aim to compare TBL sessions in medical genetics between the first and second year of medical education in terms of the students’ performance assessed by the test scores and the students’ evaluation of these session by evaluation questionnaire outcome.
The Institutional Review Board at our institution has determined this study to be only analyses of de-identified coded data.
The test scores and evaluation scores of medical genetics TBL sessions were obtained for the students for consecutive academic years as representative of second year of medical education (Med-II) and first year of medical education (Med-I), respectively. The TBL sessions taught the same material in both years and followed the same method as chromosomal conditions, Mendelian inheritance with advanced concepts, complex and non-Mendelian inheritance, and molecular diagnostics.
The scores of IRAT (6 questions) and GRAT from the two years were collected for both TBL sessions in the medical genetics. The IRAT and GRAT scores were reported as a percentage of correct answers and presented as percent of 100.
Also, the students evaluated the TBL sessions with respect to four parameters: ability to use the information gained in applications, understanding of the course material, interest in the gained knowledge, and critical analyze capability. These parameters were scaled by Likert scale with 1 presenting the highest effect and 5 as almost no effect.
The statistical analyses were performed using SPSS 17. The mean and standard deviation (SD) of each test were obtained and the average was also calculated for each year. Then, the mean of exam scores for each session were compared by student’s test, where p<0.01 indicates a significant difference.
As for evaluation of TBL sessions, the mean and SD were calculated for each of the studied parameters and compared between the two years for each parameter using student’s test. Also, the distribution between the two years was assessed using the non-parametric independent sample Kolmogorov-Smirnov Z test. Statistical significance was noted with p<0.01.
There were 86 Med-II students (1-3 absent students on one or more exams) and 102 Med-I students (no absent students on exams). The IRAT improved between first and second session of TBL (Table 1). The Med-I students scored higher than Med-II students (78.94 ± 13.35 versus 87.25 ± 11.17). And, the distribution of IRAT scores between the two academic years was also significantly different (Table 2). The GRAT exam scores reported maximum score or 100% for all groups during all sessions; thus, there was no difference between sessions or academic years.
Table 1. Individual Readiness Assessment Test scores in the first and second medical years.
Sessions |
Sample size (n) |
Scores
(mean ± SD) |
p-value |
Med-I |
Session 1 |
102 |
84.48 ± 15.78 |
*0.0002 |
Session 2 |
102 |
90.03 ± 13.93 |
Med-II |
Session 1 |
85 |
73.33 ± 19.56 |
*0.0083 |
Session 2 |
86 |
83.33 ± 14.18 |
Med-I represents the scores of students who took TBL session in the first year and Med-II represents scores of those who took it in the second medical year.
The scores are percentages out of 100.
* p-value is comparison between the two TBL sessions of the same academic year where p<0.05 is considered statistically significant.
Table 2. Comparison of average and distribution of Individual Readiness Assessment Test scores between the first and second academic years.
|
Med-I |
Med-II |
p-value |
Kolmogorov-Smirnov Z |
Average score of TBL sessions (%) |
87.25 ± 11.17 |
78.94 ± 13.35 |
<0.0001 |
2.654 |
Sample size (n) |
102 |
83 |
The session evaluation by students revealed a slightly higher means for all parameters in Med-I academic year versus Med-II, although it was not always translated into statistical significance (Table 3). The graphs of TBL session evaluation were skewed to the right in all parameters for both Med-II and Med-I students. This skewing was noted to be more severe in Med-II students than those of Med-I (Figure 1). However, the student’s test for the difference between means (Table 3) and Kolmogorov-Smirnov test for difference between distributions of outcomes (Table 4) did not show any significant difference between the academic years except for the critical analysis applicability parameter (p<0.01).
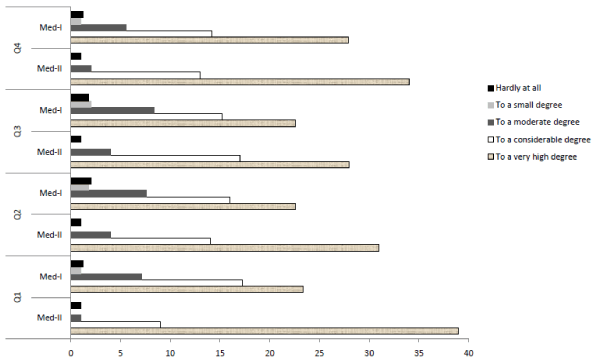
Figure 1. The distribution of TBL session’s evaluation by students of first (Med-I) and second (Med-II) year of medical school shown in four quartiles (Q1- Q4).
Table 3. The evaluation of TBL sessions by students of first and second year of medical school.
Session evaluation questions |
Med-I
(mean ± SD) |
Med-II
(mean ± SD) |
p-value |
The session taught me how to apply what I learnt from the readings |
1.79 ± 0.94 |
1.30 ± 0.71 |
*0.0014 |
The session enhanced my understanding of the material |
1.89 ± 1.05 |
1.52 ± 0.81 |
*0.0304 |
The session stimulated my interest in the material |
1.90 ± 1.05 |
1.58 ± 0.81 |
0.0606 |
The case promoted critical thinking |
1.67 ± 0.94 |
1.42 ± 0.76 |
0.1048 |
* p<0.05 is statistically significant
Table 4. Distribution ofstudent’s evaluation scores of TBL sessions between the two years.
Evaluation Parameters |
Most Extreme Differences |
Kolmogorov-Smirnov Z |
p-value |
The session taught me how to apply what I learnt from the readings |
0.310 |
1.790 |
*0.003 |
The session enhanced my understanding of the material |
0.170 |
0.981 |
0.290 |
The session stimulated my interest in the material |
0.150 |
0.866 |
0.441 |
The case promoted critical thinking |
0.120 |
0.693 |
0.723 |
*p<0.05 is statistically significant
In this study, we have incorporated the medical genetics course using TBL methodology in the first year of medical school instead of second year successfully. The course material is the same as previous course given to the second year medical students. The success of this early introduction is assessed from the perspective of faculty through the performance analysis and from the perspective of students’ through course evaluation questionnaire.
Our results show that Med-I students performed better than Med-II students in medical genetics course when using TBL methodology. The performance of students is assessed using the IRAT scores of the medical genetics TBL sessions. The performance is average for Med-II students with 78.94 ± 13.35 as mean percentage of correct answers. The performance for Med-I students is significantly better with 87.25 ± 11.17 as mean percentage. This higher score is recorded despite the recent introduction of the TBL teaching methodology and medical genetics subject to them. This might be due to inherent bias of academically better performing class in case of Med-I versus Med-II students; nonetheless, the early introduction of medical genetics shows no negative effect on performance. Hence, medical genetics TBL sessions can be introduced during the first year of medical education with possibly better test results.
Moreover, the performance will improve as the student become more familiar with the TBL methodology. This is evidenced when the scores are compared between the first and second sessions within the same academic year. Both Med-II and Med-I students scored higher in the second TBL session as compared to the first TBL session (Table 1). This can be attributed to the increasing experience of the faculty member with the methodology and the class as well as students familiarity with the TBL methodology [5].
There was no difference in GRAT between any sessions irrespective of the academic year; however, in all sessions the GRAT scores were the maximum for the test offered, which is an inherent benefit of TBL methodology which encourages teamwork. But the complexity of the cases and applications can be enhanced for the GRAT to be more challenging for all levels of students.
Almost all students have appraised the TBL sessions highly with regard to all four parameters: ability to apply the studied material, high degree of understanding, increased interest in the studied material, and using critical analysis of the information presented. Thus, both Med-II and Med-I students are highly satisfied with medical genetics course.
However, Med-II students have evaluated the course statistically higher than Med-I students for the application of the information and the understanding of the study material. When we consider the distribution of outcomes between the two academic years, the statistical significance between outcomes is only noted for the ability to apply the gained information. This might be explained by the fact that second year medical students will have gained abilities to utilize the gained information not only in TBL session but also in other courses. In either case, the scores for all parameters are still more than 2 over 5; thus, the TBL session is highly evaluated for both Med-II and Med-I students.
The undisputable good performance and the high students’ evaluation of the medical genetics TBL sessions in the first year provides good evidence of feasibility of application of the TBL sessions of the medical genetics subject early on in the medical education.
This study showed that the medical genetics course can be incorporated in the first year curriculumsuccessfully, as evidenced by the good performance outcomes and high scores of students’ evaluations.
The authors have no conflict of interest or funding source to declare. The authors want to thank Dr. Nathalie Zgheib for her assistance and guidance in the TBL session and for reviewing this manuscript.
- Robinson DM, Fong CT (2008) Genetics in medical school curriculum: A look at the University of Rochester School of Medicine and Dentistry. J Zhejiang Univ Sci B 9: 10-15.
- Thurston VC, Wales PS, Bell MA, Torbeck L, Brokaw JJ (2007) The Current Status of Medical Genetics Instruction in U.S. and Canadian Medical Schools. Academic Medicine 82: 441-445.
- Makransky G, Bonde MT, Wulff JSG, Wandall J, Hood M, et al. (2016) Simulation based virtual learning environment in medical genetics counseling: an example of bridging the gap between theory and practice in medical education. BMC Med Educ 16: 98. [Crossref]
- Bean LJ, Fridovich-Keil J, Hegde M, Rudd KM, Garber KB (2011) The virtual diagnostic laboratory: A new way of teaching undergraduate medical students about genetic testing. Genetics in Medicine 13: 973-977.
- Zgheib NK, Simaan JA, Sabra R (2009) Using team based learning to teach pharmacology to second year medical students improves student performance. Medical Teacher 32: 130-135.
- Punja D, Kalludi SN, Pai KM, Rao RK, Dhar M (2014) Team-based learning as a teaching strategy for first-year medical students. Australas Med J 7: 490-499.