Abstract
Background: Down syndrome (DS) population frequently presents autonomic and hormonal dysfunctions that have not been concurrently investigated, and yet could limit adaptations to stress.
Methods: We compared 11 control (CONT) and 11 DS adult subjects during three autonomic stimulation tests. Heart rate, blood pressure and hormonal concentrations were measured continuously during these tests.
Results: DS subjects showed lower systolic blood pressure in the 3 tests (p<0.05) and blunted baroreflex sensitivity in 2 tests. Handgrip test induced increased heart rate (p<0.001) systolic blood pressure (p<0.01) and norepinephrine (p<0.05) in CONT only. During cold pressor test, ACTH and norepinephrine concentrations were higher during immersion than at rest (p<0.01 and p<0.001 respectively) in DS only. During head-up tilt test, ACTH and cortisol concentrations were higher in DS in both positions (p<0.05).
Conclusion: These results support the hypothesis of altered hormonal and vascular responses to autonomic provocation tests in DS subjects.
Introduction
With a prevalence of 1 in 700 live births [1] Down syndrome (DS) is the most common chromosomal genetic disorder. This syndrome affects several systems and is associated with a wide spectrum of cognitive and physiological impairments. Specifically, these characteristics include hypotonia, short stature, overweight, endocrine disorders and dysautonomia [2,3]. The autonomic dysfunction in this population could be associated with increased morbidity and mortality [4,5]. It has been shown that subjects with DS have a blunted cardiovascular response to exercise or autonomic stimulation including chronotropic incompetence, reduced heart rate and blood pressure [6-9]. A reduced sympathetic activation and a blunted parasympathetic withdrawal seem to be involved in these cardiovascular responses [7,10]. Hormonal perturbations could also be partially involved in these altered adaptations [8,9,11]. In fact, epinephrine and norepinephrine concentrations are reduced in DS compared to control (CONT) subjects during a stress such as physical exercise [6,12,13]. It suggests a reduced sympathetic response because heart rate response to a stress is regulated by norepinephrine. In addition, some authors have also observed reduced catecholamine’s concentrations during sleep in children with DS compared to typically developed children [10]. Nevertheless, if Jansen et al. [14] have established a link between hormonal and autonomic functions in autism spectrum population, this relation has not been widely explored in subjects with DS.
To our knowledge, hormonal and autonomic responses to autonomic tests have not yet been concurrently assessed. Therefore, the aim of this study was to compare autonomic and hormonal responses to 3 autonomic nervous system provocation tests between DS and CONT subjects. We hypothesized that subjects with DS had impaired responses compared to CONT.
Methods
Participants’ characteristics
Twenty-two young male participants were recruited: 11 subjects without DS nor intellectual disability (CONT: 22±2 years old, from 20 to 25) and 11 subjects with DS (DS: 22±4 years old, from 18 to 29) who presented free and homogeneous trisomy. The participants did not have cardiac insufficiency nor cardiovascular disease; severe disease (e.g. diabetes, leukemia, or obstructive sleep apnea); medication that may alter the cardiovascular or autonomic response; and asthma nor other respiratory disorder, verified on a medical visit. All participants and the legal representatives of the participants with DS received information about the study design and provided their written informed consent. This study was approved by the local ethic committee of the hospital (2009-A00376-51/1).
Height and weight were measured on the first medical visit. This visit permitted subjects to familiarize with the different tests. Body composition was assessed by subcutaneous skin fold measurement using a Lange Skinfold Caliper (Cambridge Scientific Industries, Cambridge, Maryland, USA). Body fat percentage was measured on four skinfold sites: triceps, biceps, subscapular and supra-iliac [15]. Body mass index was calculated as weight divided by height squared (kg/m2). The physical characteristics of the subjects are shown in Table 1.
Table 1. Characteristics of participants at rest.
|
CONT |
DS |
Age (years) |
22 ± 2 |
22 ± 4 |
Height (cm) |
176.1 ± 9.1 |
158.7 ± 5.7aa |
Weight (kg) |
67.2 ± 7.3 |
59.3 ± 7.8aa |
BMI (kg.m-²) |
21.7 ± 2.1 |
23.5 ± 2.7 |
Fat Mass (%) |
15.7 ± 4.4 |
19.3 ± 3.6 |
Resting HR (bpm) |
59 ± 7 |
59 ± 8 |
SBP (mmHg) |
122 ± 12 |
111 ± 13aa |
DBP (mmHg) |
81 ± 4 |
75 ± 8aa |
MVC (N) |
504 ± 113 |
242 ± 71aaa |
CONT: Control; DS: Down syndrome. aap<0.01, aaap<0.001 significant difference between CONT and DS. The effect size values are shown in italics and in parentheses. Values are means ± SD. BMI: body mass index; HR: heart rate; SBP: systolic blood pressure; DBP: diastolic blood pressure; MVC: maximal voluntary contraction
Study design
Three standard cardiovascular reflex tests were used to assess cardiovascular autonomic function, following the same order for all participants: (1) Handgrip + ischemia test (HIT); (2) cold pressor test (CPT) and (3) head-up tilt test (HUTT). A 15-minutes resting time was given between each test (Figure 1).
Figure 1. Protocol time frame.
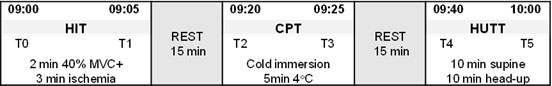
HIT: handgrip + ischemia test; CPT: cold pressor test; HUTT: Head-up tilt test; T0: blood sample before contraction; T1: blood sample after contraction; T2: blood sample before immersion; T3: blood sample after immersion; T4: blood sample in supine position; T5: blood sample in head-up position
These three tests were performed during the same morning visit, under the same conditions: in a quiet environment with controlled temperature. Hormonal parameters (cortisol, adrenocorticotropic hormone (ACTH), epinephrine and norepinephrine) were collected using a venous catheter at six different times, at rest and after stimulation: T0HIT rest, T1after HIT, T2CPT rest, T3after CPT, T4HUTT rest, T5after HUTT (Figure 1).
Heart rate (HR) and blood pressure (BP) were measured continuously in resting and stimulation situations.
During the first period of rest, in a seated position, participants performed a maximum voluntary contraction using a handgrip dynamometer (SMFD500TR 1300N, Sensel Measurements, Vincennes France). The handgrip was held in the dominant hand and allowed to determine the maximal voluntary contraction (Table 1).
1) Handgrip + ischemia test
In a seated position, handgrip was maintained at 40% of the maximum voluntary contraction for 2 minutes using a dynamometer, followed by 3 minutes of peripheral ischemia. Ischemia was obtained by laying a tensiometer inflated on the biceps.
2) Cold pressor test
The participant was in a semi-supine position and his right hand was immerged into ice-cold water (6°C) for 5 min. The participant was instructed to breathe normally and to avoid any muscular contraction of his hand.
3) Head-up tilt test
The test was performed on a motorized tilt table allowing passive position changes. Participants were instructed to breathe normally, to be quiet and to avoid any movement. After 10 minutes in the supine position the participant was head-up tilted to a 70° level on the electrical table for 10 min. The duration of the tilting maneuver from and to the supine position was of 30s for each change of position.
Cardiovascular measurements
Heart rate and blood pressure responses were monitored continuously during the 3 tests.
Beat-to-beat heart rate was measured with a Medical electrocardiogram Monitor cardio (Nexfin HD-BMeye, technology Finapres, Amsterdam; Netherlands). Electrocardiogram electrodes were placed on the chest using a six lead configuration and determined successive R-R intervals (electrocardiogram signal: 1000Hz; recording frequency: 1s).
Beat-to-beat blood pressure in the finger arterioles, systolic blood pressure (SBP) and diastolic blood pressure (DBP) were measured using a blood pressure cuff (Nexfin HD-BMeye). The cuff was applied to the middle phalanx of the middle finger.
Heart rate variability (HRV) analysis
R-R intervals were analyzed over two periods of the tests: in a resting period and a stimulation period. Data were exported to the Kubios HRV software (Biosignal Analysis, Department of Applied Physics, University of Kuopio, Finland) which allowed the analysis of HRV. Spectral analysis was performed with a Fast Fourier Transform to quantify the spectral density of the low frequency (LF; 0.04 to 0.15 Hz) and the high frequency (HF; 0.15 to 0.40 Hz) power bands. All these components were expressed in normalized units (nu) [16]. The data acquisition and processing strategy was conformed to consensus panel recommendations for the assessment of cardiovascular variability [16]. In the time domain we obtained the mean heart rate (bpm), the mean R-R interval (ms), the square root of the mean of the sum of the squares of differences between adjacent R-R intervals (rMSSD; ms, (estimate of short-term HRV components) and the proportion of interval differences of successive R-R intervals greater than 50 ms (pNN50; %) that reflects parasympathetic activity [16].
Blood pressure variability (BPV) analysis
The sequential series of successive systolic blood pressure were subjected to a discrete Fast Fourier transform to yield power spectra of the rhythmic oscillations over a frequency range of 0.02–0.50 Hz, with a resolution of 0.01 Hz. Blood pressure rhythmic oscillations were analyzed with the same recommendations as those described for HRV analysis. For each time segment, the power was calculated for the low frequency band (LFBPV: 0.07–0.15 Hz) [17] in addition to mean SBP and DBP values. In the BPV only the LF band was presented because it reflects sympathetic activity related to vascular tone control [18,19]. The simultaneous blood pressure and heart rate variabilities analysis allowed the calculation of the baroreflex sensitivity index (αLF) as: αLF = √(LFHRV/LFBPV) [20] in the 0.07-0.15 Hz range [21].
Biological analysis
Hormonal variables were assayed in plasma samples. The blood samples were immediately centrifuged (3000g, 10min) and aliquoted, frozen and stored at −80 °C before analysis. In order to prevent epinephrine and norepinephrine catabolism we used specific tubes containing protease inhibitor (Becton Dickinson France, Le Pont de Claix, France). These two hormones were tested by high-performance liquid chromatography with electrochemical detection. ACTH was measured using an IRMA method (Brahms kit with a sensitivity of 0.5pmol/L).
Statistical analysis
Data were expressed as means ± standard deviations. Two-way-repeated measures analysis of variance (ANOVA) were used to assess the effects of groups and of the testing condition. When significant, we compared DS and CONT groups using ANOVA test (Statistica Software 8.0). We compared resting and stimulation situations using paired sample t-tests. Pearson correlations were performed to observe possible links between hormonal and autonomic functions. Significance was considered when p<0.05.
Results
Both groups were paired in age, body mass index, fat mass and HRrest. Subjects with DS were significantly shorter than control subjects (p<0.01). They also had lower systolic and diastolic blood pressure than CONT (p<0.01), a lower weight (p<0.01) and a lower maximal voluntary contraction (p<0.001; Table 1).
Handgrip + ischemia test (Table 2)
Table 2. Handgrip + ischemia test responses in CONT and DS groups.
Handgrip + ischemia test
Cardiac responses |
CONT |
DS |
T0 Rest |
T1 post ischemia |
T0 Rest |
T1 post ischemia |
HR (bpm) |
68 ± 11 |
90 ± 14bbb |
72 ± 10 |
81 ± 14 |
rMSSD |
47.8 ± 15.8 |
41.7 ± 14.1 |
40.1 ± 20.9 |
39.0 ± 24.3 |
PNN50 (%) |
24.5 ± 11.9 |
15.9 ± 7.2 |
18.4 ± 16.5 |
16.1 ± 17.5 |
LF (nu) |
70.5 ± 10.0 |
66.7 ± 9.3 |
74.7 ± 8.4 |
69.1 ± 12.1 |
HF (nu) |
29.5 ± 10.0 |
33.3 ± 9.3 |
25.3 ± 8.4 |
30.9 ± 12.1 |
LF/HF |
2.8 ± 1.3 |
2.2 ± 0.7 |
3.4 ± 1,5 |
2.9 ± 2.1 |
Vascular responses |
T0 Rest |
T1 post ischemia |
T0 Rest |
T1 post ischemia |
SBP (mmHg) |
128 ± 17 |
155 ± 18bb |
108 ± 33 |
130 ± 13aa |
DBP (mmHg) |
71 ± 8 |
89 ± 9bbb |
70 ± 6 |
79 ± 8ab |
LFBPV (mmHg²) |
6 ± 5 |
53 ± 12bb |
9 ± 5 |
26 ± 25aab |
αLF (ms/mmHg) |
20.53 ± 8.37 |
5.35 ± 1.31bbb |
12.43 ± 3.45a |
9.99 ± 5.74aa |
Hormonal responses |
T0 Rest |
T1 post ischemia |
T0 Rest |
T1 post ischemia |
ACTH (pmol/L) |
5.2 ± 2.3 |
8.7 ± 6.4 |
6.4 ± 2.7 |
7.2 ± 3.4 |
Cortisol (nmol/L) |
321 ± 134 |
341 ± 132 |
359 ± 106 |
347 ± 111 |
Epinephrine (pmol/L) |
226 ± 197 |
282 ± 253 |
249 ± 216 |
251 ± 196 |
Norepinephrine (pmol/L) |
1851 ± 792 |
3327 ± 1739b |
2281 ± 520 |
2948 ± 1021 |
ap<0.05; aap<0.01: significant difference between CONT and DS groups; bp<0.05; bbp<0.01; bbbp<0.001: significant difference between the 2 tests conditions.. Values are means ± SD. rMSSD: root mean square of successive differences; PNN50: percentage of absolute differences in successive RR values>50 ms; LF: low frequency; HF: high frequency; LF/HF: low frequency/high frequency ratio. . SBP: systolic blood pressure; DBP: diastolic blood pressure; LFBPV: low frequency of blood pressure variability; αLF baroreflex sensitivity
HR was significantly increased after ischemia in CONT group only (p<0.001).
At rest αLF was significantly lower in DS group compared to CONT (p<0.05) but significantly higher than CONT after ischemia (p<0.01). SBP (p<0.01), DBP (p<0.05) and LFBPV (p<0.01) were significantly lower in DS compared to CONT group after ischemia (Table 3). DBP and LFBPV were significantly higher after ischemia than at rest in both groups (p<0.05). SBP was significantly higher after ischemia than at rest in DS group only (p<0.01). αLF was significantly lower after ischemia than at rest in CONT group only (p<0.01).
Table 3. Cold pressor test responses in CONT and DS groups
Cold pressor test
Cardiac responses |
CONT |
DS |
T2 Rest |
T3 post immersion |
T2 Rest |
T3 post immersion |
HR (bpm) |
68 ± 9 |
73 ± 13 |
69 ± 8 |
77 ± 10 |
rMSSD |
49.8 ± 23.6 |
46.1 ± 25.5 |
42 ± 20.3 |
45.6 ± 22.8 |
PNN50 (%) |
24 ± 12.9 |
20.2 ± 15.3 |
19.4 ± 16.4 |
18.5 ± 13.2 |
LF (nu) |
68.4 ± 8.6 |
71.3 ± 11.1 |
69.8 ± 10.3 |
70.6 ±10.0 |
HF (nu) |
31.6 ± 8.6 |
28.7 ± 11.1 |
30.2 ± 10.3 |
29.4 ± 12.0 |
LF/HF |
2.4 ± 1.0 |
2.9 ± 1.3 |
2.6 ± 1.1 |
3.0 ± 1.7 |
Vascular responses |
T2 Rest |
T3 post immersion |
T2 Rest |
T3 post immersion |
SBP (mmHg) |
129 ± 13 |
144 ± 18b |
118 ± 10a |
132 ± 17b |
DBP (mmHg) |
72 ± 7 |
84 ± 9bb |
71 ± 6 |
84 ± 10bb |
LFBPV (mmHg²) |
6 ± 4 |
2 ± 3b |
8 ± 6 |
14 ± 19a |
αLF (ms/mmHg) |
18.93 ± 5.34 |
29.76 ± 10.29bb |
15.19 ± 4.93 |
12.10±4.03aaa |
Hormonal responses |
T2 Rest |
T3 post immersion |
T2 Rest |
T3 post immersion |
ACTH (pmol/L) |
5.2 ± 1.6 |
5.6 ± 1.5 |
5.9 ± 2.2 |
12.8 ± 7.6bbaaa |
Cortisol (nmol/L) |
366 ± 129 |
337 ± 116 |
342 ± 130 |
340 ± 121 |
Epinephrine (pmol/L) |
218 ± 180 |
222 ± 137 |
201 ± 152 |
301 ± 287 |
Norepinephrine (pmol/L) |
1970 ± 730 |
2930 ± 1448 |
2255 ± 557 |
3701 ± 1096bbb |
ap<0.05; aaap<0.001: significant difference between CONT and DS groups; bp<0.05; bbp<0.01; bbbp<0.001: significant difference between the 2 tests conditions. Values are means ± SD. rMSSD: root mean square of successive differences; PNN50: percentage of absolute differences in successive RR values>50 ms; LF: low frequency; HF: high frequency; LF/HF: low frequency/high frequency ratio. . SBP: systolic blood pressure; DBP: diastolic blood pressure; LFBPV: low frequency of blood pressure variability; αLF baroreflex sensitivity
Norepinephrine was higher after ischemia than at rest in CONT group only (p<0.05).
Cold pressor test (Table3)
There was no significant HRV difference between the two groups and between the 2 conditions (Table 2).
SBP and DBP were significantly higher after immersion than at rest in both groups (p<0.01). LFBPV was significantly lower, and αLF significantly higher after immersion than at rest in CONT group only (p<0.01). After ischemia, LFBPV (p<0.05) was significantly higher, and αLF significantly lower in DS than in CONT group (p<0.01).
After immersion ACTH was significantly higher in DS than in CONT group (p<0.001). ACTH was significantly higher after immersion than at rest (p<0.001) in DS only. Norepinephrine was significantly higher after immersion in both groups (p<0.01 in CONT and p<0.001 in DS).
Head-up tilt test (Table 4)
Table 4. Head-up tilt test responses in CONT and DS groups
Head-up tilt test
Cardiac responses |
CONT |
DS |
T4 Supine |
T5 HUT |
T4 Supine |
T5 HUT |
HR (bpm) |
61 ± 9 |
84 ± 12bbb |
66 ± 7 |
87 ± 10bbb |
rMSSD |
60.1 ± 18.8 |
28.4 ± 10.3bbb |
52.6 ± 27.4 |
20.5 ± 12.2bb |
PNN50 (%) |
35.3 ± 16.6 |
7.4 ± 5.9bbb |
26.9 ± 20.0 |
4.3 ± 6.2bb |
LF (nu) |
60.5 ± 11.5 |
87.7 ± 4.2bbb |
63.5 ± 13.6 |
83.6 ± 6.7bbb |
HF (nu) |
39.5 ± 11.5 |
12.3 ± 4.2bbb |
36.4 ± 13.6 |
16.4 ± 6.6bbb |
LF/HF |
2.2 ± 2.8 |
8.0 ± 2.8bbb |
2.1 ± 1.2 |
6.0 ± 2.8bbb |
Head-up tilt test
Vascular responses |
CONT |
DS |
T4 Supine |
T5 HUT |
T4 Supine |
T5 HUT |
SBP (mmHg) |
121 ± 11 |
117 ± 11 |
104 ± 31 |
97 ± 29a |
DBP (mmHg) |
69 ± 6 |
72 ± 8 |
70 ± 4 |
70 ± 8 |
LFBPV (mmHg²) |
10 ± 8 |
10 ± 5 |
8 ± 5 |
12 ± 13 |
αLF (ms/mmHg) |
19.74 ± 13.57 |
15.85 ± 5.85 |
14.97 ± 5.66 |
10.25 ± 6.72 |
Head-up tilt test
Hormonal responses |
CONT |
DS |
T4 Supine |
T5 HUT |
T4 Supine |
T5 HUT |
ACTH (pmol/L) |
4.4 ± 1.4 |
4.9 ± 1.7 |
7.1 ± 2.8aa |
9.0 ± 5.3a |
Cortisol (nmol/L) |
298 ± 90 |
279 ± 77 |
403 ± 136a |
379 ± 131a |
Epinephrine (pmol/L) |
173 ± 111 |
254 ± 172 |
172 ± 131 |
192 ± 138 |
Norepinephrine (pmol/L) |
1740 ± 542 |
2361 ± 579b |
2063 ± 576 |
2689 ± 470b |
ap<0.05; aap<0.01: significant difference between CONT and DS groups; bp<0.05; bbp<0.01; bbbp<0.001: significant difference between the 2 tests conditions. Values are means ± SD. rMSSD: root mean square of successive differences; PNN50: percentage of absolute differences in successive RR values>50 ms; LF: low frequency; HF: high frequency; LF/HF: low frequency/high frequency ratio. . SBP: systolic blood pressure; DBP: diastolic blood pressure; LFBPV: low frequency of blood pressure variability; αLF baroreflex sensitivity
Differences between supine and HUT position were found in the two groups. rMSSD (p<0.001), pNN50 (p<0.001) and HF (p<0.001) were lower in HUT position. LF (p<0.001), LF/HF (p<0.001 for CONT and p<0.01 for DS group) and HR (p<0.001) were higher in HUT position.
SBP was significantly lower in DS group compared to CONT in HUT position (p<0.05).
ACTH and cortisol concentrations were significantly higher in DS compared to CONT group in both conditions (Table 4).
Norepinephrine concentrations were positively related to SBP and DBP in HUT position (r=0.74; p<0.05 and r=0.79; p<0.05, Figure 2a, 2b respectively) in CONT group only.
Figure 2. Relation between hormonal and vascular responses to head-up tilt test position.
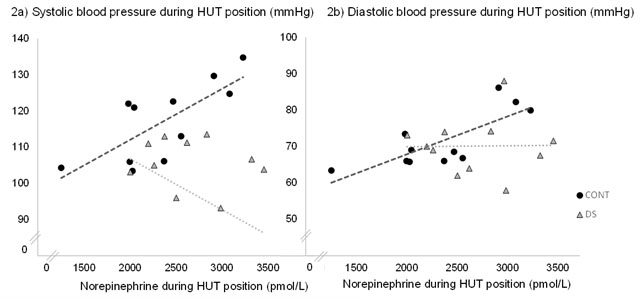
HUT: head-up tilt; LF: low frequency: SBP: systolic blood pressure; DBP: diastolic blood pressure
2a: correlation between systolic blood pressure and norepinephrine concentration in HUT position r=0.74; p<0.05
2b: correlation between diastolic blood pressure and norepinephrine concentration in HUT position r=0.79; p<0.05
Discussion
The aim of this work was to compare autonomic function and hormonal responses to autonomic provocation tests between DS and CONT subjects. Anthropometric characteristics of DS observed in our study correspond to the classical profile of subjects with Down syndrome, with small height and high relative weight [22,23].
The main results showed altered vascular and hormonal responses in DS compared to CONT after an autonomic test with a lower sympathetic activation observed in handgrip + ischemia and cold pressor tests in DS group. Blood pressure was lower in DS in the 3 tests compared to CONT, with altered baroreflex sensitivity found in cold pressor and handgrip + ischemia tests. Hormonal kinetics was different between the two groups in cold pressor and HUT tests with higher ACTH and cortisol concentrations in DS.
Handgrip + ischemia test aims to investigate the role of muscle metaboreflex in neural cardiovascular regulation. In response to ischemia, metaboreceptors induce a sympathetic activation in order to maintain a sufficient blood pressure. In our study, CONT showed an appropriate HR adaptation to contraction and ischemia with a significant increase. This result was not found in DS group and is concordant with Fernhall and Otterstetter [7] who explained this result by a blunted vagal withdrawal in DS group, associated to a lower sympathetic activation.
In addition blood pressures were significantly lower in DS compared to CONT group with a lower amplitude response to contraction. Fernhall and Otterstetter [7] claimed that these low pressor values could be a function of reduced sympathetic stimulation and blunted vagal withdrawal during handgrip + ischemia test. Moreover, in our study LFBPV values were lower in DS compared to CONT during contraction as observed in several studies [7,8]. These values of DS group provide evidence of a reduced sympathetic activity during handgrip test as LFBPV is a measure of vascular sympathetic modulation [18,19].
The low baroreflex delta observed in DS could reflect an inadequate autonomic modulation in response to handgrip + ischemia, arguing for a dysautonomia in this population. In fact CONT group showed a wide decrease of baroreflex sensitivity index during contraction whereas in DS only a slight difference (by 24% vs 73% for CONT) was found arguing in favor of an altered baroreflex sensitivity. In numerous studies baroreflex decreases during isometric exercise, caused by a reset of barosensitivity to a higher set-point during static contraction [24,25]. As this baroreflex modulation permits to reduce vagal activity in response to mechanoreceptors [25,26], we can assume that in DS this vagal modulation is not effective and could explain the lower heart rate and blood pressure.
Furthermore, hormonal adaptations confirmed these observations. In CONT there was an increase of norepinephrine following the handgrip + ischemia test whereas it did not occur in DS group (+79% in CONT vs +29% in DS). This hormonal adaptation in CONT reflects a sympathetic adaptation due to stress of contraction and ischemia, which could not be found in DS.
In another hand, the common hypotonia in subjects with DS can limit to sustain a constant contraction during 2 minutes in Down syndrome group. As a result, it could induce a lower amplitude of autonomic response to this test. That was the case in our study with a lower maximal voluntary contraction in DS and difficulties to maintain a static contraction.
2021 Copyright OAT. All rights reserv
The cold pressor test aims to increase systolic blood pressure during immersion [27,28]. In our study SBP and DBP increased in both groups attesting of an appropriate pressor response to immersion. Nevertheless, CONT group showed wider increased values of LFBPV compared to DS (173% for CONT vs -45% for DS). Fernhall and Otterstetter [7] observed similar results and suggested an increase of vascular sympathetic activity in DS associated with a blunted baroreflex sensitivity. Lower baroreflex sensitivity index in DS confirms this alteration as DS did not adjust this index in immersion while CONT presented a significant increase.
Surprisingly, in DS we observed that ACTH concentration was significantly higher than in control subjects during immersion and remained elevated 20 minutes after rest. Because this increase was not accompanied by a cortisol increase, a corticotropic dysfunction should be considered. Murdoch et al. [29] have shown a blunted cortisol response to a Synacthen® test in population with DS, suggesting a cortisol deficiency. In our study this phenomenon seemed to be similar. If ACTH response was effective after stimulation (+54%p<0.01), the cortisol gland did not respond by an appropriate cortisol secretion. This observation was exclusive in DS group and could corroborate the cortical gland deficiency proposed by Murdoch et al. [29]. Moreover norepinephrine concentrations were higher after immersion in DS, and this effect was not observed in CONT group. This observation can reflect a very high stress felt by the participants with DS. Indeed, the hand-immersion into 6°C water has been very difficult and painful for the DS participants. Therefore, the local phenomenon of vasoconstriction mediated by norepinephrine could be higher in DS and be associated to pain signs.
The head-up tilt test aims to increase heart rate in response to orthostatic stress and to induce a blood redistribution to the lower limbs, with a decrease of venous return and a reduction in the diameter of the left ventricle. These adaptations stimulate the baroreceptors which are sensitive to pressure variations and their stimulation activates the vasomotor center, resulting in catecholamine secretion by sympathetic nervous system [30].
In our study we can observe an appropriate cardiac adaptation to HUT test in both groups, with no significant differences between the two groups. This is in line with the cardiac autonomic modulation observed with HUT in a range of different populations [31-34]. An adaptation of parasympathetic tone on HUT stimulation was evidenced by the reduced rMSSD values and HF spectrum (Table 4). This demonstrates that the HUT maneuver adequately induced vagal withdrawal and subsequently led to HR increase. This HR normal adaptation in DS was also described by others [34,35] who found no differences in HUT test between DS and control groups.
While this adaptation occurred in both groups, the hormonal adaptation was different. In participants with DS, the ACTH and cortisol concentrations were higher in supine and HUT position, and ACTH increased by 20% (p<0.05) between supine and tilted positions whereas it increased by 10% (not significant) in the control group. Vascular response was also different in DS group with lower systolic blood pressure in HUT position. This response to head-up tilt test was described in many studies with frequent hypotension in DS, and a lower blood pressure response to stress like exercise, handgrip or orthostatic stress [7,24,36]. Agiovlasitis et al. [37] observed lower blood pressure and no HR differences between DS and control during head-up tilt test. Baroreflex sensitivity was expected to decrease in both groups as observed in other studies [34,35,37]. In our study, αLF values differed significantly between groups and between the test conditions. This inconsistence could be explained by different methodological approaches. Iellamo et al. [34,35] and Agiovlastitis et al. [37] used a sequence method in time domain to calculate baroreflex sensitivity whereas we used an open-Loop technique, in accordance to Barbieri et al. [20].
Finally, relation between norepinephrine and blood pressures in CONT group but not in DS group suggest that increase of norepinephrine is associated with a higher sympathetic activity. This result is expected in general population and is not observed in DS group. In fact it is established that an increase of norepinephrine induces a higher systolic and diastolic blood pressures [38]. In DS group this increase is not associated with an appropriate tensional response, suggesting a blunted vascular response. Thus, despite normal HR and HRV changes, yet hormonal secretions and blood pressure adaptations provide evidence of an autonomic dysfunction in persons with DS as these parameters are mediated by autonomic nervous system.
This work aimed to compare autonomic function and hormonal responses to autonomic provocation tests between DS and CONT subjects. A highlighted relation between autonomic adaptations and hormonal responses made the result of the study original.
A blunted baroreflex sensitivity and a lower sympathetic activation were observed in 2 of the 3 tests in DS group. The head-up tilt test results showed a pertinent experimental test as it showed an appropriate autonomic response in CONT whereas there was a mismatch in participants with DS concerning hormonal and vascular responses. Cold pressor test, used to stimulate the sympathetic system, seemed to provoke lower responses in DS and to induce defense reactions that could alter results. Handgrip test was interesting to complete explorations and to verify baroreflex alterations.
Limitations
Data treatments demand expertise and time. Moreover, HRV and BPV are indirect measures of autonomic nervous system and a direct stimulation of autonomic nerves could be more accurate. Moderate number of subjects constituted a second limit in this work as physiological responses were not homogenous in DS group. As the men-only recruitment was a limit, further investigations are needed to generalize results to women.
Conclusion
To our knowledge this is the first study assessing concurrently hormonal and autonomic responses in population with DS. In addition, this work provided complementary knowledge on HRV utilization in multiple situations that aim to stimulate autonomic nervous system.
Investigation of the cardiovascular system and its regulation mechanisms in physiological conditions demands adapted tools. In our work a special attention was given to supply a non-invasive technique. HRV utilization responds to both criteria: it is a pertinent tool to better understand responses of participants with DS when they undergo stimulation tests, and it allows to identify possible cardiovascular limits to exercise or other stress. In addition, head-up tilt test is widely used in physiology to describe neurovegetative and cardiovascular reflex thanks to its simplicity, reproducibility and the availability of numerous results concerning these adaptations [39-43]. The crossing of the three test results allowed to get an accurate diagnosis respecting Ewing et al. [44] classifications. Moreover, relations between blood pressure and hormonal variables supply complementary information that reinforce HRV observations.
Dysautonomia in persons with DS could induce maladaptation to stress or to physical exercise with inadequate heart rate, blood pressure and endocrine responses. An identification of these autonomic dysfunctions will permit to propose a better clinical management in population with Down syndrome.
Acknowledgment
Authors would like to thank Association Française de Recherches sur la Trisomie.
References
- Parker SE, Mai CT, Canfield MA, Rickard R, Wang Y, et al. (2010) Updated National Birth Prevalence Estimates for Selected Birth Defects in the United States, 2004–2006. Birth Defects Res A Clin Mol Teratol 88: 1008,1016. [Crossref]
- Trois MS, Capone GT, Lutz JA, Melendres MC, Schwartz AR, et al. (2009) Obstructive sleep apnea in adults with Down syndrome. J Clin Sleep Med 5: 317-323. [Crossref]
- Bull MJ; Committee on Genetics (2011) Health supervision for children with Down syndrome. Pediatrics 128: 393-406. [Crossref]
- O'Driscoll DM1, Horne RS, Davey MJ, Hope SA, Walker AM, et al. (2010) The heart rate response to spontaneous arousal from sleep is reduced in children with Down syndrome referred for evaluation of sleep-disordered breathing. Am J Physiol Heart Circ Physiol 298: H1986-1990. [Crossref]
- de Carvalho TD, de Abreu LC, Mustacchi Z, Vanderlei LC, Godoy MF, et al. (2015) Cardiac autonomic modulation of children with Down syndrome. Pediatr Cardiol 36: 344-349. [Crossref]
- Bricout VA, Guinot M, Faure P, Flore P, Eberhard Y, et al. (2008) Are hormonal responses to exercise in young men with Down's syndrome related to reduced endurance performance? J Neuroendocrinol 20: 558-565. [Crossref]
- Fernhall B, Otterstetter M (2003) Attenuated responses to sympathoexcitation in individuals with Down syndrome. J Appl Physiol (1985) 94: 2158-2165. [Crossref]
- Figueroa A, Collier SR, Baynard T, Giannopoulou I, Goulopoulou S, et al. (2005) Impaired vagal modulation of heart rate in individuals with Down syndrome. Clin Auton Res 15: 45-50. [Crossref]
- Léti T, Guinot M, Favre-Juvin A, Bricout VA (2015) Difference of catecholamine responses to exercise in men with trisomy 21, with or without chronotropic incompetence. Physiol Behav 142: 97-103. [Crossref]
- O'Driscoll DM1, Horne RS, Davey MJ, Hope SA, Walker AM, et al. (2012) The heart rate response to spontaneous arousal from sleep is reduced in children with Down syndrome referred for evaluation of sleep-disordered breathing. Am J Physiol Heart Circ Physiol. [Crossref]
- Fernhall B, Figueroa A, Collier S, Baynard T, Giannopoulou I, et al. (2005) Blunted heart rate response to upright tilt in people with Down syndrome. Arch Phys Med Rehabil 86: 813-818. [Crossref]
- Eberhard Y, Eterradossi J, Therminarias A (1991) Biochemical changes and catecholamine responses in Down's syndrome adolescents in relation to incremental maximal exercise. J Ment Defic Res 35: 140-146. [Crossref]
- Fernhall B, Baynard T, Collier SR, Figueroa A, Goulopoulou S, et al. (2009) Catecholamine response to maximal exercise in persons with Down syndrome. Am J Cardiol 103: 724-726. [Crossref]
- Jansen LMC, Gispen-de Wied CC, Wiegant VM, Westenberg HGM, Lahuis BE, et al. (2006) Autonomic and Neuroendocrine Responses to a Psychosocial Stressor in Adults with Autistic Spectrum Disorder. J Autism Dev Disord 36: 891-899. [Crossref]
- Durnin JV, Womersley J (1969) The relationship between skinfold thickness and body fat in adults of middle age. J Physiol 200: 105P-106P. [Crossref]
- TaskForce (1996) Heart rate variability: standards of measurement, physiological interpretation and clinical use. Task Force of the European Society of Cardiology and the North American Society of Pacing and Electrophysiology. Circulation 93: 1043-1065. [Crossref]
- Grosch S, Saint-Remy A, Krzesinski JM (2005) [Blood pressure variability]. Rev Med Liege 60: 147-153. [Crossref]
- Malliani A(1999) The Pattern of Sympathovagal Balance Explored in the Frequency Domain. News Physiol Sci 14: 111-117. [Crossref]
- Parati G, Mancia G, Di Rienzo M, Castiglioni P (2006) Point: cardiovascular variability is/is not an index of autonomic control of circulation. J Appl Physiol (1985) 101: 676-678. [Crossref]
- Barbieri R, Parati G, Saul JP (2001) Closed- versus open-loop assessment of heart rate baroreflex. IEEE Eng Med Biol Mag 20: 33-42. [Crossref]
- Pagani M, Lombardi F, Guzzetti S, Rimoldi O, Furlan R, et al. (1986) Power spectral analysis of heart rate and arterial pressure variabilities as a marker of sympatho-vagal interaction in man and conscious dog. Circ Res 59: 178-193. [Crossref]
- Pastore E, Marino B, Calzolari A, Digilio MC, Giannotti A, et al. (2000) Clinical and cardiorespiratory assessment in children with Down syndrome without congenital heart disease. Arch Pediatr Adolesc Med 154: 408-410. [Crossref]
- Guerra M, Llorens N, Fernhall B (2003) Chronotropic incompetence in persons with down syndrome. Arch Phys Med Rehabil 84: 1604-1608. [Crossref]
- Heffernan KS, Baynard T, Goulopoulou S, Giannopoulou I, Collier SR, et al. (2005) Baroreflex sensitivity during static exercise in individuals with Down Syndrome. Med Sci Sports Exerc 37: 2026-2031. [Crossref]
- Iellamo F, Pizzinelli P, Massaro M, Raimondi G, Peruzzi G, et al. (1999) Muscle metaboreflex contribution to sinus node regulation during static exercise: insights from spectral analysis of heart rate variability. Circulation 100: 27-32. [Crossref]
- Ogoh S, Wasmund WL, Keller DM, O-Yurvati A, Gallagher KM, et al. (2002) Role of central command in carotid baroreflex resetting in humans during static exercise. J Physiol 543: 349-364. [Crossref]
- Ducla-Soares JL, Santos-Bento M, Laranjo S, Andrade A, Ducla-Soares E, et al. (2007) Wavelet analysis of autonomic outflow of normal subjects on head-up tilt, cold pressor test, Valsalva manoeuvre and deep breathing. Exp Physiol 92: 677-686. [Crossref]
- Cevese A, Gulli G, Polati E, Gottin L, Grasso R (2001) Baroreflex and oscillation of heart period at 0.1 Hz studied by alpha-blockade and cross-spectral analysis in healthy humans. J Physiol 531: 235-244. [Crossref]
- Murdoch JC, Ratcliffe WA, McLarty DG, Rodger JC, Ratcliffe JG (1977) Thyroid function in adults with Down's syndrome. J Clin Endocrinol Metab 44: 453-458. [Crossref]
- Rowell LB (1984) Reflex control of regional circulations in humans. J Auton Nerv Syst 11: 101-114. [Crossref]
- Agiovlasitis S, Baynard T, Pitetti KH, Fernhall B (2011) Heart rate complexity in response to upright tilt in persons with Down syndrome. Res Dev Disabil 32: 2102-2107. [Crossref]
- Benditt DG, Ferguson DW, Grubb BP, Kapoor WN, Kugler J, et al. (1996) Tilt table testing for assessing syncope. American College of Cardiology. J Am Coll Cardiol 28: 263-275. [Crossref]
- Boneva RS, Decker MJ, Maloney EM, Lin JM, Jones JF, et al. (2007) Higher heart rate and reduced heart rate variability persist during sleep in chronic fatigue syndrome: a population-based study. Auton Neurosci 137: 94-101. [Crossref]
- Bunsawat K, Goulopoulou S, Collier SR, Figueroa A, Pitetti KH, et al. (2015) Normal Heart Rate with Tilt, Yet Autonomic Dysfunction in Persons with Down Syndrome. Med Sci Sports Exerc 47: 250-256. [Crossref]
- Iellamo F, Galante A, Legramante JM, Lippi ME, Condoluci C, et al. (2005) Altered autonomic cardiac regulation in individuals with Down syndrome. Am J Physiol Heart Circ Physiol 289: H2387-2391.
- Figueroa E1, Gordon LE, Feldhoff PW, Lassiter HA (2005) The administration of cobra venom factor reduces post-ischemic cerebral injury in adult and neonatal rats. Neurosci Lett 380: 48-53. [Crossref]
- Agiovlasitis S, Collier SR, Baynard T, Echols GH, Goulopoulou S, et al. (2010) Autonomic response to upright tilt in people with and without Down syndrome. Res Dev Disabil 31: 857-863. [Crossref]
- Souza Neto EP, Neidecker J, Lehot JJ (2003) [To understand blood pressure and heart rate variability]. Ann Fr Anesth Reanim 22: 425-452. [Crossref]
- El-Sayed H, Hainsworth R (1995) Relationship between plasma volume, carotid baroreceptor sensitivity and orthostatic tolerance. Clin Sci (Lond) 88: 463-470. [Crossref]
- Bahjaoui-Bouhaddi M, Henriet MT, Cappelle S, Dumoulin G, Regnard J (1998) Active standing and passive tilting similarly reduce the slope of spontaneous baroreflex in healthy subjects. Physiol Res 47: 227-235. [Crossref]
- Cooke WH, Hoag JB, Crossman AA, Kuusela TA, Tahvanainen KU, et al. (1999) Human responses to upright tilt: a window on central autonomic integration. J Physiol 517: 617-628. [Crossref]
- Shoemaker JK, O'Leary DD, Hughson RL (2001) PET(CO(2)) inversely affects MSNA response to orthostatic stress. Am J Physiol Heart Circ Physiol 281: H1040-1046. [Crossref]
- Rickards CA, Newman DG (2003) A comparative assessment of two techniques for investigating initial cardiovascular reflexes under acute orthostatic stress. Eur J Appl Physiol 90: 449-457. [Crossref]
- Ewing DJ, Campbell IW, Clarke BF (1980) Assessment of cardiovascular effects in diabetic autonomic neuropathy and prognostic implications. Ann Intern Med 92: 308-311. [Crossref]