Abstract
HIV/AIDS is one of the worst pandemics, the world has ever known, and the entire world has been combating with it. Objective: To analyze the global and national trend of HIV/AIDS regarding the indices PLHIV, New infections and AIDS-related death and coverage of ART. Methodology: This is a quantitative research completely based on the secondary data. The data is analyzed by simple statistical representations. Regression analysis is used to analyze the trends and to make some predictions. Results: The number of PLHIV is increased by 19.93% from 1997 to 2015 and by 69.56% from 2000 to 2015% in Nepal. In this same duration, the new HIV infection is reduced by 63.79% and 82.62%, AIDS related death by 52.17% and 411.11% respectively in the Globe and Nepal. The initial coverage of ART in both regions was negligible and by the end of 2015 it reached to 46.37% and 30.57% in the Globe and Nepal respectively. Conclusion: Nepal along with the globe achieves some positive results in the combating of this health problem. By analyzing the trends, it is not worth to say that we are not far from the achievement of SDGs.
Key words
global, national, trend, HIV/AIDS
Introduction
In 1981, a new syndrome, the acquired immune deficiency syndrome (AIDS) was first recognized among homosexual men in the United States. By 1983, the etiological agent, the human immunodeficiency virus (HIV), had been identified. By the mid-1980’s, it became clear that the virus had spread, largely unnoticed, throughout most of the world [1]. At the end of 1999, 5.4 million peoples were newly infected, among them 4.7 million were adults, 2.3 million were women and 620,000 were Children <15 years. In a very short period of its identification, HIV/AIDS infection had spread rapidly in many countries over the years and became a global health challenge.
UNAIDS, launched in 1996 to strengthen the way in which the United Nations (UN) was responding to AIDS, one of the worst pandemics the world has ever known. The UN, in 2000 declared “The Millennium Development Goals” having eight goals for next fifteen years, in which the HIV/ADIS was also included in Goal 6 as “Combat HIV/AIDS, malaria and other diseases”. The final assessment of progress toward achieving the MDGs shows that (1) New HIV infections fell by approximately 40 percent between 2000 and 2013, from an estimated 3.5 million cases to 2.1 million, (2) By June 2014, 13.6 million people living with HIV were receiving antiretroviral therapy (ART) globally, an immense increase from just 800,000 in 2003. ART prevented 7.6 million deaths from AIDS between 1995 and 2013 [2].
In September 2015, the United Nations General Assembly adopted the new development agenda: “Transforming our world: the 2030 agenda for sustainable development”, comprising 17 Sustainable Development Goals (SDGs) with 169 associated targets. Sustainable Development Goals (SDGs), the 2030 Agenda integrates all three dimensions of sustainable development (economic, social and environmental) around the themes of people, planet, prosperity, peace and partnership. Health is centrally positioned within the SDGs, with one comprehensive goal (SDG 3) and its 13 targets covering all major health priorities and links to targets in many of the other goals. In the Target 3.3, the SDGs aims “By 2030, end the epidemics of AIDS, tuberculosis, malaria and neglected tropical diseases and combat hepatitis, water-borne diseases and other communicable diseases” [3].
The first case of AIDS in Nepal was reported in 1988, and in soon, it became epidemic and raised as a challenging national health problem. Despite the challenges involved in scaling up and sustaining HIV programs at a high level, Nepal has made progress in several areas. The NCASC is the main government agency responsible for implementing prevention programs and providing technical guidance in the HIV and AIDS response. Many new initiatives have been undertaken since the development of the first AIDS policy. In 1995, a national HIV/AIDS policy was endorsed, with 12 key policy statements and supportive structures including the National AIDS Coordination Committee and the District AIDS Coordination Committee, to guide and coordinate the response at the central and district levels. In 2002, the National AIDS Council (NAC), chaired by the prime minister, was established to raise the profile of HIV/AIDS in the country. The NAC was intended to set overall policy, lead high-level advocacy, and provide overall guidance and direction to the national HIV/AIDS program [4].
The first five-year national HIV/AIDS strategy, developed in 2002, focused on prevention, care and support for the most-at-risk populations. The second national HIV and AIDS strategy (2006-2011) has focused on lowering the prevalence of HIV among these populations, reducing the vulnerability of young people, and providing quality treatment and care to infected as well as affected people [4].
The second national policy on HIV and sexually transmitted infections (STIs) was developed in 2011 with the vision of reducing the HIV infection rate and establishing an HIV and AIDS- and STI-free society. Based on this policy, the third HIV/AIDS strategy plan (2011-2016) developed in 2011 with the following objectives,
- 1. Reduce new HIV infections by 50% by 2016, compared to 2010;
- 2. Reduce HIV‐related deaths by 25% by 2016 (compared with a 2010 baseline) through universal access on treatment and care services; and
- 3. Reduce new HIV infections in children by 90% by 2016 (compared with a 2010 baseline) [5].
To meet the global and national goals, it is necessary to analyze its trends of different aspects. In this article, I will try to analyze the global and national trends of HIV/AIDS in its different dimensions.
Methodology
This is a quantitative research completely based on the secondary data. The data are collected from the electronic version of the global and national reports of HIV/AIDS. The data are analyzed by simple statistical representations (Bar diagram, Frequency Polygon etc.). The regression analysis is done to analyze the trend and to make some predictions.
Result and data analysis
Global Trend of HIV/AIDS
Even the first case of HIV/AIDS was observed in early on 1980’s, but became epidemic very soon in the middle of the 1980’s. Even though it was spread very soon in all over the world, but particularly mostly appeared in Sub-Saharan Africa region and this trend still remain till the date. By 1996, some 15 years since a few cases of the new condition were first reported in a scientific publication, over four million people had died from AIDS, several million were living with HIV and the future predictions were dire. The following Table 1 summarizes the number of people living with HIV/AIDS, New HIV infections, AIDS-related deaths in millions from 1997 to 2015 (Sources: AIDS epidemic update- 1998, 2000, 2002, 2003, 2006, 2007, and 2009 (UNAIDS & WHO); Global Fact Sheet: HIV/AIDS- 2014, 2015 (UNAIDS); UNAIDS Report on the global AIDS epidemic 2012, UNAIDS, World AIDS Day Report -2011, GLOBAL AIDS UP DATE-2016 [6-11]).
Table 1. Number of PLHIV, new infections & AIDS related deaths in world
Year |
People Living with HIV |
New HIV infections |
AIDS-related deaths |
Year |
People Living with HIV |
New HIV infections |
AIDS-related deaths |
1997 |
30.6 |
5.8 |
2.3 |
2008 |
33.4 |
2.7 |
2.0 |
1999 |
34.3 |
5.4 |
2.8 |
2010 |
34.0 |
2.7 |
1.8 |
2002 |
42.0 |
5.0 |
3.1 |
2011 |
34.0 |
2.5 |
1.7 |
2003 |
40.0 |
5.0 |
3.0 |
2013 |
35.3 |
2.3 |
1.5 |
2006 |
39.5 |
4.3 |
2.9 |
2014 |
36.9 |
2.0 |
1.2 |
2007 |
33.2 |
2.5 |
2.1 |
2015 |
36.7 |
2.1 |
1.1 |
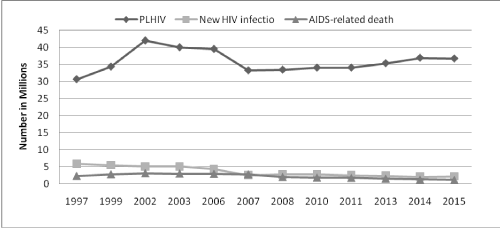
The Table 1 shows that the number of people living with HIV is increased by 19.93% from 1997 to 2015, but this number is highest (42 millions) in 2002 from when it starts to decrease and up to 2015 by 12.62%. The New HIV infection is almost gradually decreasing, and from 1997 to 2015 it is reduced by 63.79%. However, from 2006 to 2007 it is sharply decreased by 41.86%. As like the New HIV infections, The AIDS related death is however increased from 1997 to 2003, is again gradually decreasing. From 1997 to 2015 it is lowered by 52.17%.
The trend of these components is diagrammatically shown in the following figure (Figure 1).

Figure 1. Global Trend of HIV/AIDS
National trend of HIV/AIDS
The first HIV infection in Nepal was identified in 1988. The potential for the spread of HIV in Nepal is large because of extensive use of commercial sex workers, high rates of sexually transmitted diseases, low levels of condom use, and pockets of intravenous drug users. As of October 2001, a total of 533 AIDS cases and 1,564 cases of HIV infection were reported to the Ministry of Health, National Center for AIDS and STD Control [12]. However, these figures are probably grossly underestimated given the current medical and public health infrastructure and limited HIV/AIDS surveillance system in Nepal [13].
The following Table 2 summarizes the numbers related to the HIV/AIDS from 2000 to 2015. The following data differ than the data by NCASC.
Table 2. Number of PLHIV, new infections & AIDS related deaths in Nepal
Year |
People Living With HIV |
New HIV infections |
AIDS-related deaths |
Year |
People Living With HIV |
New HIV infections |
AIDS-related deaths |
2000 |
23000 |
7500 |
450 |
2008 |
47000 |
3300 |
2500 |
2001 |
29000 |
7400 |
900 |
2009 |
47000 |
2700 |
2400 |
2002 |
35000 |
7300 |
900 |
2010 |
46000 |
2300 |
2600 |
2003 |
40000 |
7200 |
1200 |
2011 |
45000 |
2200 |
2700 |
2004 |
44000 |
6600 |
1500 |
2012 |
43000 |
1800 |
2600 |
2005 |
47000 |
5400 |
1900 |
2013 |
42000 |
1600 |
2500 |
2006 |
47000 |
4100 |
2200 |
2014 |
41000 |
1400 |
2400 |
2007 |
48000 |
3900 |
2400 |
2015 |
39000 |
1300 |
2300 |
Source: www.aidsdatahub.org based on UNAIDS [14].
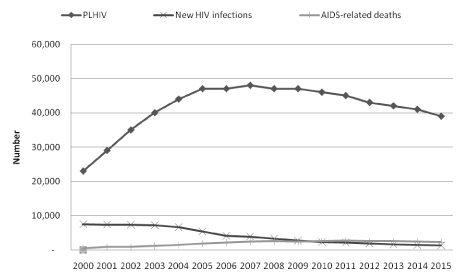
The above table discloses that the number of people living with HIV is gradually increased from 2000 to 2007; in 2007 it reached to its peak value (48000) and then started to decline. By the end of the 2015, regarding the number in 2000, it is increased by 69.56%. But by regarding its peak value 48000 in 2007, it is reduced by 18.75%. The number of new HIV infections has been gradually decreasing since 2000, and by the end of 2015, it is reduced by 82.67%, which is a significant quantity. However, the AIDS related death is sharply increased in the initial years of 2000 and reached to its peak value by the year of 2011 and then starting to decrease. If we regarded the number of AIDS related death of 2000, as a base line, this number is increased by 411.11% shows a dramatically figure. However, it might be natural in the sense that the initial figure is very low and may be under estimated by the lack of reporting institutions.
The trend of these components is diagrammatically shown in the following graph (Figure 2).

Figure 2. National Trend of HIV/AIDS
Coverage of anti-retroviral
HIV is treated using a combination of medicines to fight HIV infection. This is called antiretroviral therapy (ART). ART isn’t a cure, but it can control the virus so that you can live a longer, healthier life and reduce the risk of transmitting HIV to others. ART involves taking a combination of HIV medicines (called an HIV regimen) every day, exactly as prescribed.
These HIV medicines prevent HIV from multiplying (making copies of itself), which reduces the amount of HIV in your body. Having less HIV in the infected body gives body immune system a chance to recover and fight off infections and cancers. Even though there is still some HIV in the body, the immune system is strong enough to fight off infections and cancers. ART is recommended for all people with HIV, regardless of how long they’ve had the virus or how healthy they are. If left untreated, HIV will attack the immune system and eventually progress to AIDS. In 1986, antiretroviral therapy was initially introduced in world with the first drug Zidovudine (ZDV). In June 1995, the FDA approved the first protease inhibitor beginning a new era of highly active antiretroviral treatment (HAART). Once incorporated into clinical practice HAART brought about an immediate decline of between 60% and 80% in rates of AIDS-related deaths and hospitalization in those countries which could afford it [15].
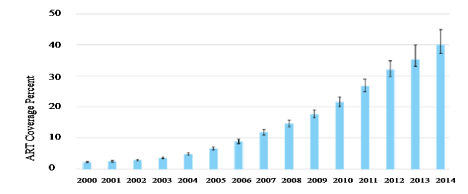
The coverage of ART in global is shown in the following bar diagram (Figure 3).

Figure 3. Global Coverage of ART
The graph shows that the initial coverage of the ART among the PLHIV is negligible and continuously increasing and in the end of the 2014 the coverage is 40% this figure reach to 46.37% in 2015. The ART coverage in Asia Pacific region is 40.7481% UNAIDS (2016).
The first ART centers of Nepal were only established on 2004 in Sukraraj Tropical and Infectious disease control hospital Teku and Veri Zone hospital Nepalgung. By the end of 2016, there are 65 ART centers [16].
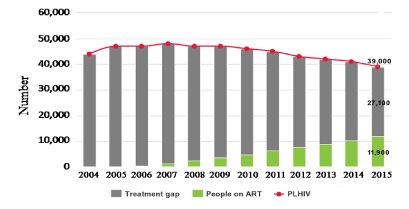
The following bar diagram shows the coverage and the gap of ART to PLHIV (Figure 4-Source: http://www.aidsdatahub.org).

Figure 4. Coverage of ART in Nepal
Regarding to the global and Asia Pacific coverage of ART, in Nepal ART was lately indorsed, and at the begging, very few PLHIV got it. At the end of the 2015, 30.51% PLHIV have access in ART, is lower by 15.86% than the global coverage and 10.24% than the Asia Pacific region.
The above diagram shows that there is still a very large gap of ART coverage to the PLHIV in Nepal.
Discussion
From the beginning, HIV/AIDS badly affect the human sound life and hence the society’s prosperity. Not only a single country or region but the entire world has been facing the challenge of this epidemic, however may have in different scale. In the beginning it appeared or identified in the developed country, but very soon it badly distressed especially the Sub-Saharan Africa region and more or less to all the world. The Asia pacific region and hence Nepal also have been facing this threaten of this epidemic. Hence, it is a common global challenge in the health.
This study shows that the number of PLHIV increased sharply in its begging up to the new millennium, and then declined around first decade (2003-2007) and finally starts to increase very slightly. The raising of its epidemicity in the beginning is due to its incurability and dilemma of worlds towards this new disease. Due to its globalization, the UN along with other stakeholders took the global action to reduce its effects. The global action especially focused on the awareness of its transmission and way to be secure from this epidemic which might be reduced the number of PLHIV. By the introducing of ART, the life span of the PLHIV can be expanded, which may be the cause of slightly increasing of PLHIV. But, this trend should be reversed in the future to meet the goal of SDGs.
The number of new infections of HIV has been declining almost continuously since 1997, except 2008 in which it was slightly increased than 2007. The rate of declination before 2007 is more than after 2007. The declination shows the linear pattern except in between 2006 and 2007 where it was sharply decreased approximately by 45% only in a single year shows the ambiguity in pattern. By discarding this ambiguity, we get the almost linear pattern of declination and if we fit the line of regression of number of new infections on the year, we get X= 2021.80-4.067Y, where X= Year and Y= No. of new infection. With the help of this line of regression, we can predict that at the end of 2021, if this global pattern remains same, there will be no new infection. But this may be early to real achievement, because the rate of declination beyond the 2007 is lower than earlier. If we only consider the pattern beyond the 2007, and again fit the line of regression, we get X=2033.05-9.1304Y, where X and Y are same as above. With the help of this line of regression, we can predict that at the end of 2033, if this global pattern beyond the 2007 remains same, there will be no new infection. So, by these estimations, it is not worth to say that we are not far from the achievement of SDGs “end of epidemicity of HIV/ADIS by the end of 2030”.
The number of deaths by AIDS shows somewhat similar pattern with new infections. It is continuously increased up to 2002 and starts to gradually decrease but the rate of declination seems large. The number of death beyond the 2006 is significantly decreasing, may be due to coverage of ART which gradually increase after its use and reach 46% among PLHIV at the end of 2015.
The trend of HIV/AIDS in Nepal is similar in some senses and also differs in some aspects. As we see that the curve of the PLHIV is gradually increased up to 2007 and starts to decrease till now. This continuous declination of PLHIV seems natural as the continuous declination of the number of new infections. But it also reveals the fact that we cannot extend the life of PLHIV. This is reasonable with the fact that our coverage of ART up to end of 2015 is only 30.52%. At this same duration beyond the 2007, the global graph of PLHIV is gradually increasing shows our reverse trend than the globe. The trend of the new infection shows some similarity with global trend i.e. it has been gradually decreasing since 2000. In period of 15 years from 2000, it is lowered by 82.67% where as in the same period the global index is approximately 61.11%. So, we can achieve the better result in this index than the world. The national graph of AIDS related death shows the increasing tendency around the 2011 and beyond then it shows the decreasing tendency, but the global graph has started to show the decreasing tendency from 2003. We only established the ART centers at 2004 from only two places which only could cover insignificant numbers of PLHIV that’s may be why we could reduce the AIDS related death only from 2011 too late than the globe.
Conclusion
Globalization affects all facets of human life, including health and wellbeing. The HIV/AIDS epidemic has highlighted the global nature of human health and welfare and globalization has given rise to a trend toward finding common solutions to global health challenges. Nepal along with the globe has been facing the horrific challenge of HIV/AIDS epidemic initially, but also with the globe, achieving some positive results in the combating of this health problem. We are still beyond the global achievement on some indices but get better achievement in the AIDS related death index. But along with the globe, we have to continue our effort to meet the global goal. This study only focused on the four holistic indices i.e. PLHIV, New Infections, AIDS-related death and coverage of ART, but due to unavailability of the resources, it cannot go to the different components of these indices. So, in future, study can be done in these areas.
2021 Copyright OAT. All rights reserv
References
- UNAIDS and WHO (2003) AIDS Epidemic Update December 2003.
- United Nation (2014) The Millennium Development Goals Report 2014. United Nations New York.
- World Health Organization (2016) World Health Statistics 2016: Monitoring health for the SDGs.
- Ministry of Health and Population (MOHP) Nepal. UNA. Annual report: Department of Health Services 2066/67 (2009/2010) Kathmandu, Nepal: Ministry of Health and Population.
- National Centre for AIDS and STD Control NCASC (2011) National HIV/AIDS Strategy 2011‐2016. Ministry of Health and Population National Centre for AIDS and STD Control, Teku Kathmandu.
- UNAIDS and WHO (1998) AIDS Epidemic Update: December 1998.
- UNAIDS & WHO (2009) AIDS epidemic update: November 2009.
- UNAIDS (2014) Global Fact Sheet: HIV/AIDS- 2014.
- UNAIDS (2014) Global Fact Sheet 2014: HIV/AIDS- 2015.
- Joint United Nations Programme on HIV/AIDS (UNAIDS) (2012) UNAIDS Report on the global AIDS epidemic-2016.
- UNAIDS (2016) GLOBAL AIDS UP DATE-2016.
- National Center for AIDS and STD Control NCASC (2001) Cumulative HIV/AIDS situation in Nepal. Kathmandu, Nepal: National Center for AIDS and STD Control.
- Ministry of Health and Population (MOHP) Nepal, New ERA, and Macro International Inc. 2002. Nepal Demographic Health Survey 2001. Kathmandu, Nepal: Ministry of Health and Population, New ERA, and ORC Macro Calverton, Maryland USA.
- UNAIDS (2016) AIDS by the Number.
- James JS (1995) Saquinavir (Invirase): first protease inhibitor approved - reimbursement, information hotline numbers. AIDS Treat News 22: 1-2. [Crossref]
- National Center for AIDS and STD Control NCASC (2016) ART-Sites-Nepal-Nov-28-2016.


