Early indication of some diseases such as Parkinson and Multiple Sclerosis often manifests with walking difficulties. Gait analysis provides vital information for assessing the walking patterns during the locomotion, especially when the outcomes are quantitative measures. This paper explores methods that can respond to the changes in the gait features during the swing stage using Kinect Camera, a low cost, marker-free, and portable device offered by Microsoft. Kinect has been exploited for tracking the skeletal positional data of body joints to assess and evaluate the gait performance. Linear kinematic gait features are extracted to discriminate between walking speeds by using five supervised modulation based machine-learning classifiers as follow: Decision Trees (DT), linear/nonlinear Support Vector Machines (SVMs), subspace discriminant and k-Nearest Neighbour (k-NN). The roles of modulation techniques such as Frequency Modulation (FM) for increasing the efficiency of classifiers have been explored. The experimental results show that all five classifiers can successfully distinguish gait futures signal associated with walking patterns with high accuracy (average expected value of 86.19% with maximum of 92.9%). This validates the capability of the presented methodology in detecting key “indicators” of health events.
gait analysis, kinematic gait features, amplitude and frequency modulations, baseband signal, passband mapping, machine-learning, classification technique
Clinically, human gait analysis is an important way to assess and evaluate neurological disorders such as Multiple-Sclerosis (MS). The timed walk tests (T-25FW, and TUG) and standard scales (EDSS, and 12-MSWS) are used clinically for gait assessment and evaluation by clinicians who depend on ob
servation and patients’ report [1]. Due to the high cost and immobility nature of motion capture systems, researchers started to work recently on Microsoft Kinect which is an off-the-shelve, low-cost camera for gait analysis. Extracting quantitative data is valuable in understanding the changes of the gait pattern for kinematic gait features [2].
The spatial and temporal components of gait movement are described in the field of biomechanics as kinematic features [3]. The kinematic features include the position, velocity, and acceleration of body’s joints during walking. A kinematic gait analysis of motion is either angular or linear kinematic. Angular kinematic gait analysis is based on angular data of body’s joints, whilst the skeletal positional data of body’s joints is exploited in linear kinematic analysis [4]. This study explores linear kinematic gait analysis based on skeletal positional data of lower body’s joints (hips, knees, and ankles) using Microsoft Kinect v2 camera. The quantitative data is collected from the participants who walked in front of the Kinect camera at three different walking speeds (slow, normal, and fast walks). Using the MS Kinect to collect data is important in order to make kinematics description more precise rather than relying on clinicians’ observation. Based on the quantitative data, effective comparison between various techniques can be derived mathematically. The proposed techniques have been analysed over several classifiers, i.e., Decision Tree (DT), linear/nonlinear Support Vector Machines (SVMs), k-Nearest Neighbour (K-NN), and subspace discriminant, which are used to classify the gait speeds using both unmodulated and modulated signals. The former is called unmodulated velocity signal analysis, whilst the latter refer to modulated velocity signal using one of the proposed modulation techniques such as Frequency Modulation (FM).
The rest of this paper is structured as follows. Sec. II reviews the related work on kinematic gait analysis and gait features extraction, Sec. III covers the proposed method for gait features extraction during legs swing phase. The experimental setup and results are presented in Sec. IV and we conclude in Sec. V.
Gait cycle determination
The gait cycle involves two main stages, stance stage which occupies 60% and swing stage 40% of all gait period [5]. In more detail, gait cycle can be divided into eight sub phases; initial contact, loading response, mid stance, terminal stance, pre-swing, initial swing, mid swing and terminal swing. Figure 1 illustrates the gait cycle of the same leg during a gait cycle of a healthy subject (Figure 1).
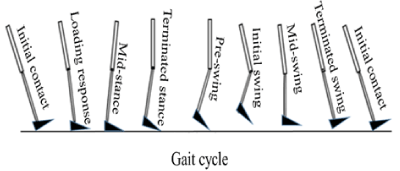
Figure 1. Full gait cycle limited between two strike heels of the same leg.
In [6], the gait cycle from the horizontal distance between the left and right legs is detected during forwards walking to the MS Kinect. The author shows exactly that the maximum distances between both legs which corresponds to state of legs when are farthest apart, while minimum horizontal distance between legs when are closed to each other. Another study uses a similar technique to calculate the full gait cycle. While in [7] Euclidean distance equation has been employed for calculating the distances between skeleton joints in 3D. The authors extract the three consecutive local minima to ensure the gait cycle period is identified. Moreover, a study used a different technique that started with data segmentation of human cyclic movement based on spectral signal analysis and detection technique of zero-velocity crossing [8].
Kinematic gait features
Clinically, human motion analysis has been conducted for supporting the gait movement disorder assessment. In [9], the kinematic gait parameters are used for distinguishing between healthy and unhealthy subjects with Parkinson’s disease (PD). The authors use Kinect v1 and Kinect v2 for collecting data, where the results show that 73%, and 96% accuracy, respectively of the considered parameters are appropriate for distinguishing between non-PD subjects and PD patients.
Classification technique
Data classification techniques have been used in different aspects of human gait sciences including gait classification, representation and recognition using MS Kinect. In the classification stage, researchers use various classifiers. The Back Propagation Neural Network (NBNN) is used in [10] for classifying the human activities using skeleton data from MS Kinect. In [11] three types of classifiers was employed for gait attributes using MS Kinect, where the authors achieved the highest system accuracy with Support Vector Machine (SVM), followed by k-Nearest-Neighbor (k-NN), and then the MLP classifier. In [12] the 3D skeleton model from MS Kinect video was extracted for classifying gender of the gait, with results showing 83.75% and 76.25% accuracy by using SVM, and Nave Bayes, respectively.
Participants material
In this study, fourteen heathy control subjects (age: 36.9 ±4. 5 years, height: 173.97 ±10.5 cm, mass: 75.07 ±11.2 kg, female 1⁄7 of 14) volunteered to participate. They were required to avoid loose and reflective clothes during the trials.
The participants were instructed to perform three types of walk speed (slow, normal, and fast walks) towards the camera; they repeated each trial three times to increase the data accuracy. The line-walk of 3.5m was made in front of the Kinect camera. This distance ensures that the skeletal captured camera’s area records at least one complete stride gait for each leg.
MS Kinect v2.0 is used for collecting skeletal positional data of lower body’s joints (hips, knees, and ankles) in 3D coordinates at 30 frames per second. Data acquisition is supported by the developed application, written in MS Visual studio 2015 C++ using the Kinect SDK v2 to provide three-dimensional skeletal data for 25 joint positions over time of trial. A Savitzky–Golay filter is used for smoothing the skeletal data with the window size/length set to 11. Kinematic data is normalized for plotting on time percentage (i.e. 0–100%), and averaged to consider the mean value for each walk speed trial.
Linear kinematic gait features
The linear kinematic information of the lower body’s joints motion in the horizontal direction is calculated by dividing the changes of position (final position minus initial position, i.e.: Pf — Pi ) by the changes of time (final time minus initial time i.e.: ) to calculate linear velocity, while the linear acceleration is calculated by dividing the changes of velocity to the changes of time for hips, knees, and ankles, as can be seen in Eq. (1) and Eq. (2).

where, υx and αx are the velocity and acceleration of joint in horizontal direction during a leg swing on the forward movement. Figure 2, illustrates the displacement, velocity and acceleration of ankle joint during the legs swing stage.
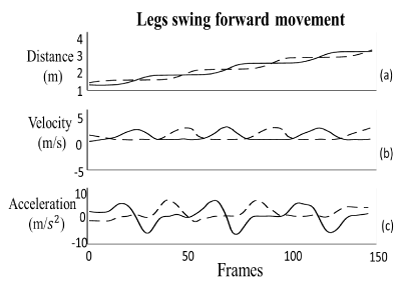
Figure 2. The legs swing forward movement, right ankle in dashed line and left ankle in solid line (a) the displacement of left/right ankles (b) the velocity of left/right ankles (c) acceleration of ankles.
The maximum values of velocity, acceleration range, and leg in ground contact time during acceleration phase, these features are calculated for right and left ankles for classification according to the kind of walk speed.
Next for increasing classification vitality, modulation techniques are introduce.
Modulated leg velocity using Frequency Modulation(FM)
The modulated frequency signal FM (t) can be synthesised by application of the reference signal Xr(t) on the leg velocity signal  , as shown in Figure 3. In this technique, the frequency of reference signal is changing according to the variations of the amplitude of the leg velocity signal. Figure 3 illustrates the frequency states of reference signal before and after the modulation process. This mathematically can be expressed as follow:
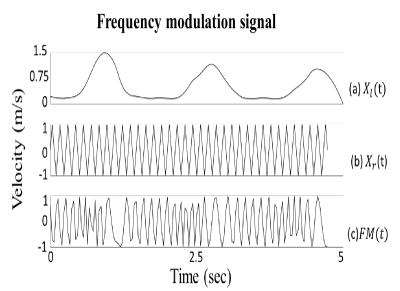
Figure 3. The generation of frequency modulation signal (a) signal of leg velocity (b) the reference signal before the modulation process (c) the reference signal after the modulation process which called frequency modulation signal.
where, B is modulation index, Xl(t) is the leg velocity signal, Ar, Wr are the amplitude, and angular frequency of reference signal, respectively.

The modulated frequency signal can be represented in time domain to extract the frequency deviation (Δ f ) which is the mount of the frequency that deviates from the reference frequency (fr ) see Eq. (4).

Where, f is the frequency of reference signal after the modulation process, fr is the reference frequency before the modulation process which is chosen to be 7.5 Hz. The bandwidth (BW) of signal can be calculated from Eq. (5). The spectrum of can explain the number of the spectral components which are located within the (BW), see figure 4.
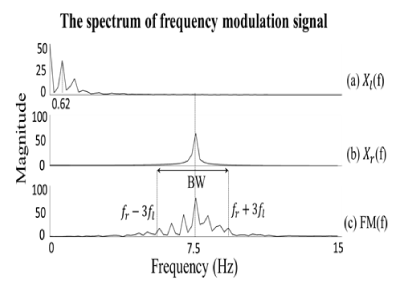
Figure 4. The generation of frequency modulation signal (a) signal of leg velocity (b) the reference signal before the modulation process (c) the reference signal after the modulation process which called amplitude modulation signal.
where, n is the order number of the spectral location.

Modulated leg velocity using Amplitude Modulation(AM)
The modulated amplitude signal A M (t) can be obtained by multiplication of the reference signal Xr (t) by the leg velocity signal Xl (t), see Eq. (6). In this technique, the amplitude of reference signal is changing according to the variations of the amplitude of the leg velocity signal. Figure 5 illustrates the amplitude states of reference signal before and after the modulation process.
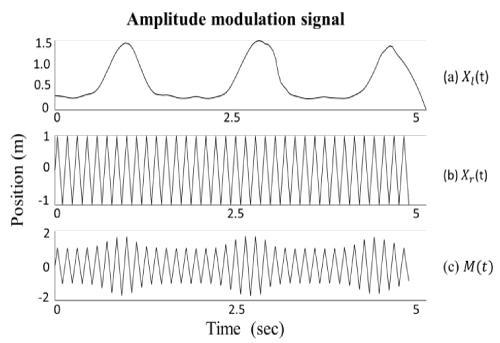
Figure 5. The generation of amplitude modulation signal (a) signal of leg velocity (b) the reference signal before the modulation process (c) the reference signal after the modulation process which called amplitude modulation signal.

where, D is the modulation index, Xr(t) is the leg velocity signal, and , Ar Wrare amplitude, angular frequency of reference signal, respectively.
The modulated amplitude signal can be represented in time domain to extract the modulation index (D) by using the ratio of the amplitude of leg velocity signal to the amplitude of reference signal see Eq. (7), and Eq. (8).

where, the Maxp-p is the maximum of amplitude peak to peak value on the amplitude modulation signal, while Minp-p is the minimum of amplitude peak to peak value, for more details, the [13] derive these equations on time and frequency domains. The bandwidth (BW) of the modulated signal AM (t)can be extracted from the spectrum of modulated signal. Figure 6 illustrates the representation of the modulated signal in frequency domain.
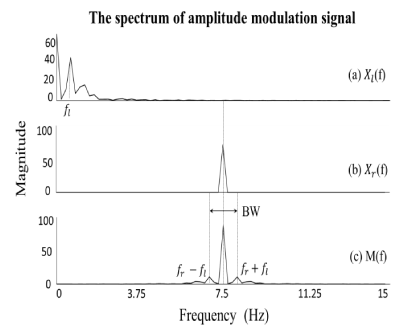
Figure 6. The spectrum generation of amplitude modulation signal (a) the spectral of the leg velocity signal (b) the spectral of reference signal (c) three spectral components on the amplitude modulation signal.
Data Collection and preprocessing
Our testing system is implemented in MATLAB for 14 subjects who are instructed to walk on the front the Kinect. Each subject performed three types of walk speeds (slow, normal and fast walk). Datasets including a collection of 3D skeleton joints position data, specifically for ankle joint velocity on the leg swing stage, which obtained using Eq 1. As this signal shows noisy nature (Figure 7a), the Robust LOESS (LOcally regrESSion) filter [14] has been used for smoothing the leg sewing velocity data. The outcome of this filter is shown in Figure 7b.
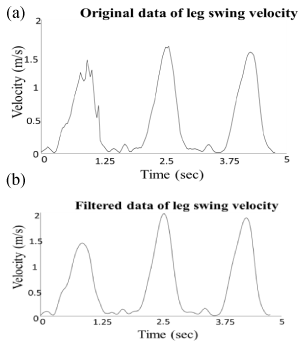
Figure 7. The leg swing velocity signal (a) original data (b) filtered data.
Features extraction
A complete and consistent gait analysis commonly requires the cycle gait determination, which can be divided into two phases; the stance and swing phases. Two different methods are used for extracting the kinematic gait features in which both methods have been based on the lower limbs displacement data (positional data) to determine the gait speed in three different kinds. In the first method the kinematic gait analysis based on the gait displacement, velocity, and acceleration signals during leg swing stage, without any modulation have been explored, while in the second method, the modified leg velocity signal has been modulated using FM technique.
The first method is used for extracting four gait features; the maximum velocity of the right leg, maximum velocity of left leg, and the time of the contact to the ground on the acceleration phase for both left and right legs. These features are extracted for all subjects in three different kinds of walk speeds during leg swing stage.
The second method is used for extracting two gait features by modifying the leg swing velocity signal using the FM technique. The modified leg velocity signal is represented in time domain to extract the frequency deviation (±∆f), which yields two new frequencies that differ from original frequency of the reference signal (fr ) to produce new frequencies, i.e.:

which are related to the periods of up and down direction of velocity slop, respectively. The frequency spectrum can be used to represent all spectral components that are produced by the FM, and then the bandwidth (BW ) of FM (t) signal is calculated according to the number of spectral components see Eq 5. These features have been extracted for all subjects on three types of walk speeds, as can be seen in figures 8-10.
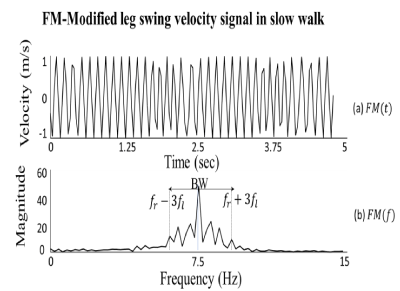
Figure 8. Modified slow walk signal (a) Time domain. (b) Frequency domain.
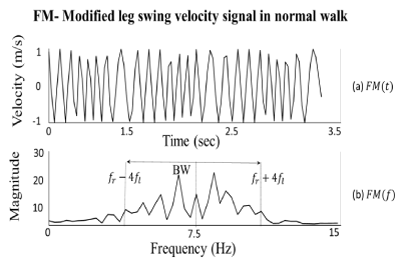
Figure 9. Modified normal walk signal (a) Time domain. (b) Frequency domain.
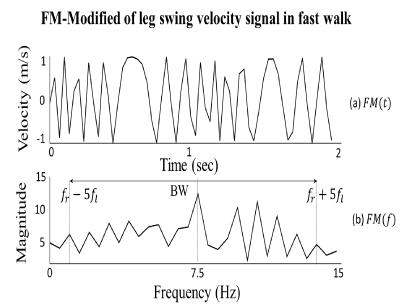
Figure 10. Modified fast walk signal (a) Time domain. (b) Frequency domain.
In this test, the extracted gait features have been categorized into three groups relating to the method that is used for extracting the kinematic gait features; the first data were extracted from leg swing signal using kinematic gait analysis method without any modulation. While, the data of the second and third categories are extracted from the modulated leg velocity signal using frequency modulation technique.
The classification process is used for all extracted data by using several classifiers, i.e., DT, linear VSM, non-linear VSM, k-NN, and discriminate subspace to investigate the high predicted power of features.
The task of these five classifiers are to predict data in three classes which related to three kinds of walk speeds, as can be seen in Tables 1 and 2, for unmodified kinematic leg analysis, and modified leg velocity signal using FM method. In these tables the ROC (Receiver Operating Characteristics) curve and confusion matrix are calculated for each class to obtain and evaluate the performance of the machine-learning based classifiers.
Table 1. Five kinds of classifiers result for kinematic gait analysis in three kinds of walk speeds, the roc curve and confusion matrix are calculated for each class, where the error is related to the true positive rate
Classifiers |
ROC curve
Confusion matrix Error (%) |
Accuracy (%) |
C1 |
C2 |
C3 |
|
Decision Tree (DT) |
0.9311
7.1 |
0.9107
7.1 |
0.9642
7.1 |
92.9 |
Linear SVM |
0.9221
14.3 |
0.8724
21.4 |
0.9566
7.1 |
85.7 |
Nonlinear SVM |
0.93361
14.3 |
0.8367
28.6 |
0.9311
14.3 |
81.0 |
Subspace Discriminant |
0.9617
28.6 |
0.9513
14.3 |
0.9566
7.1 |
83.3 |
k-NN |
0.92857
7.1 |
0.8928
21.4 |
0.9107
7.1 |
88.1 |
Table 2. Five kinds of classifiers results for modified leg velocity signal (fm) technique in three kinds of walk speeds, the ROC curve is and confusion matrix are calculated for each class, where the error is related the true positive rate
Classifiers |
ROC curve
Confusion matrix Error (%) |
Accuracy (%) |
C1 |
C2 |
C3 |
Decision Tree (DT) |
0.8558
14.3 |
0.8979
14.3 |
0.9107
14.3 |
85.7 |
Linear SVM |
0.9387
7.1 |
0.8954
14.3 |
0.8596
21.4 |
85.7 |
Nonlinear SVM |
0.9158
0 |
0.8035
28.6 |
0.8954
21.4 |
83.3 |
Subspace Discriminant |
0.9515
7.1 |
0.9158
14.3 |
0.9260
14.3 |
88.1 |
k-NN |
0.9285
7.1 |
0.875
14.3 |
0.9287
14.3 |
88.1 |
For the various classifiers used in this paper, accuracy, confusion matrix, and AUC (Area Under Curve) for the three classes have been shown. It is noticeable that the DT classifier achieves the highest accuracy 92.9% among the classifiers that is used for the unmodified signal of kinematic gait features. However, with the FM technique, the DT classifier accuracy reached 85.7%. While, in the FM technique, the highest classifier accuracy is recorded only 88.1% with both k-NN and subspace discriminant classifiers. In addition, the ROC curves have shown a high predictive result with class one (C1) which represents the slow walk speed: the ROC approached considerably close to 1 when subspace discriminant classifier was used for both unmodulated signal and the proposed FM technique. This indicates the ability of this classifier to sense the true positive values correctly (sensitivity), and ability to select the false negative values correctly (specificity). Moreover, the classification accuracy which is calculated from the confusion matrix showed high value with average expected value of 86.19% and maximum of 92.9% obtained by decision tree classifier. Finally, the classifier’s accuracy, confusion matrix, and AUC evaluation metric showed that a better results with high confidence band and predictive capabilities obtained by our purposed methodologies for classification of modified leg velocity signals. Further works includes extending the application of this techniques toward Kinecting cognitive impairments [15] beside using amplitude modified signals and explore the expectation that AM might offer better capability to represent the spectral components of a low frequency signal than the FM technique when it comes to dealing with MS Kinect data that has medium/low data rate of 30 frames per second.
In this paper, we study the classification of three types of gait speeds by using 3D human skeleton for lower joints' body position data captured by a Kinect v2 camera. We propose an enhanced gait features extraction which is based on positional skeletal data without requirement of gait cycle determination. The purposed techniques shows high classification accuracy compared to traditional kinematic gait features method. The high predictive power of classifier can be related to the extracted features which are based on modified gait signal parameters.
In the system evaluation, the ROC curve and confusion matrix were used to calculate the predictive power of features, thereby increasing the ratio of the correct prediction for the classifier. The subspace discriminant method shows better predictive power for both unmodulated and modulated gait data analysis while the best accuracy obtained by decision tree classifier. Finally, the experimental results showed that all five classifiers can successfully distinguish gait futures signal associated with walking patterns obtained by Kinect camera, which in turn validates the capability of the presented methodology in detecting key “indicators” of health events.
We would like to thank participants in helping us for data collection and Dr I. Caliskanelli for proof reading the early version of this article. We acknowledge MRC (MiiHome) funding for part of this project. The first author also acknowledges Libyan cultural attaché for provision of his PhD Studentship for his work.
- Behrens, J., Pfüller, C., Mansow-Model, S., Otte, K., Paul, F. and Brandt, A.U., (2014) Using perceptive computing in multiple sclerosis-the Short Maximum Speed Walk test. J Neuroeng and Rehabil 11: 89. [Crossref]
- Alcantara CC, Alonso AC, ad Speciali DS (2017) The use of the Gait Deviation Index for the evaluation Post-stroke Hemiparetic Subjects. Medical Express 4.
- Kale Moyano R (2015) Human gait characterization using Kinect.
- Knudson D (2007) Fundamentals of biomechanics. Springer Science & Business Media.
- Lohman EB, Sackiriyas, KSB, Swen RW (2011) A comparison of the spatiotemporal parameters, kinematics, and biomechanics between shod, unshod, and minimally supported running as compared to walking. Phys Ther Sport 12: 151-163. [Crossref]
- Ahmed F, Polash Paul P, Gavrilova ML (2015) Kinect-based gait recognition using sequences of the most relevant joint relative angles.
- Dikovski B, Madjarov G, Gjorgjevikj D (2014) Evaluation of different feature sets for gait recognition using skeletal data from Kinect. In Information and Communication Technology, Electronics and Microelectronics (MIPRO). 37th International Convention. IEEE: 1304-1308.
- Wang Q, Kurillo G, Ofli F, Bajcsy R (2015) Unsupervised temporal segmentation of repetitive human actions based on kinematic modeling and frequency analysis,” In3D Vision (3DV), 2015 International Conference. IEEE: 562-570.
- Rocha AP, Choupina H, Fernandes JM, Rosas MJ, Vaz R, et al. (2015) Kinect v2 based system for Parkinson's disease assessment. In Engineering in Medicine and Biology Society (EMBC). 37th Annual International Conference of the IEEE: 1279-1282.
- Yang X, Tian YL (2012) Eigenjoints-based action recognition using naive-bayes-nearest-neighbor. In Computer vision and pattern recognition workshops (CVPRW). IEEE computer society conference: 14-19.
- Andersson VO, de Araújo RM (2015) Person Identification Using Anthropometric and Gait Data from Kinect Sensor. In AAAI: 425-431.
- Arai K, Asmara RA (2014) Human Gait Gender Classification using 3D Discrete Wavelet Transform Feature Extraction. International Journal of Advanced Re-search in Artificial Intelligence 3: 12-17.
- Elkurdi A, Soufian M, Nefti-Meziani S (2018) Using Amplitude Spectrum for Gait Features Extraction and Classification using Machine Learning, Accepted in International Conference On Innovative Engineering Technologies (ICIET). Cannes, France.
- Arvidsson S, Pérez-Rodríguez P, Mueller-Roeber B (2011) A growth phenotyping pipeline for Arabidopsis thaliana integrating image analysis and rosette area modeling for robust quantification of genotype effects. New Phytol 191: 895-907. [Crossref]
- Soufain M, Nefti-Meziani S, Drake J (2018) Toward Kinecting Cognition by Behaviour Recognition based Machine Learning and Big Data. [Submitted to special issue on Narrowing the gap: ICTs for cognitively impaired older adults, International Journal of Universal Access in the Information Society, Springer Nature Switzerland].


 , as shown in Figure 3. In this technique, the frequency of reference signal is changing according to the variations of the amplitude of the leg velocity signal. Figure 3 illustrates the frequency states of reference signal before and after the modulation process. This mathematically can be expressed as follow:


