Cases of adult obesity have been rising in every age group and gender of the Saudi population. If this trend continues it can lead to drastically high incidences of diabetes and the coronary heart disease (CHD). In a recent 2014 world health survey by the WHO, Saudi Arabia was ranked 27th in the world in CHD related deaths. Additionally in Saudi Arabia CHD was the leading cause of death in 2014. Therefore, in this study we decided to look at the possible correlation between the inheritance of blood group antigens and the high incidences of myocardial infarction (MI) among the adult male patients. Results of our study show that in the randomly selected male control group 20.7% were A+ and 3.35% were A- while 14.3% were found to be B+ and 3.95% were B-. AB blood group was the least prevalent blood group among the control population. Only 8.2% were found to be AB+ and 2.43% were A-. As previously reported by us and others O+ blood group was the most prevalent blood group among the control population at 38.3% while only 8.5% were found to be O-. In contrast when we analyzed the blood group distribution among the 111 MI male patients our results showed a statistically significant reduction in the combined Rh- male MI patients as compared to the Rh- individuals in the control group. Additionally we found a significantly high prevalence of A+ blood group (30.6%) among the MI patients as compared to the control population. Our results also showed a small but not a significant increase in B+ and O+ blood groups in MI patients as compared to the controls. Finally our results show statistically significant reduction in O- MI patients as compared to the control population. In conclusion A+ individuals show statistically high incidences of MI and O- individuals show statistically low incidences of MI in male patients. Our results also show a statistically significant reduction in the Rh- MI patients as compared to the control group. Significance of this reduction is not clear at this time.
Myocardial Infarction (MI), hypertension, Coronary heart disease (CHD), Cardiovascular disease (CVD) , Coronary artery disease (CAD), ABO and Rh Blood Groups, Diabetes, Obesity, von Willebrand factor
According to the recent world health organization (WHO) survey 17.5 million people die every year due to cardiovascular disease (CVD) making it about 31% of all the global deaths, moreover 80% of these deaths occur due to myocardial infarctions (MCI) heart and strokes (WHO Media Centre, 2016). According to the same survey 75% of the CVD related deaths occur in the countries with low or middle income. Due to the seriousness of this issue and its toll on global population, on September 22nd, 2016, the WHO launched “Global Hearts” initiative to fight back CVDs including the cases of stroke and heart attacks.
According to the WHO world health ranking survey Saudi Arabia ranked 27th in coronary heart disease (CHD) related deaths. CHD was also the leading cause of deaths in Saudi Arabia (WHO, 2014 survey) [1]. One of the major reasons for CHD is tobacco use (WHO bulletin 2016) and the rapidly rising cases of obesity in Saudi Arabia [2,3] due to consumption of unhealthy diet, lack of exercise or any other physical activity [3].
In the recent past inheritance of ABO blood groups has been linked to various diseases such as diabetes [4,5] many types of cancers [6] and cardiovascular diseases [7]. Although several studies have been published showing the association between the inheritance of blood groups (ABO and Rh antigens) and cardiovascular diseases [8- 10], coronary artery disease [7], ischemic heart disease (IHD) [11], however results have not been consistent. According to one study as compared to the other blood groups A blood group subjects had significantly high risk of IHD [11], while another study suggests AB blood groups reduce the risks of CHD while O blood groups raise the risks of CHD due to lower HDL- c levels [10].
Since the results of previous studies have been inconsistent regarding the association between the CAD and the inheritance of AB and the Rh (D) blood group antigens, and since according to WHO, CAD is the leading cause of death in Saudi Arabia (WHO 2014 survey), we decided to perform a smaller study on 111 male CHD patients who were admitted in the recent past to the king Khaled hospital (KKH) in the Hail region of Saudi Arabia with an acute myocardial infarction (MI).
In the current study we randomly chose 329 male control subjects and 111 myocardial infarction male patients who were enrolled at (KKH) Cardiology Department in Hail region of Saudi Arabia. For the male patients’ we collected ABO blood group analysis data we also collected some other information about the patients and the control subjects about some other risk factors such as their smoking habits, their age and gender, existence of obesity, diabetes, and the family history of heart disease and occurrence of myocardial infarction. Final data was statistically analyzed by using the Z- test calculator for the two population proportions. Representative blood group analysis was done on control subjects using the blood grouping serum kit from crescent diagnostics P.O. box 9939 Jeddah 21423 KSA (license # 141). Anti A, catalog # SG303, anti B catalog # SG304, and anti D (1gM+IgG) catalog # SG307 were used for performing our blood group analysis. In short finger tip of a subject was wiped clean with alcohol swab, air dried and punctured with a sterile needle and 3 small drops were placed on a clean glass slide then using the sera vial dropper one drop of anti A, anti B and anti D was placed respectively on the already placed blood drops and the blood and the anti sera were immediately mixed using separate clean wooden toothpicks.
Incidences of smoking, hypertension and diabetes in randomly selected control group
For the current study we randomly selected 329 control male subjects age range 12-86 with the mean age of 32.7 years. Next we wanted to look at some of the risk factors which are known to be associated with CHD, such as smoking habits, hypertension and diabetes in the control population. We found 43% to be the smokers, 11% had type II diabetes (T2DM), and 6% were hypertensive (Table 1).
Table 1. Control male group profile
Number (n) |
Age Range |
Mean Age |
Smokers (%) |
Hypertension (%) |
Diabetes Mellitus |
329 |
12-86 years |
32.7 years |
43% |
6% |
11% |
Blood Group analysis and the ABO and Rh antigen distribution frequencies among the control subjects
We also performed a general blood group analysis (Figure 1) on few of our randomly selected control subjects and the results are shown below (Figure 1). Next we looked at the combined distribution of Rh+ antigen as compared to the Rh- (absence of Rh antigen) in the control population. Our results show that out of 329 randomly selected male control subjects chosen for this study about 82% were found to be Rh+ and18% were Rh-(Figure 2. Table 2). 3.34% were found to be A- and 20.66% were found to be A+. Almost 4% of our control subjects were B- and 14.28% were B+. AB- was the least expressed blood group among all blood groups in the controls (AB- 2.43%) and AB+ was the least expressed Rh+ blood group at 8.2% (Table 2). As previously reported by us [5] and others [12]. O+ was found to be the most prevalent blood group (38.3%) and AB as the least prevalent blood group among the control subjects (Table 2).
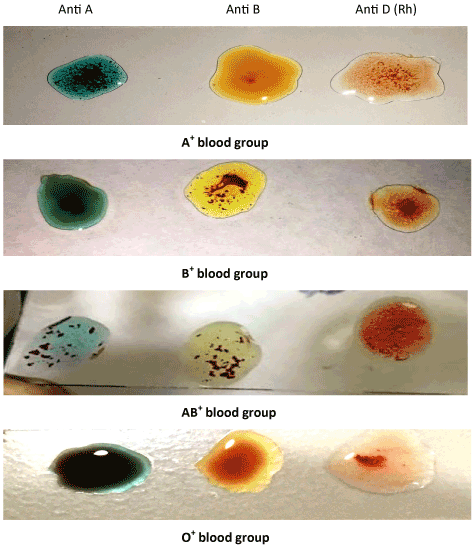
Figure 1. A representative blood group analysis using anti A, anti B and anti Rh sera on a few control male subjects.
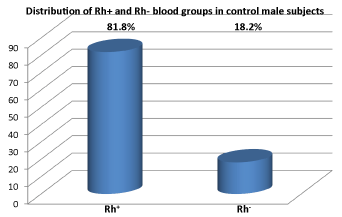
Figure 2. Distribution of ABO and the total Rh antigens in randomly selected male control population in Hail region of Saudi Arabia.
Table 2. ABO and Rh antigen percent (%) distribution in control population
Blood group Antigen |
Number of subjects |
Percent expression (%) |
A-Blood group antigen |
11/329 |
3.34% |
A+ Blood group antigen |
68/329 |
20.66% |
B-Blood group antigen |
13/329 |
3.95% |
B+ Blood group antigen |
47/329 |
14.28% |
AB-Blood group antigen |
8/329 |
2.43% |
AB +Blood group antigen |
27/329 |
8.2% |
O- Blood group antigen |
28/329 |
8.5% |
O+ Blood group antigen |
126/329 |
38.3% |
Rh- subjects |
60/329 |
18.23% |
Rh+ subjects |
269/329 |
81.76% |
Incidences of smoking, hypertension and diabetes in male MI selected patients
We then analyzed the blood group distribution data of 111 male MI patients registered at the king Khaled hospital in Hail city. Their age range was between 16-90 years with mean age at 49.38 years. The mean age of our MI patients was higher than the control group. Among the MI patients 45.04% were found to be smokers, 37.83% were hypertensive and 41.4% were found to have diabetes mellitus (T2DM) (Table 3).
Table 3. Myocardial Infarction male patient’s profile
Number (n) |
Age Range |
Mean Age |
Smokers (%) |
Hypertension (%) |
Diabetes Mellitus |
111 |
16-90 years |
49.38 years |
45.04% |
37.83% |
41.4% |
Comparison of CHD risk factors such as smoking, hypertension and diabetes between control and the MI male patients
When we compared the presence of CHD risk factors (smoking, hypertension and diabetes) in MI patients, we found a dramatic increase in the cases of T2DM and hypertension among the MI patients (Table 3) as compared to the control group (Figure 3). Although a high percentage of control and MI patient population was found to be the smokers, we found no significant differences in the smoking habits between the two groups (Table 1 and 3, Figure 3).
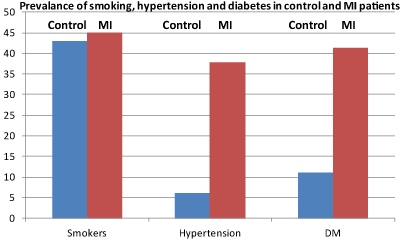
Figure 3. Prevalence of smoking, hypertension and diabetes mellitus among the male control (blue bars) and the MCI patients (red bars) in Hail region of Saudi Arabia.
Comparative prevalence of smoking, hypertension and diabetes mellitus (T2DM) between the control and MI male patients
43% of the control subject were smokers, 6% were hypertensive and 11% had T2DM (Figure 4, Table 2). However when we compared this data with the MI patient data to our surprise we did not find significant differences in the smoking habits between the controls and the MI patients. Although the percentage of smokers was very high in control group as well as among the MI patients however, there were no statistically significant differences between the two populations (Figure 3). The p value was 0.337 and was not significant at p˂0.05. However, there was about 6 fold increase in the incidences of hypertension among the MI patients (37.83%) as compared to the male control group (Figure 3). The results were found to be significant at p˂0.01. Like development of hypertension we also saw a statistically significant increase in the incidences of T2DM among the MI patients (41.4%) as compared to the control group (11% increases). The results were significantly different at p˂0.01 (Tables 1 and 3, Figure 3).
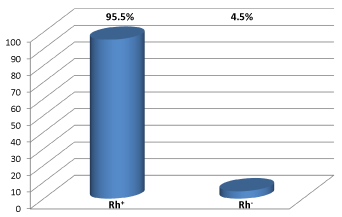
Figure 4. Distribution of the ABO and the total Rh antigens in the MCI male patients in Hail region
ABO and Rh antigen distribution in the male myocardial infarction patients
Next we analyzed the ABO and Rh blood group antigen distribution data among the MI male patients registered at the king Khaled hospital. Out of 111 MI male patients, we found 95.5% to be Rh+ and 4.5% were found to be Rh-. Expression of the combined Rh+ individuals was significantly higher at 95.5% as compared to 81.8% among the control group (statistically significant at p ˂ 0.05) (Table III and IV). Similarly there was statistically significant reduction in combined Rh-individuals (4.5%) in MI patients as compared to the control group (18.2%), (Figure 3, Tables 2 and 4). Further analysis of distribution of ABO blood groups among MI patients revealed that like the control group O+ was the most prevalent and AB+ was the least prevalent blood type among the MI patients (Table 4). Similarly like control population A+ blood group was the second most prevalent blood group among the MI patients, however A+ showed a significant increase in its distribution in MI patients (30.6%) as compared to the control group (20.66%). These results were statistically significant at p ˂ 0.05. There was no significant difference between the distribution frequencies of B+ or AB+ blood groups between the control and the MI patients (Tables 2 and 4, Figure 5). Only 18% of the MI patients were B+ as compared to the 14.3% in the control population. 6.3% were AB+ as compared to the 8.2% among the control group. Among the Rh negative blood groups A-, AB- and O- tied for the lowest distribution (0.9%) among the MI patients while B- showed about double the distribution at 1.8% as compared to the A-, AB-, O- (Table 4). In contrast among the control population all negative blood groups (A-, B-, AB-, and O-) showed dramatic increases in their distribution as compared to their counterparts among the MI patients (Tables 2 and 4).
Table 4. Myocardial Infarction male patient’s ABO and Rh antigen percent (%) distribution
Blood group Antigen |
Number of subjects |
Percent expression (%) |
A-Blood group antigen |
1/111 |
0.9% |
A+ Blood group antigen |
34/111 |
30.6% |
B-Blood group antigen |
2/111 |
1.8% |
B+ Blood group antigen |
20/111 |
18.01% |
AB-Blood group antigen |
1/111 |
0.9% |
AB +Blood group antigen |
7/111 |
6.3% |
O- Blood group antigen |
1/111 |
0.9% |
O+ Blood group antigen |
45/111 |
40.5% |
Rh- subjects |
5/111 |
4.5% |
Rh+ subjects |
269/111 |
95.5% |
According to the WHO world health ranking survey of 2014, the coronary heart disease (CHD) was the leading cause of deaths in Saudi Arabia. In 2014, 24.34% of all deaths in Saudi Arabia occurred due to the CHD. According to the same WHO survey stroke was the second leading cause of death while diabetes was the fourth leading cause of death. In a coronary heart disease plaques tend to build up inside the coronary arteries therefore seriously restricting the normal oxygen flow to the heart muscles, if not treated immediately this condition can lead to serious consequences such as the angina pectoris, or even emboli can form and block or restrict the normal blood flow inside a coronary artery eventually leading to myocardial infarction (MI) or heart attack.
Since according to the WHO 2014 health survey, 2021 Copyright OAT. All rights reserv Saudi population (19,569 people died in 2014), and since earlier studies have already shown that people who have any blood groups other than the O blood type (A, B, AB), they have about 25% higher levels of von Willebrand factor (VWF) and factor VIII as compared to the O blood type [13]. These clotting factors are well known risk factors for thrombosis [14,15]. Consistent high levels of these factors can eventually lead to MI or stroke. However, according to another earlier study, B blood group subjects showed the lowest levels of VWF as compared to other blood types [16] the authors of this study suggested the differences in ethnicity could be responsible for these discrepancies. Since it is already established that the blood groups are the major determinants of VWF levels and since high VWF is considered as one of the major risk factors for thrombosis [14,15] and since previous studies have not been consistent about the specific blood groups and their possible association with the plasma levels of VWF and factor VIII, and since CHD is the leading cause of death in Saudi Arabia, we decided to look at possible correlation and association between the CHD and inheritance of ABO and Rh antigens in the Saudi population.
Results of this study were collected from 111 MI male patients registered at the King Khaled hospital, in hail region of Saudi Arabia and compared with the 329 randomly selected male control subjects. Our results show about 82% of the local control population was Rh+ while 18% were found to be Rh- . In contrast 95.5% MI patients were Rh+ and only 4.5% patients were found to be Rh-. These results show a statistically significant reduction in the Rh- MI patients as compared to the Rh- randomly selected control subjects (Tables 2 and 4, Figures 3 and 5). These results suggest some kind of resistance to incidences of MI among the Rh- individuals. The reason and the significance behind this dramatical reduction in MI cases among the Rh- individuals are not clearly understood at this time. Similarly in MI male patients we found a statistically significant combine increase in Rh+ blood group antigens (Z score was -3.52 and the P value was p˂ 0.00044) as compared to the control subjects (Tables 2 and 4, Figures 3 and 5). These results are consistent with our previously published results in which we reported the similar findings for the male and female type II diabetes (T2DM) patients with statistically significant reduction in Rh- individuals [3,5].
These results suggest a possible association between presence of Rh antigen and slightly higher incidences of MI among the male patients. The reason behind this dramatic combine increase in Rh+ antigen among the MI patients need to be investigated in larger studies.
Next we decided to compare the distribution frequency of occurrence of individual blood group antigens (A B and Rh) between the randomly selected controls and male MI patients who were registered at king Khaled hospital in hail Saudi Arabia. Further analysis of our data showed a small but statistically non significant increase in the distribution of B+and the O+ blood groups among the MI patients as compared to the control group (Tables 2 and 6, Figure 5), in contrast we found a slight but statistically non significant reduction (p˂0.28) in the distribution of B- blood group in MI patients as compared to the control group however we found a statistically significant reduction in O- individuals among MI male patients (Z score 2.79 and P ˂0.0052) as compared to the control group (Tables 2 and 4, Figure 5). Although our results show slight but a non significant increase in expression of B+ and O+ blood groups among MI patients as compared to the control subjects however the A+ blood group showed the most dramatic and statistically significant increase among the male MI patients (Tables 2 and 4, Figure 5) as compared to the control subjects (Z score -2.15 and P˂0.031). In summary our results tend to support the hypothesis of a possible association of inheritance of A+, individuals with high incidences of MI among the male Saudi population. In contrast our results also show that O- individuals show statistically most reduced incidences of MI as compared to the male control population (Z score 2.794, p value is 0.0052).
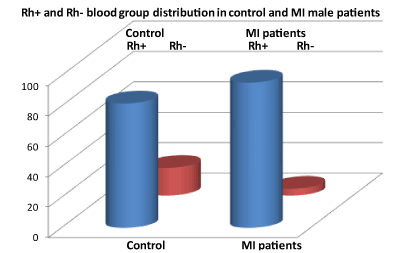
Figure 5. Comparative distribution of the ABO (blue bars) and total Rh antigens (red bars) among male control and the MI patients in Hail region of Saudi Arabia.
Although the mean age of MI patients was higher than the control group, we think it could very well be due to the fact that MI in general tends to occur in older age.
So in conclusion our results show that male patients with A+ blood group tend to show significantly higher incidences of myocardial infarction as compared to the control group. In contrast O- individuals showed a significant reduction in the incidences of MI (0.9%) as compared to the control O- individuals (8.5%). High LDL or low HDL plasma concentrations and the uncontrolled diabetes are well known risk factors for developing CHD. As expected we saw a 6 fold increases in hypertension among MI patients as compared to the control group. Likewise we saw a 3.8 fold increase in the cases of T2DM as compared to the control group. Therefore our results suggest a low resistance to incidences of myocardial infarctions among O- male patient as compared to the control male population (Tables 2 and 4, Figure 6). Larger studies need to be done to confirm these results.
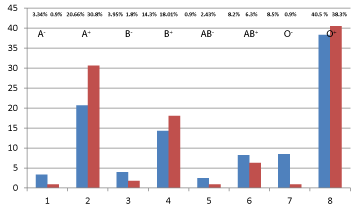
Figure 6. Blood group distribution among the male control (blue bars) and the MCI patients (red bars) in Hail region of Saudi Arabia.
- WHO (2014) World health rankings. Iive longer live better. May 2014.
- Al-Dossary SS, Sarkis PE, Hassan A, Ezz El Regal M, Fouda AE (2010) Obesity in Saudi children: a dangerous reality. East Mediterr Health J 16: 1003-1008. [Crossref]
- Farshori MPQ, Al-Wakid IH, AL Ibrahim IK, ALShammari AF, Alduejieman M, et al. (2016) Distribution of ABO and Rhesus (Rh) blood group antigens in male type 2 diabetes mellitus patients in Hail region of Saudi Arabia: High incidences of diabetes mellitus in males with B+ blood type. Integr Obesity Diabetes 2: 1-6.
- Fagherazzi G, Gusto G, Clavel-Chapelon F, Balkau B, Bonnet F (2015) ABO and Rhesus blood groups and risk of type 2 diabetes: evidence from the large E3N cohort study. Diabetologia 58: 519-522. [Crossref]
- Farshori MP (2017) Frequency of distribution of abo and rhesus (Rh) blood group antigens in the female type 2 diabetes mellitus (T2DM) patients in hail region of Saudi Arabia. Integr Obesity Diabetes 3: 1-5.
- Zhang BL, He N, Huang YB, Song FJ, Chen KX (2014) ABO blood groups and risk of cancer: a systematic review and meta-analysis. Asian Pac J Cancer Prev 15: 4643-4650. [Crossref]
- Chen Z, Yang SH, Xu H, Li JJ (2016) ABO blood group system and the coronary artery disease: an updated systematic review and meta-analysis. Sci Rep 6: 23250. [Crossref]
- Wazirali H, Ashfaque RA, Herzig JW (2005) Association of blood group A with increased risk of coronary heart disease in the Pakistani population. Pak J of Physiology 1: 1-11.
- Zhang H, Mooney CJ, Reilly MP (2012) ABO blood groups and cardiovascular diseases. Int J Vasc Med 2012: 641917. [Crossref]
- Biswas S, Ghoshal PK, Halder B, Mandal N (2013) Distribution of ABO blood group and major cardiovascular risk factors with coronary heart disease. Biomed Res Int 2013: 782941. [Crossref]
- Sharif S, Anwar N, Farasat T, Naz S (2013) Group frequency in ischemic heart disease patients in Pakistani population. Pak J Med Sci 30: 593-595.
- Bashwari LA, Al-Mulhim AA, Ahmad MS, Ahmed MA (2001) Frequency of ABO blood groups in the Eastern region of Saudi Arabia. Saudi Med J 22: 1008-1012. [Crossref]
- Gill JC, Endres-Brooks J, Bauer PJ, Marks WJ, Montgomery RR (1987) The effects of ABO blood group on the diagnosis of von Willebrand disease. Blood 1691-1695.
- Koster T, Blann AD, Briët E, Vandenbroucke JP, Rosendaal FR (1995) Role of clotting factor VIII in effect of von Willebrand factor on occurrence of deep-vein thrombosis. Lancet 345: 152-155. [Crossref]
- Whincup PH, Danesh J, Walker M, Lennon L, Thomson A, et al. (2002) von Willebrand factor and coronary heart disease: prospective study and meta-analysis. Eur Heart J 23: 1764-1770. [Crossref]
- Mohanty D, Ghosh K, Marwaha N, Kaur S, Chauhan AP, et al. (1984) Major blood group antigens--a determinant of factor VIII levels in blood? Thromb Haemost 51: 414. [Crossref]


