Abstract
Purpose: In this study we aimed to describe visual acuity (VA) evolution and assess the benefit of personalized monitoring in a population of patients treated in real life for wet age-related macular degeneration (AMD) with ranibizumab intravitreal injections (IVI) using pro re nata (PRN) regimen for 5 years.
Methods: All consecutive patients treated in the ophthalmologic department from August 2011 to August 2013 were retrospectively enrolled.
All patients had PRN monthly monitoring, either during AMD–dedicated or standard consultations.
The primary objective was to study VA evolution, assessed by ETDRS and Snellen equivalent, over time.
The secondary objectives were to assess the role of the following parameters on VA evolution: Follow-up (FU) and IVI visit numbers, treatment adherence (or delay between FU and IVI), neo-vessel (NV) types, induction phase or not, AMD–dedicated or standard consultation and to identify predictive factors for VA change.
VA evolution and monitoring quality (FU number, IVI visit number) were analyzed up to 5 years.
Results: Two-year analysis (n=144 patients): VA increased significantly between baseline and 6 months (p=0.0009 and p=0.0069). Induction phase did not significantly affect VA evolution (except at 6 months). Patients with induction phase had 3.5-times less chance of VA increase (p=0.0050). The initial NV type did not affect AV evolution. The ETDRS scores at 4, 6, 8 and 12 months were significantly higher with AMD-dedicated vs standard consultations (p<0.05).
Five-year analysis (n=109 patients): VA declined, but not significantly, from 24 months until the end of the studied period. The mean number of FU and IV visits constantly decreased (mostly significantly).
Conclusions: Systematic induction phase did not offer better prognosis. PRN monitoring with AMD-dedicated consultations seemed necessary during the first year, avoiding over- or undertreatment, often deleterious. These 5-year results in real life showed AV stabilization despite a significant decrease of FU and IVI visits over time.
Key words
age-related macular degeneration, intravitreal injections, monitoring, PRN, ranibizumab, visual acuity
Abbreviations
AMD- Age-related macular degeneration, CNV- Choroidal neo vessel, ETDRS- Early Treatment of Diabetic Retinopathy Study, FU- Follow-up, IVI- Intravitreal injections, NV- Neo-vessels, OCT- Optical coherence tomography, PED- Pigment epithelial detachment, PRN- Pro re nata, VEGF- Vascular endothelial growth factor, VA- Visual acuity.
Introduction
Aged macular degeneration (AMD) is a leading cause of blindness in industrialized countries for patients over 50 years [1,2]. Its incidence is continuously increasing with life expectancy [2] leading to a loss of autonomy and the deterioration of patients’ quality of life.
A choroidal neovascularization complication in AMD is a cornerstone of this disease's evolution [2,3]. Anti-vascular endothelial growth factors (VEGF) were the first medications that improved visual acuity (VA) [4-16] and are now considered as standard treatment for AMD.
In the literature, real-life studies suggested that anti-VEGF (ranibizumab and Aflibercept) dosing was not performed according to the official recommendations leading to under treatment [17-19]. Personalized monitoring and dosing have been adopted in many centers but their effects on VA in real visual acuity in real life have not been confirmed yet.
Some studies about long term monitoring (up to 5 years) are available [20-23], but few results are published published in real life [24].
In our Ophthalmologic department, all patients are routinely treated with anti VEGF (ranibizumab) intravitreal injections (IVI) using pro re nata (PRN) regimen during either AMD–dedicated or standard consultations.
The primary objective of this study was to assess VA evolution, measured by ETDRS and Snellen equivalent, in real life in a population of patients treated for wet AMD with IVI of anti VEGF (ranibizumab) using PRN regimen over a 5-year period.
The secondary objectives were to assess the quality of monitoring (number of FU and IVI visits), treatment adherence (gap in days between a consultation and the next IVI) and to compare VA evolution within subgroups based on: choroidal neo-vessel (CNV) types, induction phase or not, AMD–dedicated or standard consultation. An identification of predictive factors for VA change was also performed.
These analyses could bring to light important information about personalized patient’s management, recurrence and retreatment rates, with relevant implications for our clinical practice.
Materials and methods
ELOUAN was a retrospective, single-center, investigator-initiated study (clinicaltrials.gov identifier, NCT02089503).
Inclusion criteria: patients with exudative-subfoveal AMD, regardless of NV type or initial VA; patients treated in the ophthalmologic department with ranibizumab IVI from August 2011 to August 2013; if both eyes were eligible, both were analyzed.
Exclusion criteria: patients who received anti-VEGF treatment other than ranibizumab for the studied eye(s); patients with high myopia or a NV not related to exudative AMD; patients treated outside the study period.
Monitoring (consultation and retreatment rates) were based on strict PRN (PRONTO type).
This monitoring was conducted through monthly control visits or follow-up (FU visits) alternating when necessary with treatment visits (IVI visits).
FU and IVI visits were performed by 2 retina specialists either during AMD-dedicated consultations (retinologist 1) or during standard consultations (retinologist 2). The AMD-dedicated consultations were performed during specific schedules (one day per week) and had longer durations (30 mn) whereas routine consultations were performed 5 days/week for various ophthalmological pathologies.
For both practitioners the induction phase, with 3 monthly IVI for the first 3 months, was not systematically carried out: all patients had monthly FU, but IVI were performed only if necessary (even at the first stage of the pathology).
For both practitioners, FU were systematically based on: VA evaluation with ETDRS charts and SNELLEN equivalent [25] (performed by an orthoptist or an ophthalmologist), slit-lamp examination with fundus analysis and management of intraocular pressure, and macular Optical Coherence Tomography (OCT). A fluorescein angiography, supplemented if necessary by indocyanine green angiography, was routinely performed before starting any treatment to confirm and specify the diagnosis.
The NV types, determined by angiography, were graded by two different ophthalmologists and, in case of disagreement, were discussed during staff meetings.
Complications were routinely assessed at each FU visit by patient’s questioning about any new medical event or treatment change.
The date of the last VA measurement before the first IVI was defined as baseline.
For each patient, all data were collected and analyzed at baseline and at 3, 6, 12, 18, 24 months. In order to extend the analysis up to 5 years, data related to VA, FU and IVI visit numbers were secondly analyzed every 6 months from 24 months to 60 months.
Statistical analyses
Quantitative variables are expressed as mean and standard deviation (SD), or median [95% confidence interval], as appropriate. Qualitative variables are expressed as percentages of the study population.
The nonparametric Wilcoxon and Brown–Mood tests were used to compare VA. Parametric Chi-square and Fisher's exact tests were used, when appropriate, to compare VA evolution within subgroups. The Cochran–Armitage test was used to measure the significance of the inter-class trend, when possible. A p value >0.05 was considered statistically significant.
Independent factors for VA evolution were assessed using univariate analysis which was followed up with a multivariate analysis. In univariate analysis crude, comparisons regarding categorical variables were carried out using the χ²-test or the Fisher test. The results of the multivariate analysis are presented as odds ratios (OR) with 95%CI.
All statistical analyses were performed using SAS software version 9.1 (SAS Institute Inc., Cary, NC).
Results
2-year results
During the study period, 144 consecutive patients (165 eyes) were included. The population was characterized by a typical prevalence of women (67.36%) and older age (mean age 78.6 ± 8.2 years). Major medical histories were related to weak cardiovascular conditions, usually observed in elderly patients: i.e., arterial hypertension (54%), dyslipidemia (33%), and diabetes (17%). All the patients’ characteristics are detailed in table 1.
Table 1. Patients’ characteristics in the 2-year analysis (n=144).
|
Study population (N=144) |
Age (years) |
|
Mean ± SD |
78.6 ± 8.2 |
Median [CI95%] |
80 [78-81] |
Gender |
|
Women, N (%) |
97 (67%) |
Men, N (%) |
47 (33%) |
Arterial hypertension, N (%) |
78 (54%) |
Dyslipidemia, N (%) |
48 (33%) |
Light iris color, N (%) |
0 |
Heart failure, N (%) |
18 (13%) |
Hypothyroidism, N (%) |
19 (13%) |
Hyperthyroidism, N (%) |
4 (3%) |
Tobacco use, N (%) |
7 (5%) |
Diabetes, N (%) |
25 (17%) |
Myocardial infarction, N (%) |
5 (3%) |
Stroke, N (%) |
5 (3%) |
Ischemia reperfusion, N (%) |
0 |
Transient ischemic incident, N (%) |
0 |
Cataract, right eye, N (%) |
36 (25%) |
Cataract, left eye, N (%) |
38 (26%) |
Glaucoma, right eye, N (%) |
4 (3%) |
Glaucoma, left eye, N (%) |
4 (3%) |
Quantitative variables are expressed as mean + Standard Deviation (SD) or as median with Confidence Interval [CI]95%.
VA evolution (Figure 1, 2)
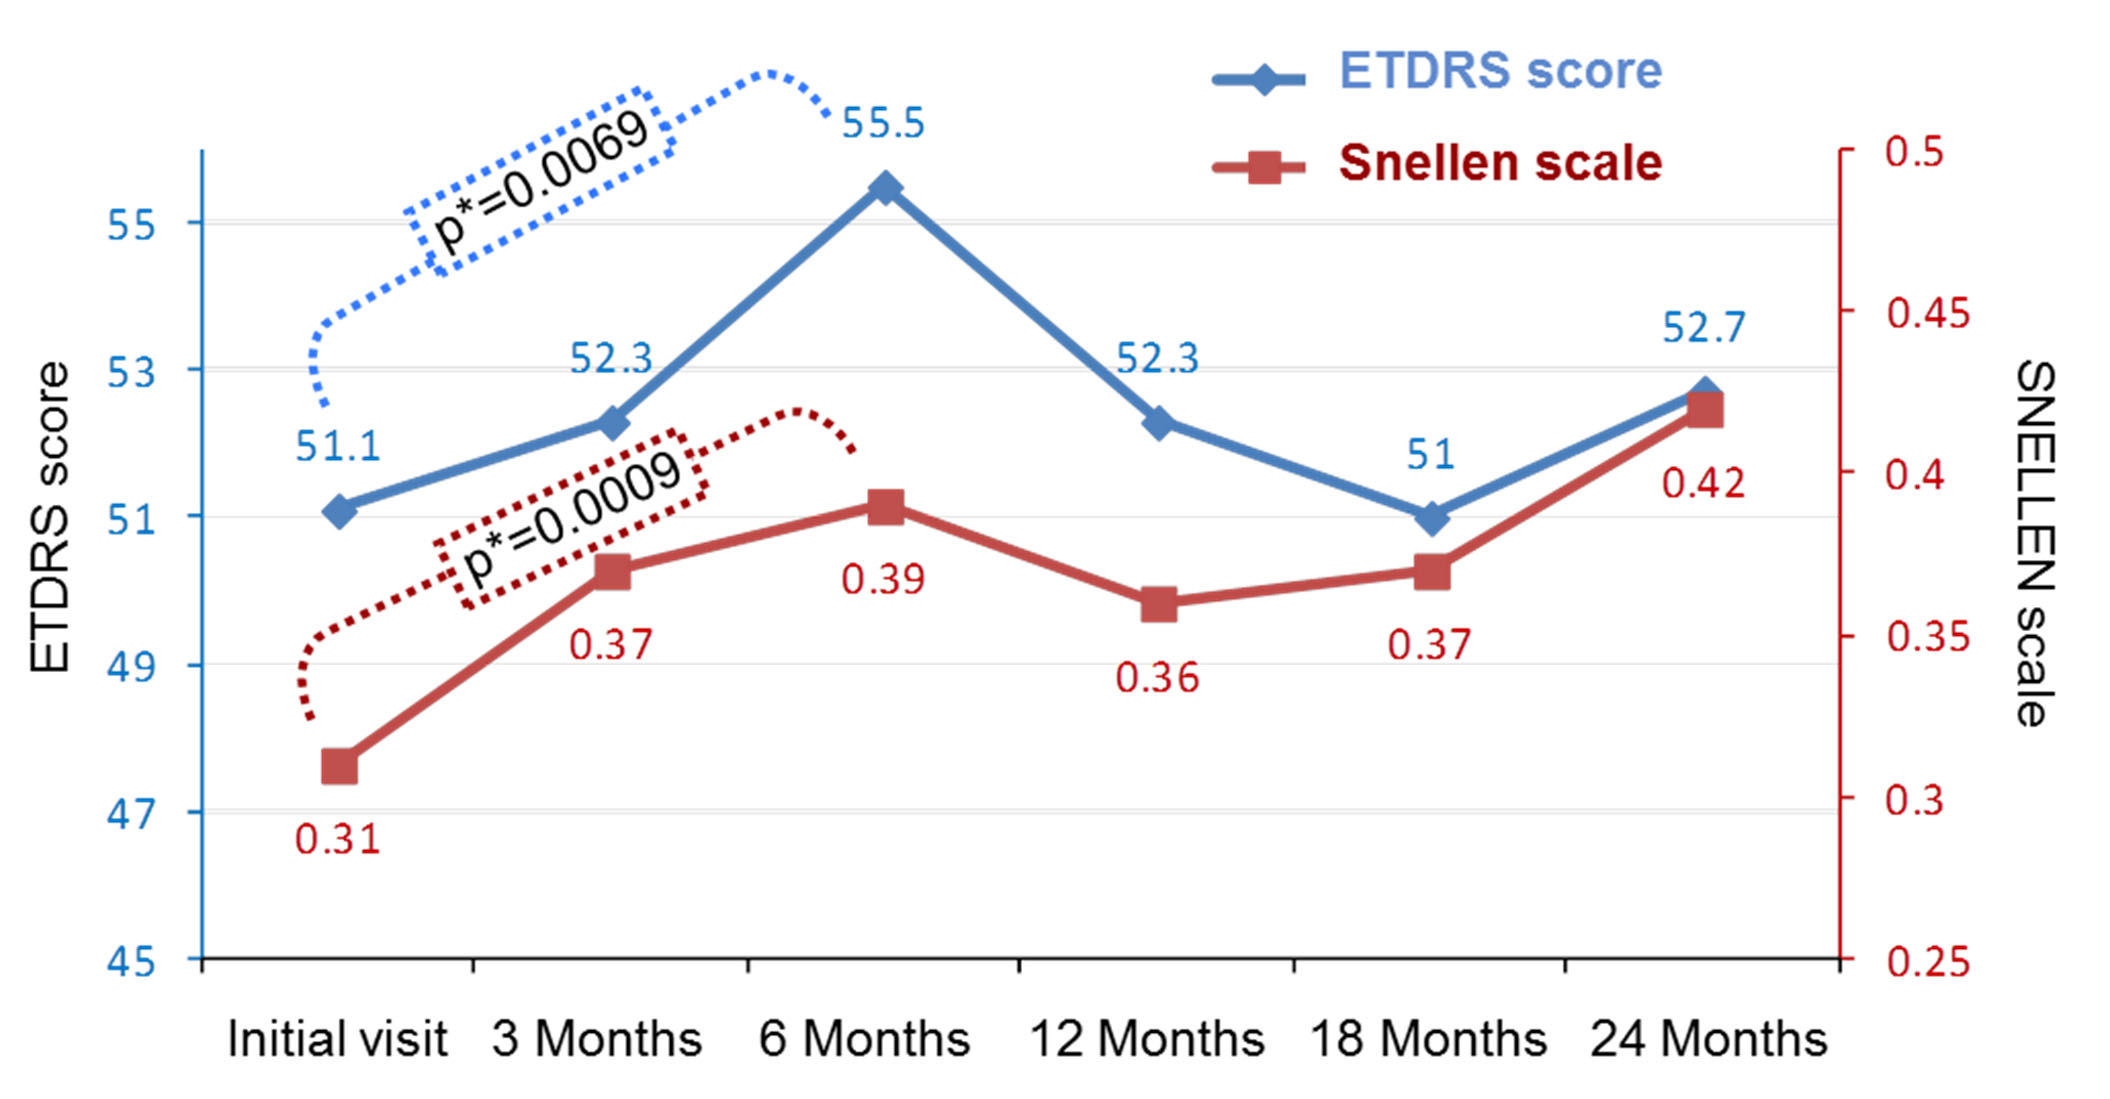
Figure 1. Evolution of ETDRS score and SNELLEN scale from the initial visit and during the 24-month follow up period (144 patients; 165 eyes).
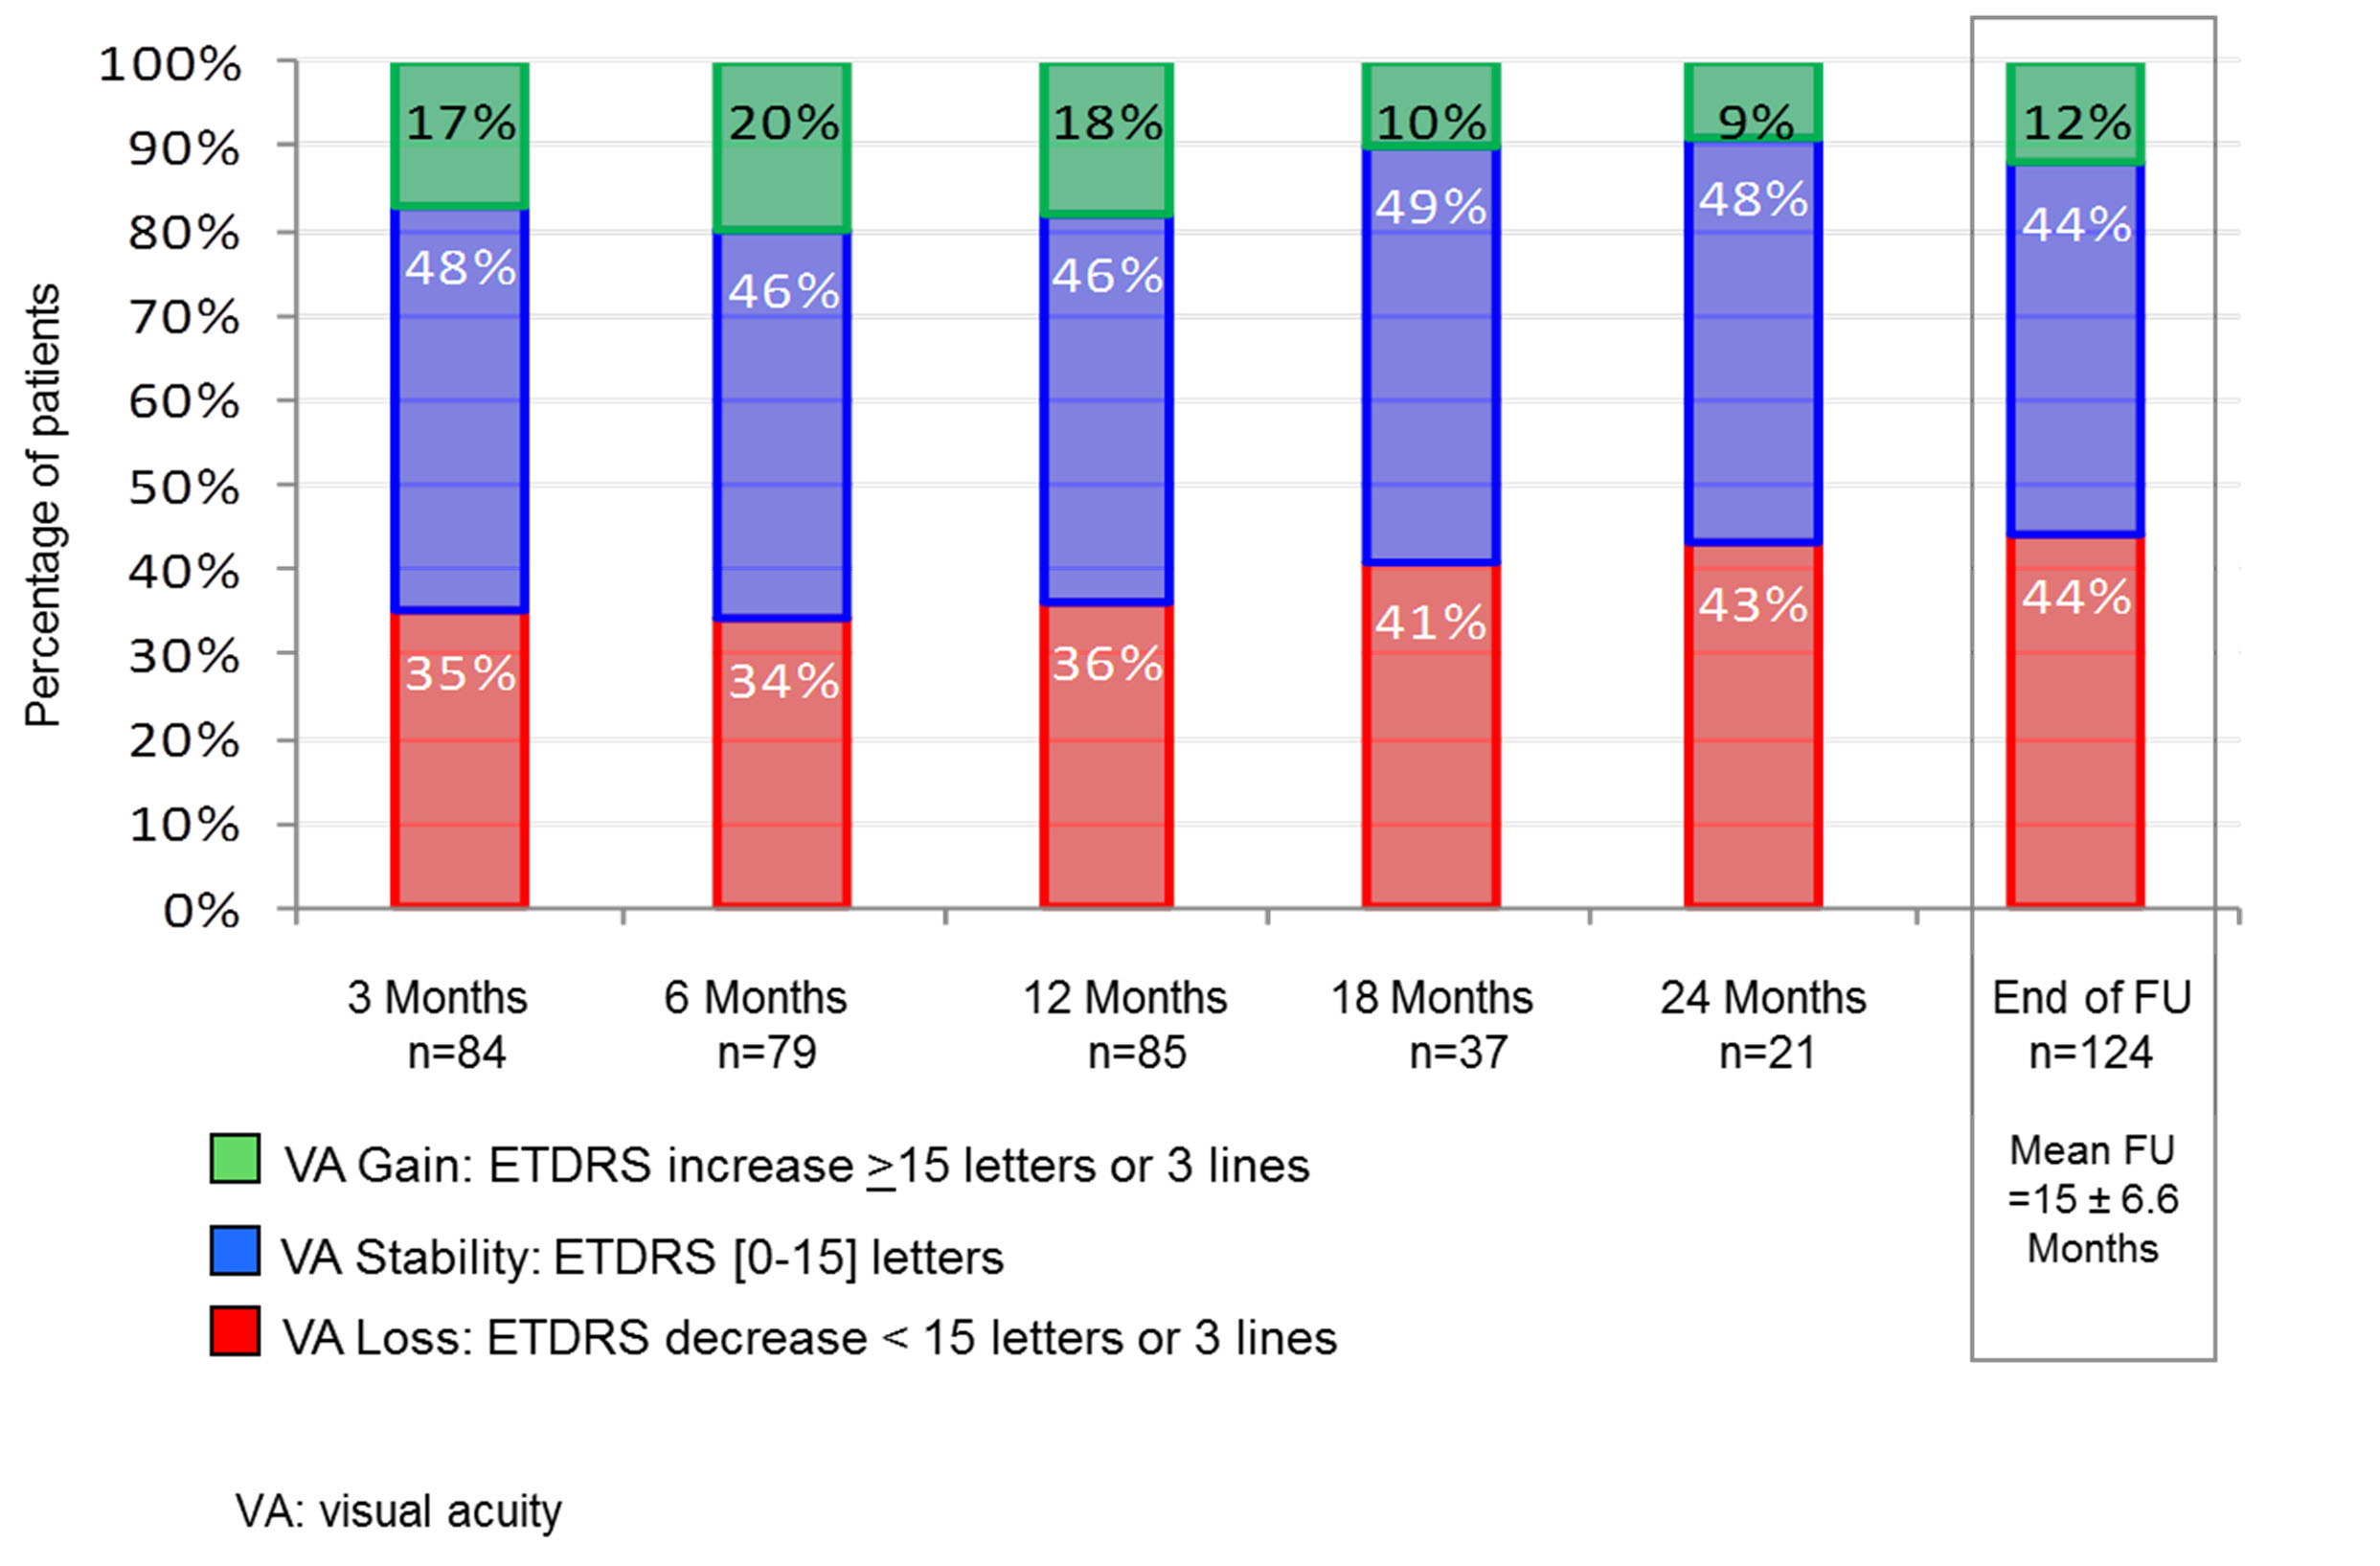
Figure 2. Visual acuity (ETDRS scores) during the 24-month follow-up period (144 patients 165 eyes).
VA (measured by ETDRS and Snellen equivalent) positively evolved up to 6 months with a gradual and significant increase both for ETDRS and Snellen measurements: respectively from 51.1±22.4 to 55.5±20.7 letters (p=0.0069), and from 0.31±0.22 to 0.39±0.26 (p=0.0009). At 12 and 18 months, the VA slightly decreased. There was no statistical difference between 12 and 18 months. At 24 months, the VA curve went up slightly again, this difference was not statistically significant (Figure 1).
Figure 2 shows the proportion of patients with loss, stability, or a gain of 15 letters or more. In this analysis, the VA gain was ranging from 17% to 20% for the first 18 months, but only from 9 to 10% after 18 months. This gap in VA gain during the first 18 months was the largest detected but was not significant. Nevertheless, the period between the 12th and 18th month seemed to be a turning point in the evolution of this disease.
Number of FU and IVI visits
The mean FU period was 15 ± 6.6 months.
During the first year, the mean visits numbers were 9.9 ± 4.8 for FU for 6.7 ± 5.6 for IVI. These numbers decreased over time in the second year to respectively, 3.17±3.22 for FU for 5.59±4.37 for IVI visits.
Treatment adherence
The mean gap between a FU visit and the next injection visit was 13±13 days.
This gap was longer in summer and Christmas time when patients' and practitioners had vacations.
VA evolution between the 5 CNV groups (Table 2)
Table 2. Comparison between NV types of IVI number and changes in visual acuity (delta ETDRS and SNELLEN).
Monitoring times Median [CI95%] |
NV types by angiography |
P
(K-W)* |
P
(B-M)† |
1
Visible NV |
2
Occult NV |
3
Mixed NV with visible predominance |
4
Mixed NV with occult predominance |
5
Neo-vascularized retinal pigment epithelium detachment |
IVI number |
3 M |
2 [2 ;3] |
2 [2 ;3] |
2 [1 ;3] |
3 |3 ;3] |
3 [2 ;4] |
0.0196 |
0.0434 |
12 M |
3 [3 ;5] |
4 [3 ;5] |
3 [2 ;4] |
4 [3 ;5] |
9 [5 ;10] |
0.0027 |
0.0074 |
End of FU |
5 [3 ;7] |
6 [4 ;7] |
3 [2 ;9] |
4 [4 ;6] |
11 [5 ;20] |
0.0370 |
0.0907 |
ETDRS Delta |
3 M |
0 [-5 ;2] |
0 [0 ;10] |
17 [1 ;38] |
0 [-17 ;13] |
1 [-28 ;16] |
0.2437 |
0.2332 |
6 M |
2 [-7 ;14] |
5 [0 ;10] |
16 [1 ;31] |
5 [-12 ;14] |
-3 [-15 ;24] |
0.5980 |
0.8959 |
12 M |
0 [-20 ;8] |
3.5 [0 ;8] |
32 [-17 ;67] |
-5 [-27 ;15] |
0 [-11 ;16] |
0.2602 |
0.3608 |
18 M |
0 [-12 ;7] |
3.5 [-2 ;6] |
- |
- |
-7 [-39 ;0] |
0.5661 |
0.5235 |
24 M |
3 [-70 ;50] |
5 [-2 ;10] |
- |
- |
-6 [-11 ;0] |
0.5687 |
0.2915 |
End of FU |
-2.5 [-6 ;0] |
4 [0 ;6] |
17 [-17 ;67] |
5 [-9 ;10] |
-1 [-14 ;10] |
0.1763 |
0.0165* |
SNELLEN Delta |
3 M |
0 [-0.1 ;0.03] |
0.07 [0 ;0.17] |
0.05 [0 ;0.27] |
0.04 [0 ;0.3] |
-0.04 [-0.2 ;0.6] |
0.3150 |
0.3011 |
6 M |
0.09 [0 ;0.30] |
0.04 [0 ;0.1] |
0.03 [0 ;0.06] |
0.1 [-0.04 ;0.2] |
0.01 [0.13 ;0.43] |
0.9627 |
0.9622 |
12 M |
0 [-0.18 ;0.03] |
0.02 [0 ;0.13] |
0.2 [0.1 ;0.48] |
0 [-0.2 ;0.2] |
0 [-0.18 ;0.17] |
0.2029 |
0.2687 |
18 M |
0 [-0.1 ;0.9] |
0 [0 ;0.13] |
- |
- |
0 [-0.3 ;0.06] |
0.7582 |
0.7074 |
24 M |
0.07 [-0.6 ;0.9] |
0.13 [0 ;0.3] |
- |
- |
-0.10 [-0.18 ;0] |
0.5891 |
0.3046 |
End of FU |
-0.01 [-0.15 ;0] |
0.05 [0 ;0.13] |
0.11[0.1 ;0.48] |
-0.1 [-0.04 ;0.1] |
0 [-0.2 ;0.17] |
0.1840 |
0.0619 |
NV: neo-vessel; K-W Kruskal–Wallis test; † B-M: Brown–Mood median test
Variables are expressed as median with Confidence Interval [CI] 95%.
*Statistically significant: p <0.05
Group-to-group statistical analyses were carried among the 5 CNV types (type 1 to 5) classified by angiography. The results showed no difference in VA evolution between these 5 subgroups. However, IVI number was higher in the type 5 group (patients with neo-vascularized retinal pigment epithelial detachment [PED], associated with choroidal neovascularization or polypoidal choroidal vasculopathy), than in the other CNV groups.
VA evolution between groups with induction phase vs non induction phase
No differences were found in AV evolution between group A (with an induction phase) and group B (without an induction phase) over the 2-year period, except at 6 months. At this time, there was a significant statistical increase in VA (ETDRS score) for patients without induction phase (group B; n=57 patients) (p=0.0099), but not for patients with induction phase (group A; n=22) (p=0.3250). This result only indicated a trend, as the difference in VA between the two groups was not significant (p [Wilcoxon]=0.5381 and p [Brown–Mood] =0.5445).
Comparisons between group A (with an induction phase) and group B (without an induction phase) showed that the rate of VA loss at 24 months was statistically higher in the induction group (86% vs. 21%) (trend-test P [Cochran–Armitage] =0.0082).
VA evolution between the two PRN monitoring groups
Regarding comparison between monitoring schemes, the results significantly differed between group C (retinologist 1: monitoring with AMD-dedicated consultations; n=120 eyes) and group D (retinologist 2: monitoring of with routine consultations; n=46 eyes). The number of FU (mean ± SD; median [CI95]) was significantly higher in group C (10.9±4.6; 11[9-12]) than in group D (7.2±4.5; 7[6;8]), (non-parametric Wilcoxon’s test: p<0.0001). The number of IVI visits (mean ± SD; median [Q1-Q3]) was also significantly higher in group C (10.9±4.6; 11[9-12]) than in group D (7.2±4.5; 7[6;8]), (nonparametric Wilcoxon’s test: p=0.0006). Even if the initial ETDRS score was higher in group C (with AMD-dedicated consultations), without any statistical significance, this score became significantly higher at 4 Months and 12 Months in this group (Figure 3). A monitoring based on AMD-dedicated consultations induced significantly higher ETDRS mean scores at 4 months (p=0.0023), 6 Months (p=0.0383), 8 Months (p=0.0393) and 12 months (p=0.0061), compared to a monitoring with routine usual consultations (Figure 3).
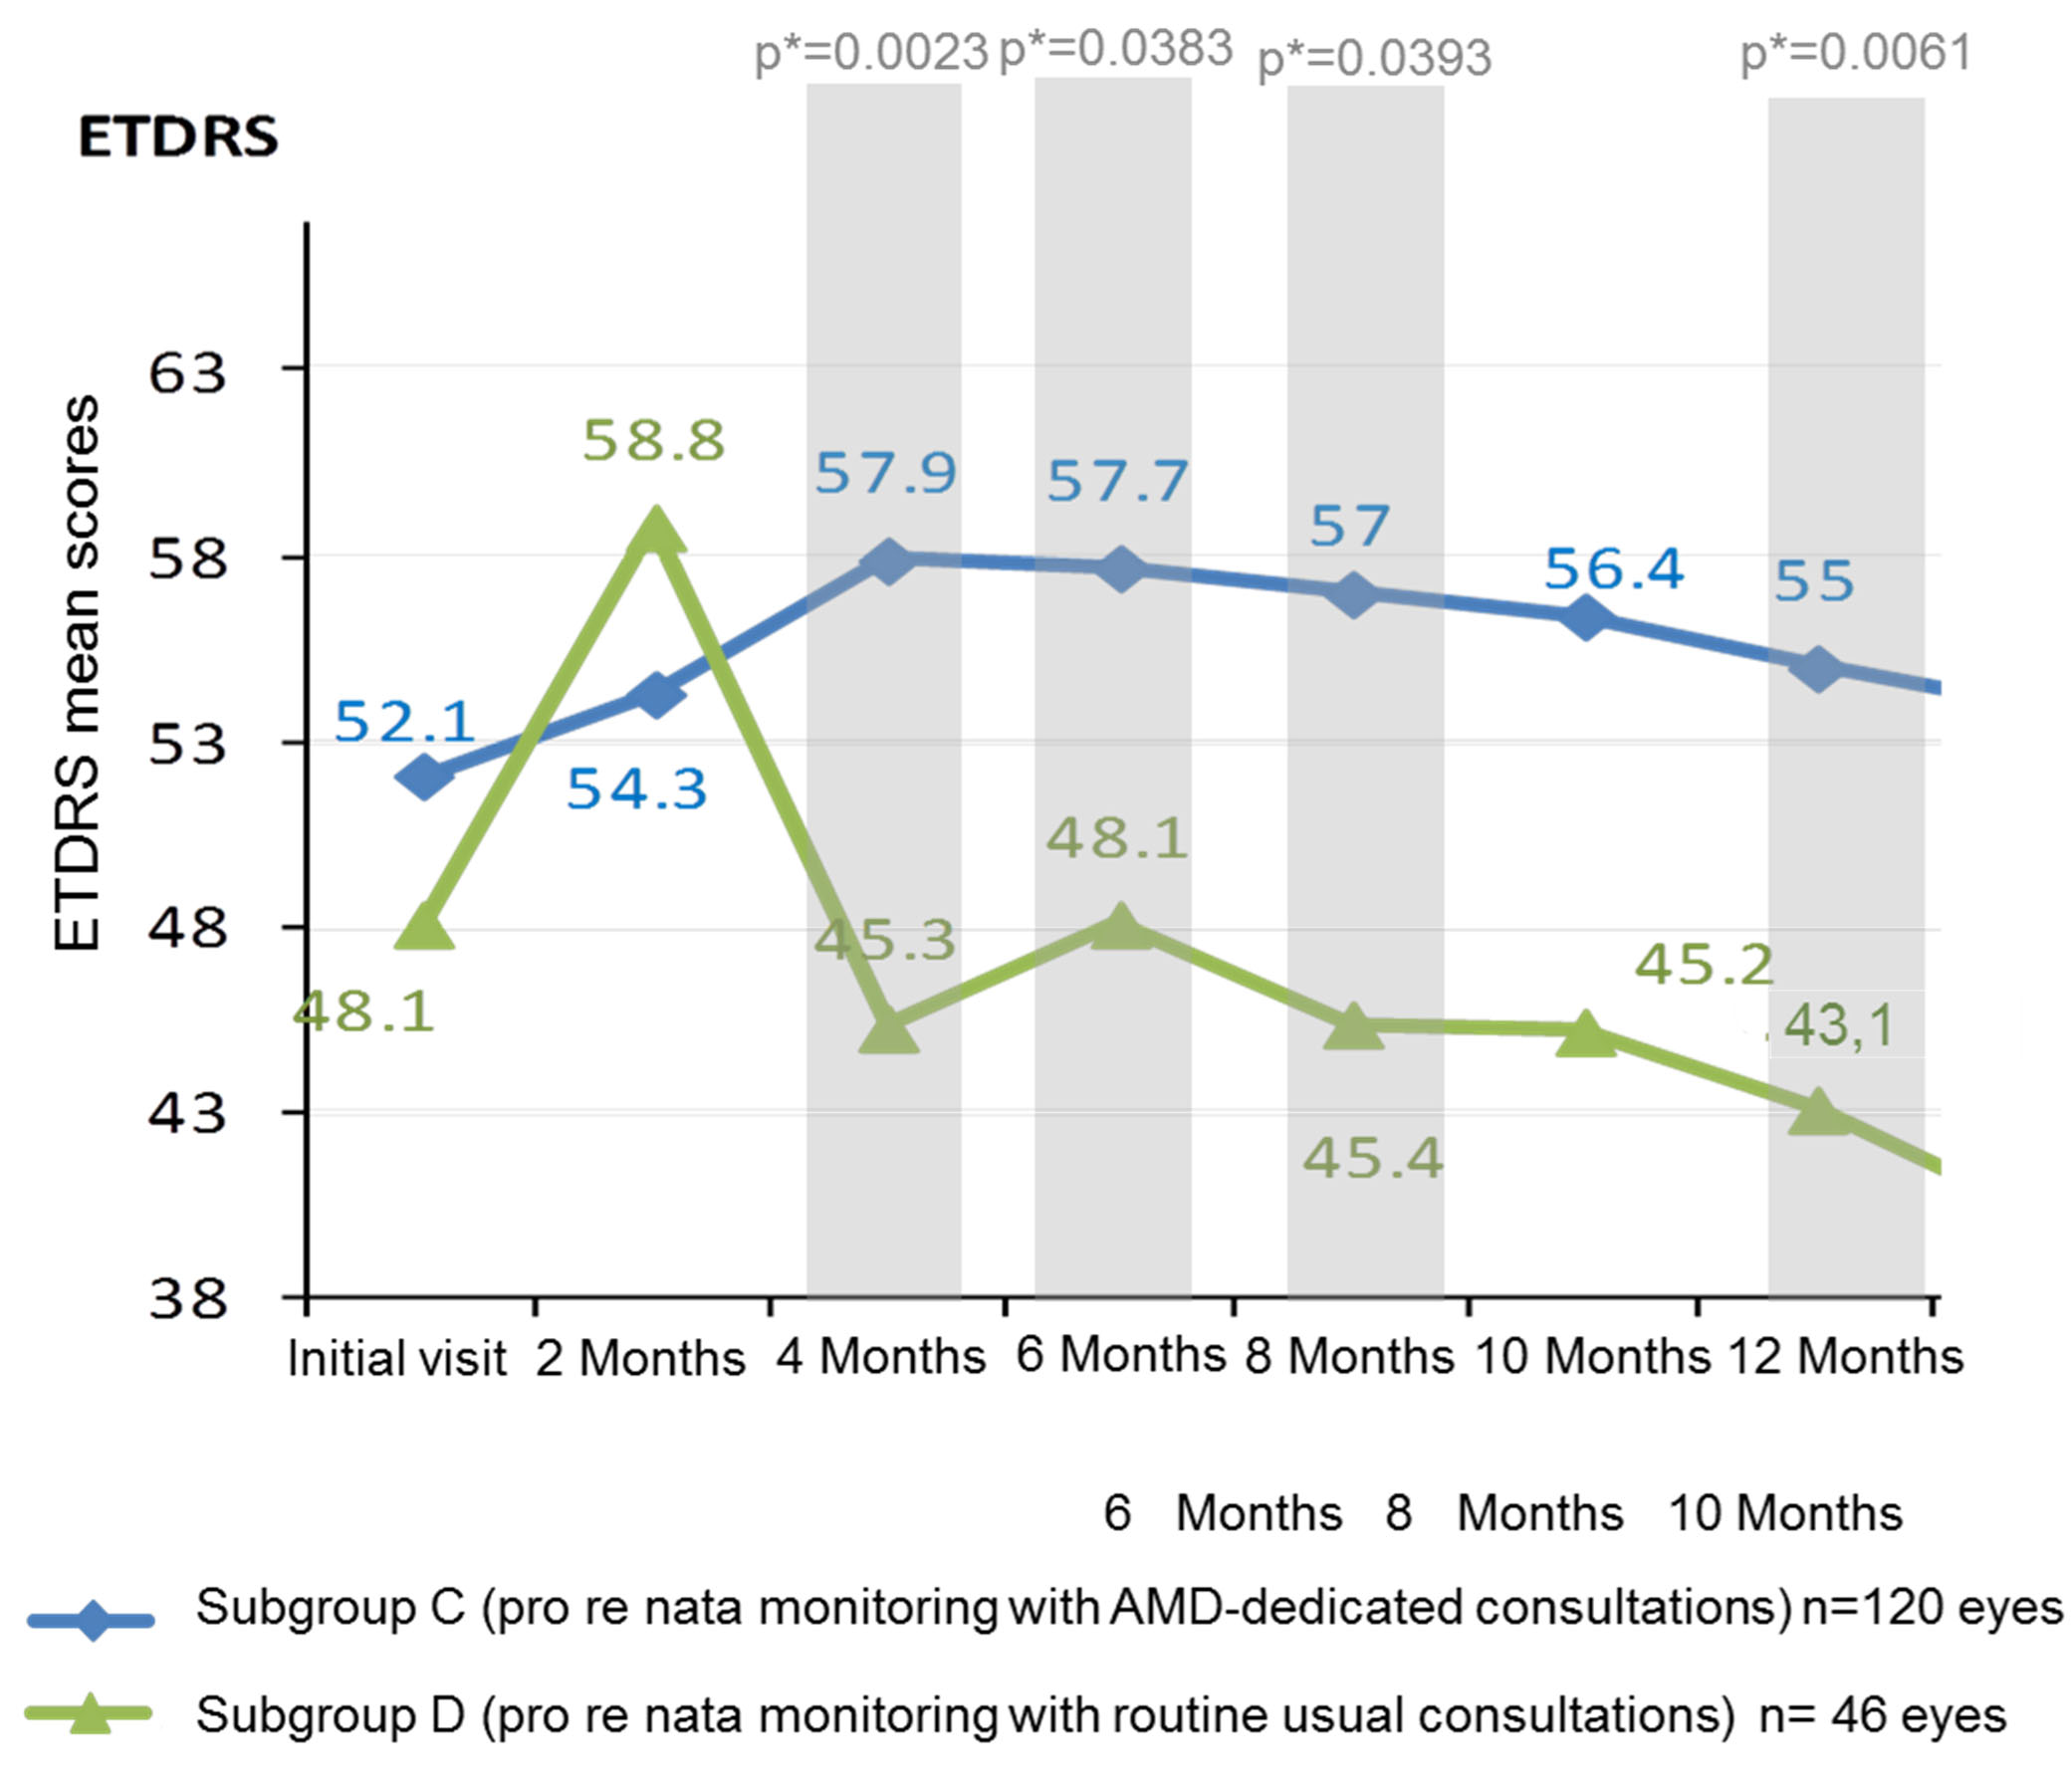
Figure 3. ETDRS mean scores in subgroups based on monitoring schemes over 12 months (144 patients; 165 eyes).
AMD: Age-related macular degeneration
Predictive factors for VA change
One factor was highlighted in the univariate analyses as an independent predictor for changes in VA: the induction phase. In fact, patients who received an induction therapy (group A) had a 3.5 times decreased chance of benefitting from VA gain (odds ratio (OR) 0.282 [0.117; 0.683]; p=0.0050).
In the multivariate analyses, patients with hypertension had a VA decrease risk factor of 2 (OR 0.489 [0.216; 1.104]).
5-year results
On August 2016, a sub-population of 109 patients (131 eyes) was selected for a complementary 5-year analysis based on VA, FU and IVI visit numbers. The studied population had a usual female prevalence (64%) and a mean age of 78.4 ± 7.7 years (table 3).
Table 3. Patients characteristics in the 5-year analysis (n=109).
Patients characteristics (N=109) |
Age (years) |
|
Mean ± SD |
78.4±7.7 |
Median [CI95%] |
78.8 [77.0-81.5] (73.5-84.2) |
Gender |
|
Women, N (%) |
70 (64%) |
Men, N (%) |
39 (36%) |
Arterial hypertension, N (%) |
61 (56%) |
Dyslipidemia, N (%) |
38 (35%) |
Heart failure – N(%) |
11 (10%) |
Hypothyroidism, N (%) |
15 (14%) |
Hyperthyroidism, N (%) |
2 (2%) |
Tobacco use, N (%) |
6 (6%) |
Diabetes, N (%) |
22 (20%) |
Myocardial infarction, N (%) |
3 (3%) |
Stroke, N (%) |
4 (4%) |
VA analysis
VA was significantly increased at 6 months, with a mean ETDRS improvement of 4.2 ± 15.2 letters (p = 0.0288) compared to baseline. After 6 months, VA declined until the end of the follow-up without any statistical significance compared to baseline (Table 4).
Table 4. Visual acuity (VA) evolution over 5 years.
VA Evolution from baseline |
[M6 VA –
Baseline VA] |
[M12 VA –
Baseline VA] |
[M12 VA –
Baseline VA] |
[M24 VA –
Baseline VA] |
[M30 VA –
Baseline VA] |
ETDRS |
(n=66) |
(n=66) |
(n=32) |
(n=19) |
(n=34) |
Mean±Sd |
+4.2±15.2 |
+2.8±16.4 |
-2.8±19.7 |
-3.26±25.7 |
-2.65±20.0 |
Med[Q1 ;Q3] |
4.5 [-4 ;11] |
2.5 [-7 ;11] |
2.5 [-12 ;7] |
3 [-4 ;8] |
1.0 [-14 ;13] |
P(Wilcoxon) |
0.0288 |
0.2445 |
0.9680 |
0.8145 |
0.4461* |
SNELLEN |
(n=80) |
(n=74) |
(n=38) |
(n=19) |
(n=29) |
Mean±Sd |
0.09±0.25 |
0.05±0.22 |
0.05±0.26 |
0.08±0.28 |
-0.01±0.30 |
Med[Q1 ;Q3] |
0.06 [-0.04;0.19] |
0 [-0.10;0.17] |
0 [-0.12;0.13] |
0.1 [-0.04;0.17] |
0 [-0.18;0.15] |
P(Wilcoxon) |
0.0059 |
0.1162 |
0.4583 |
0.2101 |
0.9269 |
VA Evolution from baseline |
[M36 VA –
Baseline VA] |
[M42 VA –
Baseline VA] |
[M48 VA –
Baseline VA] |
[M45 VA –
Baseline VA] |
[M60 VA –
Baseline VA] |
ETDRS |
(n=25) |
(n=25) |
(n=24) |
(n=12) |
(n=10) |
Mean±Sd |
-8.0±21.7 |
-6.0±25.0 |
-4.6±27.8 |
+0.75±18.0 |
-6.1±32.4 |
Med [Q1 ;Q3] |
0 [-27 ;7] |
-8 [-24 ;13] |
1.5 [-20 ;16] |
8 [-17 ;14] |
10.5 [-30 ;17] |
P(Wilcoxon) |
0.0763* |
0.2019* |
0.8388 |
0.9492 |
0.7539 |
| |
|
|
|
|
|
SNELLEN |
(n=26) |
(n=29) |
(n=24) |
(n=15) |
(n=11) |
Mean±Sd |
-0.06±0.28 |
0.04±0.32 |
0.02±0.31 |
0.19±0.37 |
0.12±0.31 |
Med[Q1 ;Q3] |
-0.09 [-0.25;0.10] |
-0.04 [-0.22;0.25] |
0 [-0.24;0.17] |
0.2 [-0.12;0.4] |
0.2 [-0.18;0.30] |
P(Wilcoxon) |
0.2882 |
0.8506 |
0.9875 |
0.0781 |
0.2215 |
Med : Median ; Sd : Standard deviation, VA: Visual Acuity
* Student's t-test
Moreover, when comparing the VA score between two consecutive FU, no significant VA evolution was identified (Table 5).
Table 5. Evolution of visual acuity (measured by ETDRS and SNELLEN) between each follow-up.
Visual Acuity |
M6
Vs M12 |
M12
vs
M18 |
M18
Vs M24 |
M24
Vs M30 |
M30
Vs M36 |
M36
Vs M42 |
M42
Vs M48 |
M48
Vs M54 |
M54
Vs M60 |
by ETDRS
P (Wilcoxon) |
0.3842 |
0.7987 |
0.5791 |
0.6851 |
0.6418 |
0.6719 |
0.8420 |
0.3549 |
0.5646 |
by SNELLEN
P (Wilcoxon) |
0.2889 |
0.8114 |
0.3523 |
0.3164 |
0.7280 |
0.7491 |
0.7702 |
0.2147 |
0.3309 |
Number of FU and IVI visits
The mean number of FU and IV constantly decreased from years to years all along the the study period. This decrease was significant between 12 and 24 months, and between 48 and 60 months (Table 6).
Table 6. Number of follow-up and injection visits per year, compared to the previous year.
| |
M12 vs baseline |
M24 vs M12 |
M36 vs M24 |
M48 vs M36 |
M60 vs M 48 |
Follow-up visits (n) |
|
|
|
|
|
Mean±Sd |
7.7±3.4 |
5.9±4.2 |
3.9±6.0 |
3.8±3.7 |
2.1±3.2 |
ANOVA P (Tukey) |
N/A |
<0.05 |
<0.05 |
NS |
<0.05 |
Wilcoxon P |
N/A |
0.0002 |
0.0797 |
0.0874 |
<0.0001 |
Injection visits (n) |
|
|
|
|
|
Mean±Sd |
4.9±2.7 |
2.3±2.6 |
2.3±2.8 |
1.7±2.4 |
1.0±2.1 |
ANOVA P (Tukey) |
N/A |
<0.05 |
NS |
NS |
<0.05 |
Wilcoxon P |
N/A |
<0.0001 |
0.7368 |
0.1070 |
0.0166 |
Sd : Standard deviation
Complications
No serious adverse events or any complications related to ranibizumab IVI were observed during the follow-up.
Discussion
Two-year analysis
When comparing our study with previous reference studies ANCHOR, MARINA, LUMIERE, PIER, SISTAIN and PRONTO (Table 7) [4-6,26-29], we could consider that the monitoring of patients in our structure was satisfactory. The number of FU and IVI visits seemed adapted to the conditions of real life when performed during specific consultations dedicated to AMD.
Table 7. Elouan main results at 12 months versus other studies.
Name & design
of the study |
3-month induction protocol |
Post-induction retreatment protocol
based on: |
Patients
(n) |
12M-VA Change
in letters (mean) |
12-M VA Loss ≤ 15 letters,
(%) |
12-M VA Gain ≥ 15 letters,
(%) |
12-M IVI number
(mean) |
12-M
FU number
(mean) |
ELOUAN (2015)
ELOUAN (2015)
24-month, retrospective, descriptive OUAN (2015)
24-month, retrospective, descriptive th, retrospective, descriptive |
Yes
28%
28% |
examin examination results
ation results |
144144 |
1.91.933 |
v8686 |
3636 |
666 |
9.059.05 |
LUMIERE (2013)
12-month, retrospective, descriptive, |
Yes
<40% |
examination results |
551 |
3.2 |
90.2 |
19.6 |
5.1 |
8.6 |
SUSTAIN (2011)
12-month,
prospective open-label,
single-arm |
Yes |
OCT
findings |
513 |
3.6 |
92.5 |
19.3 |
5.6 |
12 |
ANCHOR (2009)
24-month, prospective, randomized,
double-masked |
Yes |
sham controlled |
280 |
11.3 |
96.4 |
40.3 |
12 |
12 |
PRONTO (2009)
2-year, prospective, uncontrolled, variable-dosing |
Yes |
OCT
findings |
40 |
9.3 |
95 |
35 |
5.6 |
12 |
PIER (2008 -2010)
24-month, prospective, randomized |
Yes |
sham controlled |
121 |
-0.2 |
90.2 |
13.1 |
6 |
8 |
MARINA (2007)
24-month, prospective, randomized,
double-masked |
Yes |
versus PDT |
478 |
7.2 |
2021 Copyright OAT. All rights reserv
94.6 |
33.8 |
12 |
12 |
FU: follow-up, IVI: intravitreal injection; OCT: optical coherence tomography; PDT: photodynamic therapy; VA: visual acuity
Our 12-month results in terms of VA evolution were not as good as the pivotal studies of MARINA[5], and ANCHOR[4,6] where patients underwent systematic monthly ranibizumab IVI. Treatment recommendations in France [26] advice carrying out a systematic induction treatment with monthly injections for the first 3 months, and to then schedule monthly FU. Re-treatment is performed only in cases of VA decrease or if there are signs of resumption of NV activity (by the fundus or OCT). These recommendations can probably explain the differences in terms of VA evolution between these pivotal studies and our study. Moreover, this calls into question whether our retreatment criteria were probably insufficient.
Our retreatment criteria were entirely based on conventional parameters: visual loss or persistence in the fundus of a subretinal hemorrhage, criteria for a change in subretinal NV by OCT (sub- or intra-retinal edema), NV thickening, PED persistence, and an increase in central retinal thickness). In patients with AMD-dedicated consultations, for the first 12 months, the mean number of FU visits was 10.9±4.6, for 7.6±6.2 mean number of IVI visits. These values, especially for IVI visits, were higher compared to other studies (except for the pivotal trials). Despite this, VA improvement in our study remained inferior compared to the pivotal studies. This further illustrates that our retreatment criteria were insufficient, and that a PRN FU with AMD-dedicated consultations was decisive during the first year after disease onset.
On the other hand, no practitioners in our department perform systematic induction therapy, because from baseline and during induction phase, all patients have monthly FU and each new injection is discussed again with regards to VA evolution, clinical or para-clinical signs. The induction phase is not considered as necessary for all patients. Our results showed that there was no deleterious effect on patients who did not have a systematic induction phase, whereas univariate analysis showed that patients with an induction phase had less chance of VA gain. This is probably because patients in without an induction phase (group B) had less active NV at the initial stage, thus inducing an earlier diagnosis. Treatment was more effective and worked faster. However, we can conclude, conversely, that systematic monthly treatment for the first 3 months was not always necessary, and that only a monthly FU during the induction phase help identify these patients.
Patients requiring monthly treatment within the first 6 months to stabilize VA can be considered as "partial responders". For these patients, the number of FU visits could be spaced out to every two months, while maintaining a monthly injection rate. This should improve patients’ quality of life by reducing the number of visits, while maintaining satisfactory FU. Treatment compliance would probably be better, with reduced therapeutic escape.
Our results also confirmed that the evolution of VA was highly dependent on monitoring scheme. In patients with conventional non-AMD specific consultations, patient FU were more spaced out, inducing, during the first year, a significantly lower number of IVI compared to patients with AMD-dedicated consultations. The results were less satisfactory, especially if we consider that any visual loss may be permanent in this disease [27]. These results were obtained despite facilitated access to care for these patients, and fast retreatment after a FU and a diagnosis of recurrence.
Self-monitoring by the patient, based on subjective criteria, cannot be considered as reliable to diagnose CNV recurrence. Although these subjective criteria are important, they are sometimes the only indication for retreatment, but are only helpful between FU visits for patients’ monitoring. More objective criteria could be used to study the patient's VA measurements at home [30]. Some studies on "telemedicine" monitoring [31,32] also showed satisfactory results, with good patient compliance to FU and treatments.
It also appears that the period between the 12th and 18th month is a corner-stone in the evolution of this disease. After stabilization, VA progressively decreased. We identified this parameter in our study with a significant lower percentage of patients having a gain in VA at 18 months compared to 12 months. Many hypotheses can been advanced for this: aggravation of untreated cataracts due to the persistence of subretinal neovascularization, spacing out of FU and treatments, or onset of chorioretinal atrophy with photoreceptor alterations (related to the disease evolution) [33] or to an iatrogenic effect by chronic blockage of VEGF, whose role is well known in angiogenesis [34]. Studies and analyses are necessary to further understand and analyze these elements, using, for example, auto-fluorescent images to assess the evolution of atrophy, instead of colored photographs as in the HARBOR study [14].
Five-year analysis
Despite a significant decrease of FU and IVI visit number over 5 years, we observed a non-significant moderate decrease of AV, rather considered as stabilization.
Real-life monitoring helps to stabilize patients' vision [2,22,23] for 5 years, where the natural evolution of the disease is very pejorative and may lead to legal blindness.
This long-term result are in favor of the necessity to maintain regular monitoring and treatment of patients over time.
The results of the pivotal studies suggest that overtreatment of patients could lead to early atrophy, limiting functional outcome in these patients in the medium term [8]. Conversely, it would seem that an undertreatment of patients over time, also leads to a loss of therapeutic efficacy.
The main limitation lies in the heterogeneity and the small size of the subgroups difficult to control in retrospective real-life study.
Further studies evaluating other factors (anatomical factor) as good predictors of VA evolution should be conducted; these factors have only studied as secondary objectives.
Conclusion
The ELOUAN study results pointed out some relevant implications for clinical practice as the usefulness of monthly FU and AMD-dedicated consultations especially during the first year of the treatment.
In this study, performing systematic induction phase did not offer better prognosis. Five-year results are in favor of AV stabilization.
To obtain satisfactory results over time, regular controls and treatments seemed necessary to stabilize VA over time. Patients’ visits should be carried out in specialized centers where adapted AMD consultations can be implemented at least for the first year of treatment. The monitoring should be adapted to each patient in order to avoid any over or under treatment often deleterious in both cases.
Finally, ranibizumab IVI can be considered as a reliable treatment for exudative AMD in real life, leading to AV stabilization even in the long term (5 years).
Acknowledgements
We thank the patients and the nurses for their important contributions, Terri Galli for the English review of this article.
Declaration of interest
The authors report no conflicts of interest. The authors alone are responsible for the content and writing of the paper.
Funding
This study was funded by an independent scientific grant to Saint Joseph Hospital supported by Novartis Pharma France SAS.
References
- Rein DB, Wittenborn JS, Zhang X, Honeycutt AA, Lesesne SB, et al. (2009) Forecasting age-related macular degeneration through the year 2050: the potential impact of new treatments. Arch Ophthalmol 127: 533-540. [Crossref]
- Wong TY, Chakravarthy U, Klein R, Mitchell P, Zlateva G, et al. (2008) The natural history and prognosis of neovascular age-related macular degeneration: a systematic review of the literature and meta-analysis. Ophthalmology115: 116-126. [Crossref]
- Lopez PF, Sippy BD, Lambert HM, Thach AB, Hinton DR (1996) Transdifferentiated retinal pigment epithelial cells are immunoreactive for vascular endothelial growth factor in surgically excised age-related macular degeneration-related choroidal neovascular membranes. Invest Ophthalmol Vis Sci 37: 855–868. [Crossref]
- Brown DM, Michels M, Kaiser PK, Heier JS, Ianchulev T, et al. (2009) Ranibizumab versus verteporfin photodynamic therapy for neovascular age-related macular degeneration: Two-year results of the ANCHOR study. Ophthalmology 116:157–65. e5. [Crossref]
- Rosenfeld PJ, Brown DM, Heier JS, Boyer DS, Kaiser PK, et al. (2006) Ranibizumab for neovascular age-related macular degeneration. N Engl J Med 355: 1419-1431. [Crossref]
- Brown DM, Kaiser PK, Michels M, Soubrane G, Heier JS, et al. (2006) Ranibizumab versus verteporfin for neovascular age-related macular degeneration. N Engl J Med 355: 1432-1444. [Crossref]
- CATT Research Group, Martin DF, Maguire MG, Ying GS, Grunwald JE, et al. (2011) Ranibizumab and bevacizumab for neovascular age-related macular degeneration. N Engl J Med 364: 1897-1908. [Crossref]
- Comparison of Age-related Macular Degeneration Treatments Trials (CATT) Research Group, Martin DF, Maguire MG, Fine SL, Ying GS, et al. (2012) Ranibizumab and bevacizumab for treatment of neovascular age-related macular degeneration: two-year results. Ophthalmology 119: 1388-1398. [Crossref]
- IVAN Study Investigators1, Chakravarthy U, Harding SP, Rogers CA, Downes SM, et al. (2012) Ranibizumab versus bevacizumab to treat neovascular age-related macular degeneration: one-year findings from the IVAN randomized trial. Ophthalmology 119: 1399-1411. [Crossref]
- Heier JS, Brown DM, Chong V, Korobelnik JF, Kaiser PK, et al. (2012) Intravitreal aflibercept (VEGF trap-eye) in wet age-related macular degeneration. Ophthalmology 119: 2537-2548. [Crossref]
- Chakravarthy U, Harding SP, Rogers CA, Downes SM, Lotery AJ, et al. (2013) Alternative treatments to inhibit VEGF in age-related choroidal neovascularisation: 2-year findings of the IVAN randomised controlled trial. Lancet Lond Engl 382: 1258-1267. [Crossref]
- Scott AW, Bressler SB (2013) Long-term follow-up of vascular endothelial growth factor inhibitor therapy for neovascular age-related macular degeneration. Curr Opin Ophthalmol 24: 190-196. [Crossref]
- Schmidt-Erfurth U, Kaiser PK, Korobelnik J-F, Brown DM, Chong V, et al. (2014) Intravitreal aflibercept injection for neovascular age-related macular degeneration: ninety-six-week results of the VIEW studies. Ophthalmology 121: 193–201. [Crossref]
- Busbee BG, Ho AC, Brown DM, Heier JS, Suñer IJ, et al. (2013) Twelve-month efficacy and safety of 0.5 mg or 2.0 mg ranibizumab in patients with subfoveal neovascular age-related macular degeneration. Ophthalmology 120: 1046-1056. [Crossref]
- Heier JS, Brown DM, Chong V, Korobelnik JF, Kaiser PK, et al. (2012) Intravitreal aflibercept (VEGF trap-eye) in wet age-related macular degeneration. Ophthalmology 119: 2537-2548. [Crossref]
- Rosenfeld PJ, Brown DM, Heier JS, Boyer DS, Kaiser PK, et al. (2006) Ranibizumab for neovascular age-related macular degeneration. N Engl J Med 355: 1419-1431. [Crossref]
- Ferreira A, Sagkriotis A, Olson M, Lu J, Makin C, Milnes F (2015) Treatment Frequency and Dosing Interval of Ranibizumab and Aflibercept for Neovascular Age-Related Macular Degeneration in Routine Clinical Practice in the USA. PLOS ONE 10: e0133968. [Crossref]
- Holekamp NM, Liu Y, Yeh WS, Chia Y, Kiss S, et al. (2014) Clinical utilization of anti-VEGF agents and disease monitoring in neovascular age-related macular degeneration. Am J Ophthalmol 157: 825-833. [Crossref]
- Johnston SS, Wilson K, Huang A, Smith D, Varker H, et al. (2013) Retrospective Analysis of First-Line Anti-Vascular Endothelial Growth Factor Treatment Patterns in Wet Age-Related Macular Degeneration. Adv Ther 30: 1111–1127. [Crossref]
- Singer MA, Awh CC, Sadda S, Freeman WR, Antoszyk AN, et al. (2012) HORIZON: an open-label extension trial of ranibizumab for choroidal neovascularization secondary to age-related macular degeneration. Ophthalmology 119: 1175-1183. [Crossref]
- Rofagha S, Bhisitkul RB, Boyer DS, Sadda SR, Zhang K, et al. (2013) Seven-year outcomes in ranibizumab-treated patients in ANCHOR, MARINA, and HORIZON: a multicenter cohort study (SEVEN-UP) Ophthalmology 120: 2292-2299. [Crossref]
- Peden MC, Suñer IJ, Hammer ME, Grizzard WS (2015) Long-Term Outcomes in Eyes Receiving Fixed-Interval Dosing of Anti–Vascular Endothelial Growth Factor Agents for Wet Age-Related Macular Degeneration. Ophthalmology 122: 803-808. [Crossref]
- Holz FG, Bandello F, Gillies M, Mitchell P, Osborne A, et al. (2013) Safety of ranibizumab in routine clinical practice: 1-year retrospective pooled analysis of four European neovascular AMD registries within the LUMINOUS programme. Br J Ophthalmol 97: 1161-1167. [Crossref]
- Lotery A, Griner R, Ferreira A, Milnes F, et al. (2017) Real-world visual acuity outcomes between ranibizumab and aflibercept in treatment of neovascular AMD in a large US data set. Eye (Lond) 31: 1697-1706. [Crossref]
- Gregori NZ, Feuer W, Rosenfeld PJ (2010) Novel method for analyzing snellen visual acuity measurements. Retina 30: 1046-1050. [Crossref]
- Cohen SY, Mimoun G, Oubraham H, Zourdani A, Malbrel C, et al. (2013) Changes in visual acuity in patients with wet age-related macular degeneration treated with intravitreal ranibizumab in daily clinical practice: the LUMIERE study. Retina Phila Pa 33: 474-481. [Crossref]
- Brown DM, Tuomi L, Shapiro H, Pier Study Group (2013) Anatomical measures as predictors of visual outcomes in ranibizumab-treated eyes with neovascular age-related macular degeneration. Retina Phila Pa 33: 23-34. [Crossref]
- Holz FG, Amoaku W, Donate J, Guymer RH, Kellner U, et al. (2011) Safety and efficacy of a flexible dosing regimen of ranibizumab in neovascular age-related macular degeneration: the SUSTAIN study. Ophthalmology 118: 663–671. [Crossref]
- Lalwani GA, Rosenfeld PJ, Fung AE, Dubovy SR, Michels S, et al. (2009) A variable-dosing regimen with intravitreal ranibizumab for neovascular age-related macular degeneration: year 2 of the PrONTO Study. Am J Ophthalmol 148: 43–58. e1. [Crossref]
- Wang L-L, Liu W-J, Liu H-Y, Xu X (2015) Single-site Baseline and Short-term Outcomes of Clinical Characteristics and Life Quality Evaluation of Chinese Wet Age-related Macular Degeneration Patients in Routine Clinical Practice. Chin Med J (Engl) 128: 1154–1159. [Crossref]
- Loewenstein A, Ferencz JR, Lang Y, Yeshurun I, Pollack A, et al. (2010) Toward earlier detection of choroidal neovascularization secondary to age-related macular degeneration: multicenter evaluation of a preferential hyperacuity perimeter designed as a home device. Retina Phila Pa 30: 1058–1064. [Crossref]
- Li B, Powell A-M, Hooper PL, Sheidow TG (2015) Prospective evaluation of teleophthalmology in screening and recurrence monitoring of neovascular age-related macular degeneration: a randomized clinical trial. JAMA Ophthalmol 133: 276–282. [Crossref]
- Bhutto I, Lutty G (2012) Understanding age-related macular degeneration (AMD): relationships between the photoreceptor/retinal pigment epithelium/Bruch’s membrane/choriocapillaris complex. Mol Aspects Med 33: 295–317. [Crossref]
- Ferrara N, Gerber HP (2001) The role of vascular endothelial growth factor in angiogenesis. Acta Haematol 106: 148-156. [Crossref]