Purpose: Current cancer registry data cannot distinguish a justified cancer of unknown primary (CUP) diagnosis, where the patient received a complete diagnostic evaluation that was unable to identify the primary tumor, from potentially misclassified patients, documented as CUP but not based on a complete diagnostic evaluation. This misclassification may skew population-based cancer registry surveillance research used to frame and guide translational CUP research. We identified characteristics of patients who received justified vs. potentially misclassified CUP diagnoses in cancer registry data.
Methods: We developed a conceptual definition of a complete diagnostic evaluation from professional society-recommended guidelines. We translated this definition into procedure codes in the Medicare encounter data. We assessed age, gender, comorbidities, urban or rural residence, income, race, and tumor pathology by receipt of a complete diagnostic evaluation and palliative therapy among 10,575 elderly CUP patients in the Surveillance, Epidemiology, and End Results (SEER)-Medicare dataset. We calculated odds ratios and adjusted probabilities using marginal standardization.
Results: Only 35% of elderly CUP patients identified in the cancer registry received a complete diagnostic evaluation. After adjustment for age and comorbidities, socioeconomic barriers to a complete diagnostic evaluation persisted: adjusted odds ratio and 95% confidence interval (AOR) for rural vs. urban 0.8(0.8,0.9) and for highest income vs. lowest income 1.2(1.1,1.4). Patients with vague or undocumented tumor pathology in SEER had 80% lower odds of receiving a complete diagnostic evaluation AOR(95%CI)=0.2(0.2,0.2). Although patients with a complete diagnostic evaluation were twice as likely to receive palliative therapy than those without a complete evaluation, AOR(95%CI)=2.0(1.7,2.3), they only had a 46.7% probability of receiving therapy, 95%CI=(44.4,49.1).
Conclusion: Patients without a complete diagnostic evaluation are not limited to the frail and underserved. For accurate assessment of the CUP burden and disparities in utilization of diagnostic care, we recommend that the SEER definition of CUP include the extent of diagnostic inquiry.
clinical guidelines, disparities, SEER-Medicare, procedures, methodology
The global availability of cancer registry data has enriched our understanding of cancer epidemiology, risks, and survival [1]. We rely on high-quality data for decision-making. However, cancer of unknown primary (CUP) presents challenges to cancer surveillance because CUP is a diagnosis of exclusion.
CUP is a metastatic cancer where diagnostic tests fail to identify the primary tumor [2,3]. The primary site may have disappeared before diagnosis or is undetectable with current technology. Since the primary site is unknown among CUP patients, oncologists use methods like tumor pathology, histology, and grade to direct palliative treatment decisions [2,3]. Palliative treatment can reduce symptoms, prolong survival, and improve quality-of-life among CUP patients.
The CUP definition relies on an unsuccessful, but complete diagnostic search for the primary tumor. Some patients may receive a CUP diagnosis not because the primary tumor cannot be found, but because contraindications, socioeconomic disparities, or technical limitations limit a thorough search for the primary tumor. Invasive diagnostic tests, like a biopsy, may be contraindicated for patients with advanced age, multiple comorbidities, or close to death. Up to 30% of tissue samples are inadequate for pathologist evaluation [4,5]. Socioeconomic barriers to repeat biopsies, such as long distances to care and financial constraints, can all lead to an incomplete diagnostic evaluation. Research has indicated physician use of diagnostic evaluation may be hindered due to uncompelling or lack of effectiveness research for diagnostic methods [6].
The only assessment of CUP diagnostic evaluation we could identify was a medical records review in France and Canada that reported only 23% of CUP patients received guideline-recommended diagnostic evaluations [7].
Cancer registries, a major source of cancer research and surveillance, do not currently document the extent of the diagnostic evaluation. Registry-based surveillance defines CUP with diagnosis terms found in the medical record, but without regard to the extent of the diagnostic inquiry or procedures conducted [8,9]. Thus, population-based CUP studies potentially include misclassified patients, for whom an extensive search for the primary tumor was not conducted. We describe and evaluate a CUP diagnosis using the extent of diagnostic evaluation to differentiate patients with a justified CUP diagnosis from potentially misclassified CUP diagnoses.
Study population
This report identified CUP patients using the US Surveillance, Epidemiology and End Results (SEER) 2005-2009 population-based cancer registry. We began by identifying the final cancer diagnosis a patient received using ICD-O-2 code C80.9. Patients had follow-up until death or a minimum of two years ensuring CUP was the final diagnosis in the cancer registry; SEER follow-up is at least 95% complete [8]. We excluded patients diagnosed on a death certificate, at autopsy, or in a nursing home because the diagnostic evaluation was likely dissimilar to other patients.
We linked SEER cancer patients to Medicare insurance encounter data [9]. We only included patients continuously enrolled in Medicare fee-for-service to capture all diagnostic tests and treatments given to the patient. Age-eligible Medicare patients were examined at least one year before the cancer diagnosis; thus, participants were 66 and older. We only used paid Medicare claims to exclude erroneous or unjustified billing codes. Moreover, SEER-Medicare records are only complete for fee-for-service patients; thus, managed care participants were excluded.
We identified 10,575-CUP patients who met our inclusion/exclusion criteria in SEER and Medicare. We examined two subsets of this cohort. First, we examined patients who survived at least three months, so they would have time to receive all of the guideline-recommended diagnostic tests (N=6,068). Second, to examine the impact of diagnostic evaluation on the receipt of treatment, we limited the cohort to those diagnosed in 2007 or later when prescription drug files became available to researchers (N=3,428).
Patient characteristics
Multiple sources help SEER cancer registrars document patient and tumor information. Cancer registrars, staff who collect cancer registry data, use a systematic and reproducible algorithm to document tumor information. The sources include hospitals, outpatient clinics, radiology departments, doctors' offices, laboratories, surgical centers, and death records [8]. From SEER registry data, we assessed gender, age in three groups (66-74, 75-84, 85 and older), and race-ethnicity in mutually exclusive groups (White, Black, Latino, and Other). From SEER linked to census data, we assessed median annual income as a proxy for patient income ranked into three groups (high, medium and low) and population density of residence (rural vs. urban).
SEER registry data include tumor pathology, specifically histology and grade (tumor cell differentiation). We classified CUP into standard mutually exclusive classifications: adenocarcinoma, squamous cell carcinomas, carcinomas with neuroendocrine differentiation, poorly differentiated carcinomas, and undifferentiated neoplasms [3]. Since this study examines the diagnostic evaluation of CUP patients, we included a sixth category suggestive of an incomplete diagnostic evaluation. This sixth category included unspecified or vague histology suggesting the biopsy sample was inadequate and not re-biopsied. The sixth category also included patients where the tumor grade was missing from the medical record. Table 1 documents histology codes. Comorbidity was determined using the Klabunde adaptation of the Charlson score from inpatient hospital, physician, and outpatient Medicare data [10].
Table 1. Tumor histology codes and HCPCSa, ICD-9a, and CPTa codes for diagnostic procedures assessed for cancer of unknown primary according to clinical guidelines
Label |
Codes |
Adenocarcinoma [3] |
8140-8239, 8241-8245, 8247,8248, 8350-8389 |
Squamous Cell Carcinomas [3] |
8050-8089 |
Neuroendocrine Carcinoma [3] |
8240, 8246, 8249 |
Unspecified or Vague Tumor Histology [3] |
8000-8010 |
Diagnostic Procedure: E/M Level 5 [35] |
99205, 99215, 99235, 99245, 9925, 5285, 33345, 99305, 99355, 99357 |
Labs (Complete Blood Count, Urinalysis, and Comprehensive Metabolic Panel) [35] |
85025 ,80053,83615, 83625 |
Computed Tomography Scans of Chest, Abdomen, and Pelvis OR Positron Emission Tomography scan [36] |
CT: 70192-70194, 74150-74178, 71260-71270 PET: 78811-16, 74177,71260,70450,78816 G0219, G0235,G0252 |
Immunohistochemistry [35] |
88342, D0478, 88360, 88361, G0461, G0462 |
Molecular/Genetic Studies [35] |
83890-83914, 88363-88366, G9143, S3800, S3818-S3890 |
NICE Codes for Cancers of Unknown Origin [14] |
C26, C39, C76, C77, C78, C70, C80 |
Radiation Codes [37] |
ICD: 92.2X, 92.3, 92.30-92.39, 92.4, 92.41, V58.0, V66.1, V67.1.
HCPCS: 51720, 77401-77499, 77520, 77523, 77750-77799, J9X, Q0083 Q0084, Q0085 |
Chemotherapy Administration Codes [37] |
ICD: V581, V662, V672.
HCPCS: 9925, 96400-96499, G0256, G0261. Revenue Center: 0330, 0333. |
aHealthcare Common Procedure Coding System codes (HCPCS), International Classification of Diseases (ICD-9), and the American Medical Association Physicians’ Current Procedural Terminology (CPT)
Guideline recommended-diagnostic evaluation
The clinical definition of CUP is the absence of an identifiable primary tumor despite a diagnostic evaluation. Kok, et al. compared professional society guidelines and identified consistently recommended diagnostic tests amongst these societies. These societies included the National Comprehensive Cancer Network (NCCN), the European Society for Medical Oncology (ESMO), the National Institute of Health and Care Excellence (NICE), and the American Society of Clinical Oncology (ASCO), among others [11-13]. We identified four requisites for initial diagnostic evaluation in the Medicare dataset. First, all guidelines recommend a level four comprehensive physical exam. Comprehensive physical exams are essential to interpret the results of subsequent diagnostic procedures [14]. Second, since all guidelines include laboratory assessments, we assessed if the patient received at least one laboratory code. Third, since all guidelines recommend CT scans and some recommend chest X-ray or PET scans, we included at least one scan to allow for physician preference and suspicion of the primary tumor. Fourth, all guidelines recommend a biopsy. We defined receipt of a complete initial diagnostic evaluation if a patient received all four diagnostic procedures within a three-month window of the SEER diagnosis date. We defined an incomplete evaluation if a patient was missing any one of the four initial requisite diagnostic procedures/tests within the three-month window. Herein, we refer to our definition of guideline-recommended initial diagnostic evaluation as ‘complete diagnostic evaluation.’ All codes are in Table 1. We also examined two supplementary diagnostic tests, immunohistochemistry (IHC) and genetic/molecular tests.
Treatments
The ultimate goal of the diagnostic evaluation is to select palliative therapy to control symptoms or prolong life. We used radiation and chemotherapy administration codes in the physician and outpatient Medicare files. Chemotherapeutic or supplemental agents administered outside of the clinical setting were identified in Medicare Part D. Codes are in Table 1. We did not classify surgery as treatment since most CUP patients present at emergency departments and receive emergency surgery before tumor pathology is known [15].
Analysis
For the entire cohort, we calculated the median time between the CUP diagnoses and the receipt time for each of the four diagnostic tests (Figure 1). We compared the timing of receipt of each of the four diagnostic tests between patients who eventually received and did not receive a complete diagnostic evaluation using the Wilcoxon-Mann-Whitney test, Figure 1. We then calculated the percentage of patients receiving a complete diagnostic evaluation and treatment by patient characteristics (Table 2).
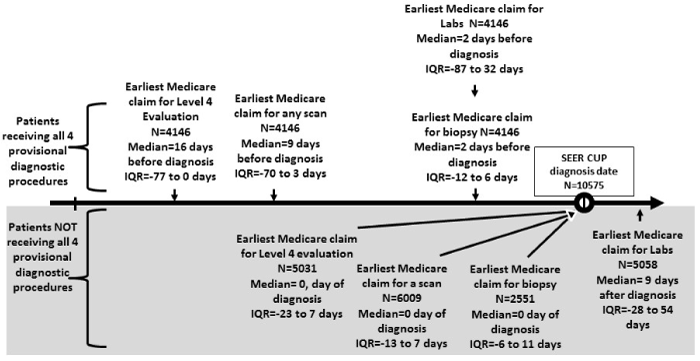
Figure 1. Time differences in receipt of diagnostic tests between patients who received a complete diagnostic evaluation vs patients who did not: SEER-Medicare cancer of unknown primary, 2005-2009
Table 2. Receipt of a complete diagnostic evaluation and treatment by patient and tumor characteristics, SEER-Medicare 2005-2009
Demographic Variable |
Number (Percent) |
Percent Receiving a Complete Diagnostic Evaluation within 3 Months of Diagnosisa |
Receipt of Any Treatment |
Total |
10575 |
35.3% |
40.7% |
Gender |
Male |
4395(41.6%) |
37.2% |
22.9% |
Female |
6180 (58.3%) |
33.9% |
22.9% |
Age at Diagnosis |
66-74 |
2885 (27.3%) |
44.5% |
39.7% |
75-84 |
4607 (43.6%) |
38.1% |
26.6% |
85+ |
3083 (29.2%) |
22.4% |
13.2% |
Race and Ethnicity |
Black |
794 (7.5%) |
33.0%d |
17.6% |
White |
8726 (82.5%) |
35.5%d |
27.4% |
Latino |
526 (5%) |
37.3%d |
23.% |
Other |
529 (5%) |
33.5%d |
23.3% |
Urban |
Yes |
5475 (51.8%) |
37.2% |
26.2% c |
No |
5100 (48.2%) |
33.3% |
26.4% c |
Comorbidities |
None |
6966 (65.9%) |
33.8% |
27.8% |
1 |
1818 (17.2%) |
40.0% |
27.3% |
2+ |
1791 (16.9%) |
36.5% |
19.4% |
Incomeb |
High |
3522 (33.3%) |
37.8% |
28.8% |
Medium |
3525(33.3%) |
34.8% |
26.2% |
Low |
3528(33.4%) |
33.3% |
26.2% |
SEER Reported Histology with Documented Diagnostic Confirmation |
Adenocarcinoma |
2973(28.1%) |
62.1% |
30.6% |
Squamous |
863(8.2%) |
62.4% |
60.4% |
Neuroendocrine |
473 (4.5%) |
71.4% |
36.2% |
Undifferentiated |
103(1.0%) |
62.2% |
40.8% |
Poorly Differentiated |
421 (4.0%) |
53.7% |
34.7% |
Epithelial, NOS, & Undocumentedd |
5752 (54.3%) |
20.3% |
17.2% |
Initial Diagnostic Tests (not mutually exclusive) |
Evaluation and Management, Level 4 |
8790(83.1%) |
45.6% |
27.9% |
Laboratory Tests |
9133(86.4%) |
46.3% |
29.3% |
Scan |
10025(94.8%) |
41.5% |
95.8% |
Biopsy |
6625(62.6%) |
62.8% |
89.9% |
Supplemental Diagnostic Tests |
Immunohistochemistry |
5210(49.3%) |
58.8% |
38.8% |
Molecular Profiling |
192 (1.82%) |
67.7% |
57.8% |
aGuideline-recommended diagnostic evaluation included a receipt of a level four history and physical assessment code, and at least one scan, laboratory assessment, and one biopsy
bIncome was set as relative measures in three levels, each encompassing about 33% of the cohort
cNot statistically different at the 5% level (=>0.05)
dNot otherwise specified
We measured the determinants of receiving a complete diagnostic evaluation among patients surviving at least three-months using logistic regression (N=6,080; Table 3). We measured the odds ratio of receiving a justified diagnosis and calculated adjusted predicted probabilities using marginal standardization. This standardization technique proportionally adjusts the odds according to a weight for each level of covariate/exposure [16]. For each level of a covariate, the proportion of observations with the outcome that we would have observed had we been able to force all of the study population to covariate/exposure level was E=e.
Table 3. Characteristics of patients receiving a justified CUP diagnosis based on a complete diagnostic evaluationa among patients with at least three months of follow-up, SEER-Medicare 2005-2009 (N=6,080)
Patient Factors |
Receipt of Diagnostic Evaluation |
| |
Adjusted Probabilities Percent (95%CI) |
Adjusted Odds Ratio (95%CI) |
Age at Diagnosis |
66-74 |
54.9(52.8,57.1)c |
2.4(2.1,2.8)c |
75-84 |
48.5(46.7,50.3)c |
1.8(1.6,2.1)c |
85+ |
35.6(33.3,38.0)c |
Reference |
|
Gender |
Females |
45.2(43.7,46.7)c |
0.8(0.7,0.9)c |
Males |
50.2(48.3,5.02)c |
Reference |
|
Population Density |
Rural |
45.1(43.3,46.8)c |
0.8(0.8,0.9)c |
Urban |
49.3(47.6,51.0)c |
Reference |
|
Income |
High |
50.1(48.0,52.2)c |
1.2(1.1,1.4)c |
Medium |
46.7(44.6,48.7) |
1.1(0.9,1.2) |
Low |
45.0(42.9,47.2)c |
Reference |
|
Race/Ethnicity |
Black |
45.9(41.3,50.6) |
1.0(0.8,1.2) |
Latino |
49.4(44.2,54.6) |
1.1(0.9,1.5) |
Other |
42.0(36.9,47.1) |
0.9(0.7,1.2) |
White |
47.6(46.3,48.9) |
Reference |
|
Comorbidity |
None |
44.5(43.0,45.9)c |
0.6(0.5,0.8)c |
1 |
54.2(51.4,57.0) |
1.1(0.9,1.3) |
2+ |
52.6(49.5,55.7)c |
Reference |
|
Histology |
Epithelial, NOS, &
Undocumented |
34.0(32.4,35.6)c |
0.2(0.2,0.2)c |
Known pathologyb |
63.4(61.6,65.2)c |
Reference |
aGuideline-recommended diagnostic evaluation includes a level four history and physical assessment code, and at least one scan, laboratory assessment, and one biopsy
bKnown pathology in standard categories: adenocarcinoma, squamous, neuroendocrine, undifferentiated, and poorly differentiated
cStatistically different
Pr (Y = 1|Set[E=e]) = ∑zPr(Y=1|Set[E=e],Z= z) Pr(Z= z) ,
where Set[E =e] forces all observations to a single exposure level e, and Z = z is the set of observed values for the covariate vector Z. The regression estimate, p̂ez,= ∑zPr(Y=1|Set[E=e] from observed data is estimated [16]. The advantage of marginal standardization is generalizability to the entire cohort of Medicare patients in the SEER catchment area.
Fourth, we measured the determinants of receiving treatment among patients surviving at least three-months and diagnosed in 2007 or later using logistic regression and marginally standardized predicted probabilities (Table 4).
Table 4. Characteristics of receipt for treatment among patients with at least three months of follow-up, N=3,428, SEER-Medicare 2007-2009
|
Receipt of Treatment |
Covariates |
Adjusted Probabilities Percent (95%CI) |
Adjusted Odds Ratio (AOR 95%CI)
|
Guideline-Recommended Diagnostic Evaluation1 |
Yes |
46.7(44.4,49.1) |
2.0(1.7,2.3)2 |
No |
32.7(30.4,35.0) |
Reference |
Age at Diagnosis |
66-74 |
51.1(48.2,54.0) |
3.4(2.8,4.2)2 |
75-84 |
39.6(37.2,42.0) |
2.0(1.7,2.5)2 |
85+ |
25.7(22.8,28.7) |
Reference |
Gender |
Males |
44.8(42.4,47.2) |
1.5(1.3,1.8)2 |
Females |
36.3(34.3,38.3) |
Reference |
Population Density |
Rural |
41.2(38.9,43.5) |
1.1(0.9,1.3) |
Urban |
38.7(36.5,40.9) |
Reference |
|
Income |
High |
42.3(39.6,45.1) |
1.3(1.0,1.5)2 |
Medium |
39.7(37.1,42.3) |
1.1(0.9,1.3) |
Low |
37.6(34.8,40.3) |
Reference |
Race/Ethnicity |
Black |
28.1(22.4,33.8) |
0.5(0.4,0.7)2 |
Latino |
37.4(30.8,43.9) |
0.8(0.6,1.1) |
Other |
29.1(22.9,35.4) |
0.5(0.4,0.8)2 |
White |
41.7(40.0,43.3) |
Reference |
Comorbidity |
None |
41.0(39.1,42.8) |
1.3(1.0,1.5)2 |
1 |
39.1(35.6,42.6) |
1.1(0.9,1.5) |
2+ |
36.5(32.7,40.2) |
Reference |
Histology |
Epithelial, NOS, & Undocumented |
36.6(34.4,38.8) |
0.2(0.2,0.2)2 |
Standard Categories2 |
43.0(40.8,45.2) |
Reference |
Immunohistochemistry |
Yes |
46.8(44.6,49.0) |
2.3(2.0,2.8)2 |
No |
29.2(26.7,31.8) |
Reference |
Genetic/Molecular Tests |
Yes |
57.2(48.2,66.2) |
2.4(1.5,3.7)2 |
No |
39.3(37.8,40.9) |
Reference |
1All guideline-recommended diagnostic evaluation includes a receipt of a level four history and physical assessment code, and at least one scan, laboratory assessment, and one biopsy
2Statistically significant at the 5% type 1 error rate
Sub analyses
We incidentally examined the concordance of CUP diagnoses in SEER to a CUP diagnosis in the Medicare encounter data as a sub-aim of this research [14]. Encounter data codes do not have the systematic and reproducible algorithm to identify tumors used by SEER registrars, so we used the broader NICE definition of CUP in the encounter data. To enhance the generalizability of our results, we examined if the non-concordant cases in SEER and Medicare influenced our inferences using a sensitivity analysis.
All analyses were performed using SAS statistical software, version 9.2 (SAS Institute, Cary, NC). Marginal standardization was assessed using the ‘margins’ macro in SAS. All statistical tests and confidence intervals were two-sided with the type 1 error level set at 5%.
Descriptive results
We compared the timing of the receipt of each of the four diagnostic tests among patients with and without a complete diagnostic evaluation in Figure 1. The figure is divided into top and bottom with a timeline in the center of the figure. The top half of the figure displays the median times and the interquartile ranges for patients who received a complete diagnostic evaluation (all of the four diagnostic tests). The bottom half of the figure displays the median times and the interquartile ranges for patients who did not receive a complete diagnostic evaluation. Patients receiving a complete diagnostic evaluation received each test earlier than the group of patients not receiving a complete diagnostic evaluation; P<0.01. See Figure 1.
The crude analysis showed that 35.3% of patients received a complete diagnostic evaluation within three months of diagnosis (Table 2). About 41% of patients received any treatment. Almost all patients received a scan, but only 62.6% received a biopsy. Of the 54.3% of patients receiving a biopsy resulting in an uncertain or vague pathology (epithelial, not otherwise specified, or undocumented pathology), 20.3% received a complete diagnostic evaluation compared with 53.7-71.4% of patients with documented pathology (histology and grade; Table 2).
Characteristics of patients receiving a complete diagnostic evaluation
Table 3 depicts characteristics among patients receiving a justified CUP diagnosis based on a complete diagnostic evaluation. Younger age at diagnosis (66-74 vs. older) had 2.4 times higher odds of receiving a complete diagnostic evaluation, adjusted odds ratio and 95% confidence interval, AOR=2.4(2.1, 2,8). Higher odds of receiving a complete diagnostic evaluation was also observed among patients with the highest third of median income, AOR=1.2(1.1,1.4). Lower odds of receiving a complete diagnostic evaluation was observed among female vs. male, AOR=0.8(0.7,0.9), among patients living in rural vs. urban areas, AOR=0.8(0.7,0.9), and among patients without comorbidities, AOR=0.6(0.5,0.8).
Patients with documented tumor pathology (histology and grade/differentiation) had the highest adjusted probability of receiving a complete diagnostic evaluation, 63.4% (61.6,65.2) vs. patients with vague or missing pathology, 34.0% (32.4,35.6). The predicted probability of the youngest age group, 66-74, receiving a complete diagnostic evaluation was 54.9% (52.8,57.1) compared to the oldest age group, 85+, 35.6% (33.3,38.0). Using a linear combination of the three most influential variables predicting a complete diagnostic evaluation (documented tumor pathology, young age, and one comorbidity), the adjusted probability of the patient with a justified CUP diagnosis based on a complete diagnostic evaluation only reached 77% (data not shown elsewhere).
Patient characteristics and receipt of treatment
Table 4 depicts the statistically adjusted impact of patient characteristics on the receipt of treatment. Patients receiving a complete diagnostic evaluation had double the odds of receiving treatment relative to patients not receiving a complete diagnostic evaluation, AOR=2.0(1.7,2.3). Younger patients had higher odds of receiving treatment relative to the oldest age group, AOR=3.4(2.8,4.2) and males had higher odds of receiving treatment, AOR=1,5(1,3,1.8). Patients in the highest income bracket had 30% higher odds of receiving treatment relative to patients in the lowest income bracket, AOR=1.3(1.0,1.5) while Blacks and patients in the other race/ethnicity categories had about half of the odds of receiving treatment relative to White patients, AOR=0.5(0.4,0.7) and AOR=0.5(0.4,0.8), respectively. Patients with no comorbidities had 30% higher odds of receiving treatment, AOR=1.3(1.0,1.5), while patients receiving supplemental diagnostic tests, specifically IHC and genetic/molecular studies, had over two times higher odds of receiving treatment relative to patients not receiving IHC and genetic tests, AOR=2.3(2.0,2.8) and AOR=2.4(1.5,3.7), respectively.
The adjusted marginal probability of treatment was highest among patients receiving molecular tests, 57.2%, 95%CI (48.2,66.2), immunohistochemistry, 46.8%, 95%CI (44.6,49.0), and complete diagnostic evaluation, 46.7%, 95%CI (44.4,49.1). The youngest age group had the highest predicted probability of receiving treatment, 51.1%, 95%CI (48.2,54.0). See Table 4.
Sub-analyses results
The concordance of a CUP diagnosis in the Medicare claims data with SEER was 89%. Of the Medicare recipients without concordance, 9.5% had no cancer reported in the Medicare encounter data (CUP or other cancer), and 1.5% had a primary site in the encounter data that was not justified in the medical record data collected by registrars. The sensitivity analysis did not change our inferences (data not shown).
Population-based epidemiological cancer data allows governments and health providers to target resources to those in need to ensure healthy and productive societies. CUP presents challenges to cancer surveillance. Only 35% of CUP patients reported to the cancer registry received a timely diagnostic evaluation. Rural patients were less likely to receive a complete diagnostic evaluation, even after adjustment for age, gender and socioeconomic variables. Even though the odds ratios demonstrated characteristics of receiving a justified CUP diagnosis, the population probabilities of receiving a justified CUP diagnosis were low. Vague or undocumented tumor pathology was the most influential indicator in the cancer registry to identify potentially misclassified CUP diagnoses. Conversely, documented tumor pathology had the highest probability to identify a justified CUP diagnosis in the cancer registry at 63.4%. For accurate assessment of the CUP burden, we recommend the SEER definition of CUP include the extent of diagnostic inquiry.
It is estimated that only 50% of US patients receive guideline-recommended care for all disease conditions [14]. The fact that only 35% of CUP patients received a complete diagnostic evaluation and that 40.7% of patients surviving longer than three months received palliative therapy suggests that CUP patients are a particularly vulnerable subset of cancer patients with regards to receipt of guideline-recommended care. The confounder-adjusted probability of receiving a complete diagnostic evaluation, even among a subset of patients with the most favorable characteristics (younger age, known tumor pathology, and one comorbidity) only reached 77%. Thus, population-based assessments of CUP likely include misclassified patients who were un- or under-investigated for the primary tumor even when controlling for frailty (age, comorbidities, and survival time) and clinical uncertainty (ill-defined tumor histology and grade). Misclassification and un- or under-diagnoses have implications for not only cancer surveillance of CUP, but also the equitable distribution of care.
This study identifies documented tumor pathology (histology and grade) as the best indicator in the cancer registry of a complete diagnostic workup and justified CUP diagnosis. However, documented tumor pathology is not sufficient to identify justified CUP diagnoses in cancer registry data. Given that 54% of elderly CUP Medicare patients examined in this study had unspecified or vague tumor pathology, a justified CUP diagnosis needs to be redefined to identify this population.
Regarding the confounders assessed, older age was associated with non-adherence to diagnostic evaluation regardless of comorbid conditions. Research shows, in general, older patients are less likely to receive cancer care relative to younger patients independent of comorbidities [17-19]. The adjusted probability of a complete diagnostic evaluation among patients with one comorbidity was higher than patients without comorbidities or with many comorbidities. These results are unsurprising given other research has documented comorbidities result in a higher quality of care [20]. Patients with comorbidities may contact the health care system more often than patients without comorbidities, thus are more likely to receive diagnostic evaluation [21].
Adjustment for age and comorbid conditions did not mitigate the impact of socioeconomic/racial disparities in the receipt of diagnostic care. Lower-income patients use health care less often, regardless of insurance and country-specific health care infrastructure [22]. Our findings show lower income as a contributor to non-receipt of a complete diagnostic evaluation. Our findings concur with research among Australian, UK, and US populations reporting higher CUP rates among disadvantaged populations [23,24].
Since CUP, by definition, is metastatic, treatment focuses on symptom relief, palliative care, and prolongation of life. Adjusted for age, a complete diagnostic evaluation including immunohistochemistry and genetic/molecular tests were the most influential factors influencing the probability of receiving treatment. Vajdic et al. reported Australian CUP patients receive fewer surgical resections (including biopsies) compared to patients with a known primary site [25]. Other factors influencing the receipt of treatment are race and income. This study documents that Whites relative to Blacks and higher income patients relative to lower income patients had higher odds of receiving treatment. These results are concordant with research that documents Black CUP patients have higher mortality rates than White and Latino CUP patients [26].
Based on the results of the sub-analysis investigating concordance between SEER and Medicare for a CUP diagnosis, we suspect a primary site documented in claims records, but not in the medical record, could have been used to justify payment of clinical procedures and treatment.
The potential misclassification of CUP in cancer registries can influence population based assessments of clinical, public health, and health services interventions. All CUP patients, regardless of race, socioeconomic status, and presence of comorbidities should have the choice to receive the highest-quality, symptom-reducing palliative care. If a patient and physician chose to undergo diagnostic evaluation, tumor histology and grade should be documented. Biopsies should be repeated if the tissue sample was inadequate to identify tumor features. IHC or molecular profiling should be conducted if pathology is uncertain; research suggests IHC identifies pathology for 60-70% of cancers [27]. Conversely, our study found less than half of CUP patients receive IHC. Other studies reported molecular profiling predicted a site of origin for more than 95% of CUP patients [28,29]. The low portions of patients receiving molecular tests may be due to the inconsistency among guideline-recommending organizations despite the compelling evidence of efficacy. During the observation time this study was conducted, Medicare did not cover genetic/molecular tests. Thus, financial access to molecular tests may have been unavailable to many patients [30]. Recently, commercial tests of gene profiling microarrays became available for the diagnosis of CUP. Medicare began covering some genetic tests for patients with metastatic cancers like CUP in 2017 [31]. When this data becomes available to researchers, it will be interesting to see if CUP incidence rates decline. This study will serve as baseline data and justification for future population-based assessments of CUP.
While the breadth of the SEER-Medicare dataset gave us incident CUP patients and robust sample size, this study has limitations. The patients were older than age 65. However, the average age of a CUP diagnosis is over age 80. Therefore, this study can be generalized to most CUP patients. Although most US patients over age 65 have Medicare insurance, this study excluded patients using Medicare managed care, who may be healthier [32].
This study develops a methodological framework to improve and evaluate cancer surveillance for CUP. Improving cancer registry data enhances surveillance allowing researchers to understand new technologies, like molecular studies, help target future research, and expand resources on palliative treatment decisions to prolong survival, reduce symptoms, and improve quality-of-life for CUP patients [33,34].
Funding Support was provided by the National Institutes of Health grant P30 CA042014 (Ulrich, PI), GMaP Region 6, Huntsman Cancer Institute, at the University of Utah. The content is solely the responsibility of the authors and does not necessarily represent the official views of the National Institutes of Health.
The authors thank the Cancer of Unknown Primary Foundation for organizing research conferences in London, UK to exchange ideas and advance research specifically for Cancer of Unknown Primary.
This study used the linked SEER-Medicare database. The interpretation and reporting of these data are the sole responsibility of the authors. The authors acknowledge the efforts of the Applied Research Program, NCI; the Office of Research, Development, and Information, CMS; Information Management Services (IMS), Inc.; and the Surveillance, Epidemiology, and End Results (SEER) Program tumor registries in the creation of the SEER-Medicare database.
The authors declare no conflicts of interest.
- Siddiqui AH, Zafar SN (2018) Global Availability of cancer registry data. J Glob Oncol 4: 1-3. [Crossref]
- Pavlidis N, Pentheroudakis G (2010) Cancer of unknown primary site: 20 questions to be answered. Ann Oncol 21: vii303-7. [Crossref]
- Fiazi K, Greco FA, Pavlidis N, Pentheroudakis G (2011) Cancers of unknown primary site: ESMO Clinical Practice Guidelines for diagnosis, treatment, and follow-up. Ann Oncol 22: vi64-8. [Crossref]
- Gomez-Macías GS, Garza-Guajardo R, Segura-Luna J, Barboza-Quintana O (2009) Inadequate fine needle aspiration biopsy samples: pathologists versus other specialists. Cytojournal 6: 9. [Crossref]
- Al-Marzooq YM, Chopra R, Al-Bahrani AT, Younis M, Al-Mulhim AS, et al. (2004) Comparison of specimen adequacy in fine-needle aspiration biopsies performed by surgeons and pathologists. Ann Saudi Med 24: 124-126. [Crossref]
- Cabana MD, Rand CS, Powe NR, Wu AW, Wilson MH, et al. (1999) Why don't physicians follow clinical practice guidelines? A framework for improvement. JAMA 282: 1458-1465. [Crossref]
- Sève P, Mackey J, Sawyer M, Lesimple T, de La Fouchardiere C, et al. (2009) Impact of clinical practice guidelines on the management for carcinomas of unknown primary site: a controlled "before-after" study. Bull Cancer 96: E7-17. [Crossref]
- SEER Training Modules, Process of Cancer Data Collection (2015) US National Institutes of Health, National Cancer Institute.
- SEER Surveillance, Epidemiology, and End Results (SEER) Program (www.seer.cancer.gov) SEER*Stat Database: Incidence - SEER 18 Regs Research Data, Nov 2017 Sub (1973-2015) - Linked To County Attributes-Total U.S., 1969-2016 Counties, National Cancer Institute, DCCPS, Surveillance Research Program, released April 2018, based on the November 2017 submission.
- Klabunde CN, Warren JL, Legler JM (2002) Assessing comorbidity using claims data: an overview. Med Care 40: IV-26-35. [Crossref]
- Pavlidis N, Pentheroudakis G (2012) Cancer of unknown primary site. Lancet 379: 1428-1435. [Crossref]
- Pentheroudakis G, Stahel R, Hansen H, Pavlidis N (2008) Heterogeneity in cancer guidelines: should we eradicate or tolerate? Ann Oncol 19: 2067-78. [Crossref]
- Kok SMJ, van Laarhoven HWM, Lemmens VEPP, Schroten C (2015) International Variation in Diagnostic and Treatment Guidelines for Carcinoma Unknown Primary. Int J Cancer Res 49: 1711.
- National Institute for Health and Care Excellence (NICE) (2010) Metastatic malignant disease of unknown primary origin: Diagnosis and management of metastatic malignant disease of unknown primary origin.
- Jones W, Allardice G, Scott I, Oien K, Brewster D, et al. (2017) Cancers of unknown primary diagnosed during hospitalization: a population-based study. BMC Cancer 17: 85.
- Muller CJ, MacLehose RF (2014) Estimating predicted probabilities from logistic regression: different methods corresponding to different target populations. Int J Epidemiol 43: 962-970. [Crossref]
- Protière C, Viens P, Rousseau F, Moatti JP (2010) Prescribers’ attitudes toward elderly breast cancer patients. Discrimination or empathy? Crit Rev Oncol Hemato 75: 138-150. [Crossref]
- Schroyen S, Adam S, Jerusalem G, Missotten P (2014) Ageism and its clinical impact in oncogeriatry: state of knowledge and therapeutic leads. Clin Interv Aging 10: 117-125. [Crossref]
- Abraham A, Habermann EB, Rothenberger DA, Kwaan M, Weinberg AD, et al. (2013) Adjuvant chemotherapy for stage III colon cancer in the oldest old: results beyond clinical guidelines. Cancer 119: 395-403. [Crossref]
- Massarweh NN, Park JO, Bruix J, Yeung RS, Etzioni RB, et al. (2011) Diagnostic imaging and biopsy use among elderly Medicare beneficiaries with hepatocellular carcinoma. J Oncol Pract 7: 155-160.
- Department of Health Pharmaceutical Oncology Initiative (2012) The Impact of Patient Age on Clinical Decision-Making in Oncology. London, UK: Department of Health.
- van Doorslaer E, Wagstaff A, van der Burg H, Christiansen T, De Graeve D, et al. (2000) Equity in the delivery of health care in Europe and the US. J Health Econ 19: 553-583. [Crossref]
- Luke C, Koczwara B, Karapetic D, Pittman k, Price T, et al. (2008) Exploring the epidemiological characteristics of cancer of unknown primary site in an Australian population. Aust NZ Public Health 32: 383-389. [Crossref]
- Brewster DH, Lang J, Bhatti LA, Thompson CS, Oien KA (2014) Descriptive epidemiology of cancer of unknown primary site in Scotland, 1961-2010. Cancer Epidemiol 38: 227-234. [Crossref]
- Vajdic CM, Schaffer AL, Dobbins TA, Ward RL, Er CC, et al. (2015) Health service utilization and investigations before diagnosis of cancer of unknown primary (CUP: A population-based nested case-control study in Australian Government Department of Veterans’ Affairs clients. Cancer Epidemol 39: 585-592. [Crossref]
- Pinheiro PS, Callahan KE, Gomez SL, Marcos-Gragera R, Cobb TR, et al. (2017) High cancer mortality for US-born Latinos: evidence from California and Texas. BMC Cancer 17: 478. [Crossref]
- Anderson GG, Weiss LM (2010) Determining tissue of origin for metastatic cancers: meta-analysis and literature review of immunohistochemistry performance. Appl Immunohistochem Mol Morphol 18: 3-8. [Crossref]
- Hainsworth JD, Greco FA (2014) Gene expression profiling in patients with carcinoma of unknown primary site: from translational research to standard of care. Virchows Arch 464: 393-402. [Crossref]
- Santos MTD, Souza BF, Cárcano FM, Vidal RO, Scapulatempo-Neto C, et al. (2018) An integrated tool for determining the primary origin site of metastatic tumours. J Clin Pathol 71: 584-593. [Crossref]
- Crawford SM, Skinner J, Coombes E, Jones AP (2017) Cancer of Unknown Primary: A Cancer Registry Study of Factors Affecting Access to Diagnosis. Clin Oncol (R Coll Radiol) 29: e39-e46. [Crossref]
- Centers for Medicare and Medicaid Services (2019) CMS finalizes coverage of Next Generation Sequencing tests, ensuring enhanced access for cancer patients.
- Federal Interagency Forum on Aging-Related Statistics (2015) Older Americans: Key Indicators of Well-Being. Federal Interagency Forum on Aging-Related Statistics, Washington, DC: U.S. Government Printing Office.
- Casey DE Jr. (2013) Why don't physicians (and patients) consistently follow clinical practice guidelines? JAMA Intern Med 173: 1581-1583. [Crossref]
- Harrington SE, Smith TJ (2008) The role of chemotherapy at the end of life: "when is enough, enough?" JAMA 299: 2667-2678. [Crossref]
- American Medical Association (2009) Physicians’ Current Procedural Terminology- CPT 2009. Chicago, IL: American Medical Association.
- American Urological Society 2011.
- National Cancer Institute, Healthcare Delivery Research Program (2019) Procedure Codes for SEER Medicare Analyses.