Abstract
Technological advances have generated new resources that allow patients to be more involved in their health care. As different innovations find their way into the healthcare sector, physicians and patients experience some challenges as they try to adopt these innovations. One particular innovation in healthcare has been the use of patient portals to increase self-management of different conditions by patients. This study focused in exploring the barriers in the access of the MyChart portal at Baptist Memorial Health Care Corporation and, to some extent, how to handle this problem. An online survey questionnaire was sent to 22 help care desk agents who have been employed with the organization for more than 90 days and face-to-face interviews were scheduled with 5 of these participants. Data obtained from the 19 respondents who responded to the questions and the five interviewees revealed that the major barrier to patient portal access is the lack of computer or phone skills. At the same time, proxy access problems were identified as another challenge.
Key words
patient portals, electronic health record, effectiveness
Barriers that affect the use of patient portals
Over the years, there has been a rapid increase in the utilization of electronic health records (EHRs) which are known to provide a number of opportunities in the enhancement of communications between patients and service providers. One of the important elements of the use of these records has been the use of patient portals that act as electronic points through which users can access EHRs. These portals are also referred to us tethered personal health records and have a great potential to enhance communication in a clinical setting.
Among many benefits, these portals have been found to allow patients to take part in disease management programs, schedule appointments, refill medications, access test results and securely exchange messages with providers. Consequently, the portals have the potential to improve patient empowerment as well as improve timeliness, quality, and satisfaction in healthcare delivery. As such, there is no doubt that, with the available federal subsidies, patient portals will continue to play an important role in the delivery of healthcare and help providers to achieve meaningful use of electronic records. Researchers have studied the use of different aspects of electronic health (eHealth) in the management of diseases. Particularly, much study has been done on the use of eHealth in the management of diabetes mellitus and other diseases. The increase in the use of EHRs has partially been facilitated by development of the Health Information Technology for Economic and Clinical Health (HITECH) Act, which advocates for the achievement of meaningful use through well-developed incentive programs. Despite these facilitating factors, the implementation and adoption of patient portals and other aspects of EHRs is compromised by a myriad of factors or barriers.
The thought or the assumption that patient portals and other aspects of mHealth have the potential to transform healthcare systems across the world in a number of ways has facilitated much research. Studies into the positive transformations facilitated by these portals have indicated that they have the potential to enable healthcare systems to effectively play their role of providing high quality services and addressing health needs of the members of the public. For example, states across the United States can use patient portals to cut the cost involved in the provision of healthcare. Additionally, the portals have the potential to allow states to maintain and improve the quality of their healthcare. More importantly, healthcare systems using patient portals as a point of contact can easily reach patients in remote areas.
Just like other developed nations, the United States faces a high prevalence of chronic diseases and lifestyle diseases as the major health problem. What is more, the prevalence of these disease conditions has been on the rise and the government authorities are forced to come up with appropriate ways through which the conditions can be managed. In an effort to achieve a significant level of disease management, the government has experienced the challenge of a poor provider-to-patients ratio, which stands at about 300 physicians per 100,000 people. For this reason, the remedy has been to device solutions that can reduce visits of patients to health centers or reduce the need for patients to physically contact the few physicians. This facilitated implementation of patient portals and mHealth applications as the most viable solutions.
Patient portals are developed in such a way that patients can communicate with health service providers and access their health information through online websites. On the other hand, mHealth applications are used to promote public and medical health practices by taking advantage of mobile devices. The mobile devices in common use in the support of mHealth applications include patient monitoring devices, personal digital assistants (PDAs), and mobile phones. Among these mobile devices, mobile phones are the most important since they allow the users to take advantage of devices’ core utilizes which include short messaging and voice.
Since their invention, mobile applications and patient portals have been applied to transform provision of healthcare at the individual, community and regional levels. The use of mobile application is known to have created avenues for application of patient portals and vice versa. For example, at the regional level, social networking models have been used in the past to electronically link many people through the use of tools such as mobile text messaging. Although the initial application of social networking models was in disaster mitigation, their uses have found applications in health promotion. For instance, specific messages can be carefully crafted and disseminated to the members of the public through text messaging to encourage them to adopt healthy behaviors. Patient portals and mobile applications have allowed health systems to move away from traditional health-oriented campaigns that relied on the use of radio, televisions, and billboards can be expanded to accommodate cellular networks.
Although a number of previous studies have explored different aspects of patient portals and eHealth in general, deficiencies in the research base on this topic can be identified. Previous studies on this area have over-concentrated on aspects of patient portals in the developing countries mainly because these countries are faced by a special category of health challenges such as communicable diseases. This means that only a limited number of studies have focused on the developed world. Furthermore, the few studies that focused on patient portals in the developed world have barely studied the barriers of the use of these portals and what can be done to achieve improved adoption. Previous studies on this area of study have concentrated on the potential of patient portals.
Previous studies have recognized that the major obstacle in the use of patient portals in different regions of the world is the lack of an enabling environment in the form of economic power to subsidize the price of mobile tools. Despite the fact that most countries have a good base of companies offering mobile technology services, the accessibility of mobile tools that can support the use of patient portals is still limited to a few citizens. Therefore, studies on such limitations are needed to strengthen the research base on the successful implementation of patient portals to achieve specific objectives in the United States. It is important to appreciate that researchers have made an effort to understand the challenges experienced in the use patient portals. However, little is known about the privacy and security challenge of using patient portals. Most patient portal potential users in rural regions have a poor education background and must be made to understand how secure will be their information if they embrace the use of these portals. From these arguments, it is clear that the implementation and use of patient portals happen amid an array of barriers which are yet to be understood clearly and in a deeper manner.
Being a support specialist that assist patient with accessing their patient portal has given myself and my co-workers insight into the anxiety and frustration that they feel while attempting to utilize their portals. Many of the users are over the age of 65 and are lacking basic computer skills. Potential barriers such as time, access to the internet, devices used and the password reset process will be evaluated and reviewed to help identify and reduce barriers that are affecting patients logging into the portal. Out of the 15,248 MyChart calls that the BMHCC helpdesk has received for 2017 year, 11,638 were requesting password resets and 1,065 requesting activation codes. These calls are received although a method to reset the password is available for patients to use without having to call the helpdesk. This has prompt questions to arise in regards to barriers that can be affecting patient’s attempt to access their patient portal. This study will help identify barriers that might be interfering with patients being able to access the MyChart patient portal with ease.
From the above discussion, it is apparent that the use of patient portals does not happen without some challenges of barriers. This explains why the purpose of carrying out this study was to explore the importance of patient portals and identify the barriers that affect the use of these portals by patients in the USA. An additional aspect of this study was to determine what can be done to make it easier for patients to access their portals without worrying about the security of their health information.
The results and discussions provided in this study are expected to have a major implication in healthcare, especially the use of technology in this field. An understanding of the potential benefits of patient portals, such as cost-reduction and quality improvement will guide health providers in the design of better portals. The challenges experienced by adopters of patient portals have been identified. With this understanding, strategies or measures can be developed to overcome the identified challenges. Particulars of the challenges, whether client-based or developer-based, have also been identified. This is an indication that the developed strategies or measures can be targeted to the right area.
In the course of the study, gaps in the field were identified, with limited research on barriers to the use of patient portals being the major gap. Therefore, the current research can direct future research on this topic on such areas, thereby creating a rich body of knowledge. Many researchers and individuals in the general population are aware that the use of patient portals is hampered by several challenges. However, only a small proportion of these people understand the specific barriers to the use of these portals. Therefore, this study is of great importance to the field of study as it outlines examples of specific barriers.
The government is also expected to benefit from this study by obtaining the specific interventions it needs to pursue to improve the use of patient portals developed by its health systems. Furthermore, government authorities can use this study as a source of areas it needs to channel its interventions in an effort to improve the use of patient portals. It is worth to note that actual users of the patient portals stand a chance to benefit from this study in that they will get insights on how to improve the security of their health information.
Theoretical framework
How and why people adopt or embrace innovations has facilitated much research over the years. As research on these two aspects gained momentum, scholars developed different theories to describe factors surrounding adoption of innovations, including the barriers to adoption of different forms of technologies. Despite the existence of many theories and models such as concerns-based adoption model and technology acceptance model, this research was based on diffusion of innovations theory as the most appropriate theory. The suitability of this theory in the study in question is based on the fact that the theory recognizes that the adoption of an innovation such as the use of patient portals can be influenced by different factors. The theory identifies the four classifications of these factors in the form of the social system, innovation’s attributes, communication channels, and the adopter’s characteristics. For the purpose of this study, the most significant factors fall in the adopters’ characteristics, such as health literacy, computer skills, and level of training.
As doctors, patients, and administrators utilize patient portals, a number of benefits of these portals to both patients and physicians have been realized. Top of the list of these benefits is the ability of patient portals to support preventive care. When physicians apply patient portals correctly, they are to make sure that their patients achieve a fuller and a better understanding of health. Research studies have come up with findings that prove that the use of patient portals as an interface of communication between patients and doctors has been a source of many improvements. The use of patient portals does not only improve self-management of active treatments, but also improves adherence to medication. What is more, patients using the portals show increased propensity and appreciation for preventive care. According to Tieu, patients who use well-developed portals exhibit a higher level of knowledge of their treatment as well as an improved rate of preventive care [1]. More importantly, the number of visits the doctor visits the patient is expected to make is reduced significantly. Therefore, it is clear that patient portals are important tools in the reduction of patient cares since the travel expenses are reduced or eliminated altogether. On the side of the physicians, patient portals get more time to handle other issues in preventive care.
Health service providers have used patient portals to increase revenue or create new business opportunities. It is known that adoption of patient portals can increase patient payments by 4% to 8%. This is valuable since physicians find it difficult and expensive to track down clients for unsettled bills. Patients using online portals pay their bills easily and quickly. Most patients in previous studies argued that they find patient portals attractive, a factor that helps physicians to retain patients by reducing turnover. Therefore, this can be used as a way to improve or retain revenue. Patients who have already embraced the use of portals are 13% more likely to stick to one provide despite the fact that we are living in an era of increased choice [2]. This is of great benefit since it has been shown that a returning patient allows physicians to avoid administrative costs and increases value by about 15% in comparison to a new patient. This can translate to savings amounting to thousands of dollars from every patient in a single year.
Cost saving through the use of patient portals is achieved by health care organizations as the executives and administrators get an opportunity to make their daily operations more efficient and sleeker. As a communication tool, patient portals increase the efficiency and the speed at which scheduling and communication with the patient is done. These portals have been used to automate several processes and eliminate the need for staff to spend time on them. Patients can refill a prescription, make an appointment, have clarifying questions or pay a bill. This creates a room for physicians to achieve more accurate orders and schedules thereby eliminating various errors such as missed appointments [2]. Generally, patient portals are implemented to create a standard for more coordinated and better communication between patients and care providers. In addition to logistical and administrative gains achieved through the practice management tools, there is a great possibility that improved health outcomes will be achieved. This benefit is especially enjoyed by patients with ingoing treatments or needs. Patient portals have made it easier to monitor chronic care since the portals give the patients the freedom to work with a doctor remotely and create a schedule that best meets their needs.
Goldzweig identified additional benefits of using patient portals as a tool of communication between patients and doctors [2]. The portals have been preferred by many as they enable individuals to securely send and receive messages. This way, the need for long phone calls has been eliminated and patients can ask diverse questions between appointments. Patient portals have also been used to meet some requirements in the Meaningful Use criteria. For example, the education materials provided are patient-specific. Addition components of meaningful use which can be achieved through patient portals include ability to access personal health information and clinical summaries. It is important to stress that patient portals allow patients and physicians to enjoy access at any time of the day or night, allowing them to check or respond to posted messages at any time. Regardless of the office hours, patients can easily reach the physicians.
Although the use of patient portals is hampered by a number of factors, research has shown that there are various factors that favor the adoption of these portals in the United States and other nations of the world. In the case of the United States, there is an almost universal penetration of smartphones. This gives the country a strong foundation for the implementation of patient portals because a majority of citizens are conversant with the use of these devices other than for the purpose of receiving and making calls. In fact, the percentage of smartphone owners in the United States rose from 35% to 77% between 2011 and 2017 [3].
Another encouraging thing is that, in addition to being smartphone owners, majority of Americans are owners of different types of other information devices. About 80% of Americans are currently owners of a laptop or desktop computer while nearly 50% are tablet computer owners. What is more, about 20% own an e-reader device. Researchers have attributed the great growth in the use of smartphones to the drop in the price of the gadgets. More so, the United States leads many nations in internet penetration as the IT sector in the country has greatly grown to record an almost 80 percent internet penetration [3].
Success factors: When exploring the topic of patient portals, researchers have discussed what various players in the health sector need to do to make a patient portal successful. Authorities in the USA’s health sector are always looking for that unique ingredient that will encourage patients to use the portals for the first time and come back to the portal again. Unfortunately, it is clear that finding this special ingredient is not that simple. However, it some healthcare system find it easier to achieve patient engagement than others. Since there is no single strategy to encourage patients to sign for the portals, researchers recommend the use of a multifaceted approach [4].
A major factor in the success of patient portals is how the portal is marketed or its marketing strategies. Individuals and organizations involved in promoting the use of patient portals avow that the best way to market a patient portal is to take advantage of different promotion methods at diverse touch points. Just as every individual prefers a different learning method, there exists no one-size-fits all strategy in the marketing of a portal to different people. Therefore, the secret remains the integration of the promotion message into every avenue such as articles and newsletters.
According to Lober, another success factor in the use of patient portals is based on the level of patient engagement [5]. It is recognized that most organizations or portal developers may be able to encourage patients to sign up for their portals in the initial stages but find it difficult to make these patients use the portals continuously. It is in this light that Zickmund [6] avowed that there is a need for portal developers to offer the characteristics that the patients that are respondent to in the most favorable manner, such as secure messaging and online payment of bills. Again, health systems may also improve their patient engagement by proving the patients with an opportunity to enjoy online access of the test results on a frequently as possible. Although some tests cannot be released through online platforms, most of them can and should be. Still on the issue of patient engagement, making it possible for patients to share digital images can be a great portal feature. Although some physicians may fear that the feature mat be used inappropriately by a section of the patients, previous evaluations have provided positive results.
According to Kruse [7], although medical groups are always making efforts to achieve meaningful use though the use of patient portals, it is a challenge to make the patients sign up for the portal and continue using the portal. However, the good news is that portal developers with specific strategies in mind can find it easier to overcome these handles and achieve meaningful use. First of all, the individual or organization developing the portal needs to have a clear understanding of what is to be accomplished through the use of the portal. In this regard, the party involved must specify whether the goal is simply achieving the meaningful use requirements or there are wider goals to be achieved, which may include improving patient engagement or reducing costs. If there are several goals to be achieved, it is advisable to think about their rank since trade-offs are inevitable in such cases.
There is significance level of evidence that organizations or authorities who select portal leaders known to prioritize patient needs are very successful. Rather than having a committee, it is advisable to have a single person to be in charge of the entire portal strategy as it makes timely completion of various tasks a reality. This person must have a clear understanding of what the patients want from the technology. Although IT leaders may be of great value, they may over-concentrate on technical challenges. On the other hand, physicians selected as leaders may undervalue the need for patient convenience. This explains why Kruse [8] recommended the use of leaders who are used to dealing with patients as their customers, with a Chief Marketing Officer as a good example.
Another secret in successful use of patient portals is making physicians advocates of the portal. Although these professionals may not be the best agents in the portal oversight role, they can be of great importance when it comes to the portal use. The attitude of the patients toward the patient portal is a major determinant of how the patients are likely to adopt the technology. With this in mind, authorities can print out notepads where physicians can leave a “prescription” note for enrollment into the portal. Goel was of the idea that medical groups can promote the portal through opportunities outside the examination room [9]. The principle is to think creatively, such as playing a message that encourages patients to take advantage of online portals instead of playing on-hold music. Similarly, laboratory results, bills and other paper mailings can be used inform patients that online portals are more convenient and quicker. In other words, it is important to take advantage of every contact with the patient in promoting the use of the portal.
Research has indicated that success in the use of patient portals is likely to be achieved if the portal is developed in such a way that it contains features that patients care about most as this attracts them. For example, proxy access of caregivers of older individuals or minor patients has been proven to be one of the most powerful features. Other high ranking features include bill payment, education materials for patients, and online refill requests. Surprisingly, portals that focus on convenience before privacy are the most successful. Nevertheless, privacy remains to be an important consideration in the development of a patient portal. To many patients, a privacy breach only becomes a reality when it happens. Patients are more concerned about their convenience than their privacy. For this reason, some companies fall due to security breaches but recover because they have a high convenience factor [10].
Even before a patient portal is made available for use by the target audience, the development of the portal has to incorporate specific features if success is to be achieved at the utilization level. Previous successes and failures have made researchers to make conclusions on the most important features to be made part of a patient portal. To begin with, a good patient portal must have a top-notch interface, which means that it should have an interface that makes an easy-to-use platform. The portal should make it easy for patients to request or cancel appointments, make payments, access patient forms, and manage their health records. Secondly, Irizarry affirmed that well developed patient portals must contain the recall notification feature [11]. In this, patient reminders can be achieved through push notifications, text messages, or automated emails. If this factor is considered and implemented, the physicians can increase their work efficiency without necessarily having to involve the staff [12].
Simple functionality has been reported as an important feature of a good patient portal. Senior citizens and those with chronic conditions will only use online portals if the use of such portals makes their work easier than having to visit a doctor. A portal with a carefully designed functionality can give an organization an advantage over another portal developer if it is designed in such a way that it can serve the right purpose. On the minimum, patients should be able to use the portal to upload or download medical information, update their medical history, and book quick appointments [13].
In addition to providing basic information, well developed patient portals should provide additional information. This means that the portal should provide the patients with the flexibility of gaining access to as much information as possible in addition to getting appropriate insights on their reports. Whether it is information about immunization, medical diagnoses, or medical procedures, it is vital to develop a portal in such a way that it can offer such options. Apart from a well-built patient portal, there is a need to make sure that the portal can increase quality by encouraging the patient [14]. To achieve this, a personalized message from the physician can be incorporated into the portal in such a way that patients are informed about the best ways to improve their health and wellness and the associated benefits. Therefore, a proactive outreach from the physician can be of great help.
Patient portal developers, physicians, and patients have previously highly ranked portals with an excellent database record. In this regard, a patient portal should be able to reflect history on the doctors who have previously treated a particular patient. At the same time, the portal should reflect illness history, diagnosis history, and medication history. In addition to saving time, physicians find it easy to understand the root cause of the illness. One of the important features of a well-developed patient portal has got do with its availability. Since emergencies can occur anytime of the day or night, the patient portal should contain a doctor-on-call feature. Through this feature, patients should be able to get instant help from a physician.
The rate at which patient portals are being used in the United States is a clear indication that they are going to be very important in the future of healthcare systems as these systems continue to rely on EHRs and other important digital constructs. However, the adoption and use of patient portals is not as simple as many may think. Rather, the adoption and use of these digital tools happens amid a collection of challenges or pitfalls. As a matter of fact, many researchers have explained that this innovation is yet to prove its worth [15,16].
Experts have noted that the challenges of patient portals have little to do with the provider market, which remains hesitant. The argument is that much of the pitfalls have to do with patients, who happen to be the targeted subjects. When portals are developed to target the young users, their adoption and use is not as challenging as in cases where the older patients are targeted. Patients above the age of 65 have usability and security issues that hamper the use of portals, requiring help from doctors or family members. The challenge is complicated by the fact that the patient population is characterized by older patients. What is more, this is not expected to change any time soon. For example, the US had 42.5 million older patients, a figure expected to increase to be as high as 98 million by 2060. Despite the fact that the main reason why patient portals are developed is to help in the management of the chronic issues and complex health needs associated with older patients, these patients find it difficult to use the portals. This is attributed to the low level of digital literacy among this section of the population.
Health policies, ICT policies and related regulations may not be in a position to support the successful adoption and use of patient portals as currently constituted. Most states lack ICT policy integration in matters relating to health and e-Health. The health care field is a sensitive area and the lives of people are always at risk. There is also the lack of synchronism among the American ICT policies and e-Health. The US Department of Health and Human Services has not set up proper guidelines that govern individuals’ information in regard to e-Health services, placing the electronic health information of patients at risk. Therefore, this may lead to an adoption barrier of patient portals in the country as most people may fear for the safety and privacy of the sensitive data they provide. Legislation and standards on eHealth are crucial in all countries for successful patient portal adoption [17]. Regrettably, satisfactory standards for software transmission, architecture, infrastructure, medical informatics, medical imaging, interoperability and bioinformatics are yet to be well developed in most states. There is inadequate electronic legislation in USA, which negatively impacts on aspects of eHealth. This creates a gap in the legal framework on matters of data protection and privacy.
Patient portal adoption in USA is hampered by the challenge of resistance to change. The resistance may come from both the health care providers and the patients targeted by the implementation. The health care providers may be resistant to shift to patient portals because of the fear that their jobs will be at stake. They may also be resistant to any form of change that disrupts the way they have always done things in their working environment. On the other hand, the residents of rural America may be reluctant to shift to the new innovation because they may want to cling to the old manual system of seeking health care services. The targeted recipients of the innovation are also not fully conversant with the internet use despite the high internet penetration in USA. This will be a challenge to adoption of patient portals in the future because the recipients may show some form of resistance to change.
The challenge brought about by poor ICT infrastructure in some regions or states should not be ignored when implementing patient portals. In rural America the involved Department has minimal infrastructure in place. At the same time, there is lack of awareness among the staff in the Department. What is more, ICT staff in health sector lacks the necessary skills in health informatics. Though there is a high internet penetration in USA, the bandwidth is a major challenge in some regions, thereby limiting the adoption of eHealth applications such as patient portals [17].
Financial constraints may also affect the adoption of patient portals in different regions. The health sector is not funded to the levels that it should be for effective adoption of such innovations, especially for the health systems based in the rural areas. Development of eHealth infrastructure may be costly and demands for additional funding in the health sector. A study by the world Health Organization (WHO) indicated that inadequate funding is a major challenge to adoption of mHealth services in a number of countries (WHO 2013) [18].
Security and privacy issues remain major challenges in the use of patient portals. This is based on the fact that it is a challenge to authenticate users. In other words, it is not always easy to tell whether the patient is who he/she is claiming to be. Additionally, the patient portal website has to be hosted on the Internet, thereby exposing it to different vulnerabilities and threats. There is a need to make sure the highly sensitive information is protected from hacking activities of people with ill motives. In terms of privacy, parents to minors have may be in a dilemma when it comes to the information they should have access to without a signed authorization from the minor.
Another challenge in the adoption and use of patient portals is the low levels of health literacy among Americans. Health literacy should be understood as the ease with which an individual can obtain, understand, and process fundamental health services and information needed when making health decisions. Public health systems and health care institutions have a critical role to play in health literacy since their actions can make it difficult or easier for individuals to find and use health services and information. The problem becomes more serious due to the fact that poor health literacy is difficult to identify. As a matter of fact, individuals with a high level of health literacy may face challenges. This happens if one is not very familiar with how his/her body works or with medical terms or even when one finds it difficult to interpret numbers. In the U.S, the proportion of adults with proficient health literacy is as low as 12%. This is an indication that over a third of the adult population in the United States has challenges when it comes to execution of basic health tasks such as adhering to medications. What is more, the issue of poor health literacy affects adults in all ethnic and racial groups. However, some disparities in specific statistics do occur. For example, Hispanic adults are more hit by this problem than white adults with 65% and 28% individuals with literacy levels below the basic level respectively.
Although the adoption of patient portals is faced by the aforementioned challenges, it is encouraging to note that most of these challenges can be overcome through specific strategies. Firstly, as the government needs to come up with stringent measures that will ensure the security and integrity of patient data is maintained. This recommendation is based on the fact that different regions experiences data security and privacy concerns. The strict measures should include a number of legislations as well as how to implement the developed legislations. Privacy and security concerns are major issues in all eHealth services and therefore the need of having specific privacy policies and regulations in place to guarantee the patients of the safety of the information they provide.
Secondly, there is need to train the health care providers and patients on the use and benefits of patient portals. This will address the issue of resistance from both sides. The patients should be trained on proper use of these portals applications to make it easier for them to familiarize with these applications and break their fears. The training should address all the concerns from both parties.
Information and communication technology (ICT) infrastructure is a very vital element in the effective implementation of eHealth innovations. Therefore, the relevant Department should improve the ICT infrastructure all over the country, including the rural areas, if the implementation of patient portals is to be successful. The ICT sector should also address the challenge of internet connectivity, especially in rural areas. There is also a need for them to partner with NGOs and private companies to improve ICT infrastructure for eHealth applications. The mobile service providers should also implore 4G network coverage in all areas.The health sector funding impacts the adoption of eHealth. The government should channel more funds to the health sector to improve it to a level deemed appropriate to accommodate changes brought about by the patient portal implementation. Addressing corruption in the various governmental sectors will help curb the embezzlement of public funds. The funds can be in turn directed to the health sector. Strict measures should be taken on those involved in corruption [7,8].
It is very clear that the major challenge in the adoption and use of patient portals is the security and privacy aspects. For this reason, researchers have argued that the use of patient portals can be improved by tackling this problem. To begin with, there is a need to ensure that the development of the patient portals meet the security and privacy requirements provided by the state in its regulations of the exchange of information between care receivers and care providers. Providers of patient portal platforms must utilize Certified Electronic Health Record technology (CEHRT). Another way to improve the security and privacy of patient portals is to make sure that the patient data is encrypted. This move is a good way to ensure that the data is protected when it is in transit or stored in some locations. Even when intercepted or stolen, encrypted data is meaningless to the unauthorized user. The data makes sense to the authorized recipients after they use a decryption code to convert the coded data to plain text [7,8]. The use of 256-bit encryption is preferred as the most effective form of encryption. Even in cases where an organization deems encryption as unnecessary, it is important to document the reasons for this decision.
Previous studies have also recommended the use of role-based access control in handling the security and privacy issues experienced in the use of patient portals. This means that a regulation is put in place to grant information access to specific employees or users based on their role in the organization. For instance, the data revealed to nursing staff may not be the same as the data revealed to the administrative staff. The best idea is to consider the information needed by a certain employee and grant access to just what is needed by such an employee.
Just like in other portals and applications with the user login aspect, the use of extensive password protection is necessary when dealing with the security issue in the application of the patient portal innovation. A well developed patient portal must require the patients to use a password whenever the need to access the portal as well as when there is a long period of inactivity. To increase the security of a portal, a user account should be locked if a password is entered incorrectly for several times. Another strategy is to ensure that all user accounts have strong or complex passwords, which can be achieved through the use of special, numeric, and alpha characters in the same password. Security experts argue that requiring users to change their passwords after every 60 days can decrease the probability of being hacked. Further validation of users can be done through additional security questions, such as the favorite city. Two-factor authentication should also be used by integrating the EHR and the patient portals in such a way that the patient receives a message into his or her mobile phone containing a security code to use when gaining access to the portal [19].
Audit trails can also be used to improve the security of patient portals as they allow the providers to record major activities. If period reviews are conducted, it becomes easy to reduce the risk of inappropriate access and developed a culture of accountability and responsibility. Every employee with access to patient portals must be made part of a robust training that entails specific security agreements and policies. In addition to audit trials, it is necessary to make sure that the patient portals can display patient consent forms in a printable fashion. Of all the types of consent forms, the most important is the opt-in agreement where patients have a clear understanding of the particulars of the portals and agree to take the involved risk. It is also important to encourage providers to have a custom privacy policy as well as terms of conditions of access. These should outline how the health organization deals with the privacy of the sensitive information collected about the patients [11].
The literature review has revealed that the use of patient portals began back in the 1990s but only gained popularity in 2006 due to some specific reasons. Since their introduction, patient portals have allowed doctors, patients, and administrators to enjoy a number of benefits. Patients have used these portals to improve self-management of active treatments and adherence to medication. In addition to being used a tool to reduce the number of visits to the doctor, patient portals have been used by administrators to reduce the cost of care. The almost universal penetration of smartphones in the United States and improved ownership of other information devices have been the major factors facilitating the adoption and use of patient portals. To achieve success in the use of patient portals, proper selection of portal leaders, patient engagement, and marketing must be done. In terms of the appropriate features, the portal should have a top-notch interface, simple functionality, additional information, and an excellent database record. The adoption and use of patient portals happens amid a collection of challenges or pitfalls. Older patients find it difficult to use these portals due to digital literacy issues and security-based features. ICT policies in the utilization of eHealth in USA are yet to be developed to the required level. Again, resistance to change by both the patients and health care providers has been a barrier as well as financial constraints and fears based on security and privacy of the sensitive data. However, it is made clear that these challenges can be overcome through specific strategies. Although the research on this area is extensive is extensive, it remains somewhat inconclusive. Therefore, there is a need to explore more on the phenomenon of barriers to the use of patient portals in the United States.
This chapter was developed to present the methods preferred in the course of the study as well as justifications for the methodological choices made. The study setting section specifically describes where the study was based. The next section outlines the research design on which the study was based. There is also a discussion on the data sources for the study together with recognition of the advantages of the preferred source. In another section, it was important to describe the study population, particulars of the sampling technique, and the sample size. The two data collection instruments are discussed in this chapter together with their strengths. The other aspects of the chapter are the ethical considerations and methodological limitations.
The study was carried out at Baptist Memorial Health Care Corporation (BMHCC), which is located in Memphis, Tennessee. The medical facility has grown to a significant level since it began operating in 1912 and is now in a position to meet the needs of communities it serves. Its selection as the setting for this study was partially based on the fact that it is one of the largest privately owned hospitals in the nation and is involved in use of innovative technology for excellence in patient care, MyChart patient portal being one of these innovations.
The research design selected in a particular study largely depends of the focus of the study. This study focused on identification of potential barriers that affect patients’ ability to access patient portals. According to Creswell & Clark, research design is a term used to refer to the general strategy utilized by researchers when integrating different components of a study into a logical and coherent way [20]. The research problem is explored effectively if the most appropriate study design is selected at the initial stages of the study. Based on this, Neuman (2013) affirmed that a research design should be understood as a blueprint used by researchers in the process of data collection and analysis [21]. Quantitative and qualitative designs are the major research designs used in data collection and analysis. However, the two designs are used together in the same study creating what is called a mixed methods research design.
To successfully achieve the aim of the study, it was necessary to use a mixed methods design to make it possible to collect both qualitative and quantitative data. The qualitative aspect of the study involved collection of primary data from helpdesk agents who work at BMHCC. On the other hand, the quantitative aspect of the study was based on data collection from these sample population using an online questionnaire.
There are two types of data sources in research in the form of primary and secondary sources. Data is said to have been sourced from primary sources if it is collected from actual subjects or participants in real time [19]. On the contrary, secondary sources are made up of already documented information. The data collected in this study was obtained from primary sources since actual participants were involved. The use of primary data in this study was an advantage as it allowed the researcher to collect up-to-date information from the helpdesk agents. At the same time, the primary sources were used to avoid the risk of invalid data associated with some secondary sources, and indication that primary data is more trustworthy than secondary data.
A research population is defined as a collection of people or subjects characterized by similar features or traits [21]. However, the person conduction the study is always to select a set of subjects to base the study on referred to as the sample. This is recommended because the financial and time constraints may not allow one to study the entire target population. For this study, the study population was made up of all the help desk agents working for BMHCC. However, only 22 agents were included in the sample using a set of specific criteria. The inclusion criteria required the agents to have been trained on the MyChart administration feature, have been employed for more than 30 days, and have received calls in regards to MyChart access. Simple random sampling method was used to select the 22 employees from the help desk agents. Here, after an ethical approval from the BMHCC, the names of all the help desk agents put in a box after which 22 names were drawn from the box independently and made part of the sample population. The most significant advantage of this sampling method is its ease of use. For example, there was no need to divide the target population into sub-populations unlike in stratified sampling. Moreover, the simple random sampling method allowed the researcher to obtain an unbiased representation of the study population [21]. This was possible because every agent has an equal chance of being made part of the sample.
Since the study utilized a mixed methods research design, there was a need to use interviews and questionnaires as the data collection instruments. The survey questionnaires were made up of open-ended questions to make it easier to analyze the collected quantitative data. This questionnaire was created on esurveycreater.com and a link to the survey was distributed via e-mail by the Director of Customer Support at BMHCC. The many advantages associated with online questionnaires encouraged their use in this study. To being with, the researcher was aware that the help desk agents are great Internet consumers and have the basic skills needed by an individual to fill an online questionnaire. Unlike in traditional methods of data collection, the online questionnaire greatly reduced the time required in the collection of data [20]. For this reason, the time needed to complete the project was reduced, which allowed the researcher to save the cost involved.
More cost saving was made possible by the fact that the cost of posting the questionnaires to the participants through the post office was eliminated as well as the cost of recording data into the database. It should be appreciated that responses provided through theses questionnaires were recorded into the database automatically and authorized people could access the data at any time. An additional reason why questionnaires were preferred is that they can be used to collect large amounts of data from many individuals within a short period of time [20]. The tool was ideal for data collection as it made it possible to reach the participants regardless of their geographical location. Once they received a link of the survey questionnaire, the participants would react to the questions at any time within the data collection period. This made the tool more convenient than tools that require the participants to a specific section of their day to respond to the questions. More importantly, questionnaires are generally more confidential in nature than most methods of data collection. This increased the response rate as the participants felt safe to share even sensitive information.
The survey questionnaire was pretested using 3 individuals selected from the sample to make sure that they met the inclusion criteria. These participants were required to fill the online questionnaires as they would during the actual study. They shared their thoughts about different aspects of the questionnaire and the questions. Using the insights provided by the three participants, the researcher made necessary improvements before the actual study. For example, irrelevant and ambiguous questions were eliminated. Again, the length of some questions was reduced to make sure that they were short and strait forward as possible.
Collection of qualitative data from the five help care desk agents selected from the 22 participants was done use face-to-face interviews. The interview process was as illustrated in (Figures 1-18) and tables (Tables 1-19).
Table 1. Sample profile (Table 1 is a description of the results of the different parameters of the sample, such as the mean, standard deviation, median, mode, variance, skewness, range, minimum, maximum, Kurtosis, and sum.) a= Multiple modes exist. The smallest value is shown
Participants |
How long have you been assisting patients/
callers with accessing their Baptist MyChart? |
When taking a MyChart call,
the most requested assistance is? |
From your experience,
which devices are being used by the callers/patients
when calling into have their password reset? |
When a patient/caller calls back after
having their password reset, which of the
following do you see the most? |
Attempting to log in
into the wrong website |
Attempting to log in
via the MyChart App |
Requesting help with navigating
inside of MyChart |
I find that most of my
MyChart callers/patients are? |
What is the average age of your
MyChart callers/patients? |
From my observation while assisting
patients/callers with accessing their MyChart account,
I have noted (rate each option). |
That they are comfortable
with using MyChart portals |
N |
Valid |
19 |
19 |
19 |
19 |
0 |
19 |
19 |
19 |
19 |
19 |
0 |
19 |
|
Missing |
3 |
3 |
3 |
3 |
22 |
3 |
3 |
3 |
3 |
3 |
22 |
3 |
Mean |
- |
39393088.79 |
2.00 |
2.00 |
2.26 |
|
1.95 |
0.140 |
2.53 |
1.58 |
2.58 |
|
2.16 |
Std. Error of Mean |
- |
1958762.984 |
0.286 |
0.000 |
0.104 |
|
0.162 |
1.00 |
0.177 |
0.192 |
0.139 |
|
0.191 |
Median |
- |
41344575.00 |
1.00 |
2.00 |
2.00 |
|
2.00 |
1 |
3.00 |
1.00 |
3.00 |
|
2.00 |
Mode |
- |
4135937a |
1 |
2 |
2 |
|
2 |
0.612 |
3 |
1 |
3 |
|
3 |
Std. Deviation |
- |
8538049.903 |
1.247 |
0.000 |
0.452 |
|
0.705 |
0.374 |
0.772 |
0.838 |
0.607 |
|
0.834 |
Variance |
- |
########## |
1.556 |
0.000 |
0.205 |
|
0.497 |
0.924 |
0.596 |
0.702 |
0.368 |
|
0.696 |
Skewness |
- |
-4.359 |
0.576 |
|
1.170 |
|
0.074 |
0.524 |
-1.390 |
0.990 |
-1.168 |
|
-0.322 |
Std. Error of Skewness |
- |
0.524 |
0.524 |
0.524 |
0.524 |
|
0.524 |
0.038 |
0.524 |
0.524 |
0.524 |
|
0.524 |
Kurtosis |
- |
18.999 |
-1.521 |
|
-0.178 |
|
-0.766 |
0.171 |
-0.775 |
0.582 |
0.582 |
|
-1.488 |
Std. Error of Kurtosis |
- |
1.014 |
1.014 |
1.014 |
1.014 |
|
1.014 |
1.014 |
1.014 |
1.014 |
1.014 |
|
1.014 |
Range |
- |
37407465 |
3 |
0 |
1 |
|
2 |
2 |
2 |
2 |
2 |
|
2 |
Minimum |
- |
4135937 |
1 |
2 |
2 |
|
1 |
1 |
1 |
1 |
1 |
|
1 |
Maximum |
- |
41543402 |
4 |
2 |
3 |
|
3 |
3 |
3 |
3 |
3 |
|
3 |
Sum |
|
748468687 |
38 |
38 |
43 |
|
37 |
28 |
48 |
30 |
49 |
|
41 |
Table 2. Response Rate (Table 2 clearly indicates that the response rate in this study was 19 out of the 22 participants enrolled into the study, which was 86.4% of the total sample)
Participant# |
|
Frequency |
Percent |
Valid Percent |
Cumulative Percent |
Valid |
4135937 |
1 |
4.5 |
5.3 |
5.3 |
|
41318658 |
1 |
4.5 |
5.3 |
10.5 |
|
41318679 |
1 |
4.5 |
5.3 |
15.8 |
|
41318979 |
1 |
4.5 |
5.3 |
21.1 |
|
41323813 |
1 |
4.5 |
5.3 |
26.3 |
|
41326388 |
1 |
4.5 |
5.3 |
31.6 |
|
41327464 |
1 |
4.5 |
5.3 |
36.8 |
|
41337069 |
1 |
4.5 |
5.3 |
42.1 |
|
41342096 |
1 |
4.5 |
5.3 |
47.4 |
|
41344575 |
1 |
4.5 |
5.3 |
52.6 |
|
41344891 |
1 |
4.5 |
5.3 |
57.9 |
|
41346223 |
1 |
4.5 |
5.3 |
63.2 |
|
41347359 |
1 |
4.5 |
5.3 |
68.4 |
|
41347606 |
1 |
4.5 |
5.3 |
73.7 |
|
41352324 |
1 |
4.5 |
5.3 |
78.9 |
|
41353054 |
1 |
4.5 |
5.3 |
84.2 |
|
41361170 |
1 |
4.5 |
5.3 |
89.5 |
|
41379000 |
1 |
4.5 |
5.3 |
94.7 |
|
41543402 |
1 |
4.5 |
5.3 |
100.0 |
|
Total |
19 |
86.4 |
100.0 |
|
Missing |
System |
3 |
13.6 |
|
|
Total |
|
22 |
100.0 |
|
|
Table 3. Participants’ experience (Table 3 shows responses of the participants concerning the number of years they have assisted patients at Baptist to access MyChart portal)
|
Frequency |
Percent |
Valid Percent |
Cumulative Percent |
Valid |
1-2 Years |
11 |
50.0 |
57.9 |
57.9 |
|
3-4 Years |
5 |
22.7 |
26.3 |
84.2 |
|
4 or more Years |
3 |
13.6 |
15.8 |
100.0 |
|
Total |
19 |
86.4 |
100.0 |
|
Missing |
System |
3 |
13.6 |
|
|
Total |
|
22 |
100.0 |
|
|
Table 4. The most requested assistance when taking a MyChart call (Table 4 presents the results of the question on the most requested assistance when taking a MyChart call. It is clear that 86.4% of the respondents stated that the most sought assistance by their patients was login issues)
|
Frequency |
Percent |
Valid Percent |
Cumulative Percent |
Valid |
Login Issues |
19 |
86.4 |
100.0 |
100.0 |
Missing |
System |
3 |
13.6 |
|
|
Total |
|
22 |
100.0 |
|
|
Table 5. Devices preferred by participants when making password reset requests (Displays results on the devices used by the patients when making a password reset request. The percentage of participants was 63.6% and 22.7% for cell phones and computers respectively)
|
Frequency |
Percent |
Valid Percent |
Cumulative Percent |
Valid |
Cell Phone |
14 |
63.6 |
73.7 |
73.7 |
|
Computer |
5 |
22.7 |
26.3 |
100.0 |
|
Total |
19 |
86.4 |
100.0 |
|
Missing |
System |
3 |
13.6 |
|
|
Total |
|
22 |
100.0 |
|
|
Table 6. Individuals who attempt to log into the wrong website (The above results can are presented in a better way in the graph presented in figure 5)
|
Frequency |
Percent |
Valid Percent |
Cumulative Percent |
Valid |
1 |
5 |
22.7 |
26.3 |
26.3 |
|
2 |
10 |
45.5 |
52.6 |
78.9 |
|
3 |
4 |
18.2 |
21.1 |
100.0 |
|
Total |
19 |
86.4 |
100.0 |
|
Missing |
System |
3 |
13.6 |
|
|
Total |
|
22 |
100.0 |
|
|
Table 7. Individuals who attempt to log via the MyChart App
|
Frequency |
Percent |
Valid Percent |
Cumulative Percent |
Valid |
1 |
11 |
50.0 |
57.9 |
57.9 |
|
2 |
7 |
31.8 |
36.8 |
94.7 |
|
3 |
1 |
4.5 |
5.3 |
100.0 |
|
Total |
19 |
86.4 |
100.0 |
|
Missing |
System |
3 |
13.6 |
|
|
Total |
|
22 |
100.0 |
|
|
Table 8. Individuals who request help with navigating inside of MyChart
|
Frequency |
Percent |
Valid Percent |
Cumulative Percent |
Valid |
1 |
3 |
13.6 |
15.8 |
15.8 |
|
2 |
3 |
13.6 |
15.8 |
31.6 |
|
3 |
13 |
59.1 |
68.4 |
100.0 |
|
Total |
19 |
86.4 |
100.0 |
|
Missing |
System |
3 |
13.6 |
|
|
Total |
|
22 |
100.0 |
|
|
Table 9. Level of patients’ satisfaction with the log in process (Table 9 shows the results the results of the question on the level of satisfaction of the patients with the login process. 54.5% of the help desk agents stated that their patients are satisfied with the login process. 13.6% of the participants stated that their patients are frustrated with the login process while 18.2% of the participants affirmed that their patients are indifferent about the login process)
|
Frequency |
Percent |
Valid Percent |
Cumulative Percent |
Valid |
satisfaction with the log in process |
13 |
54.5 |
63.2 |
63.2 |
|
Are frustrated with the login process |
3 |
13.6 |
15.8 |
78.9 |
|
Indifferent about the login process |
4 |
18.2 |
21.1 |
100.0 |
|
Total |
19 |
86.4 |
100.0 |
|
Missing |
System |
3 |
13.6 |
|
|
Total |
|
22 |
100.0 |
|
|
Table 10. Average age MyChart patients (Table 10 shows the responses provided by the participants about the average age of their MyChart patients. 4.5% of the participants stated that their patients had and an average age of between 19 and 30 years. 27.3% of the participants were aged between 31 and 49 years while 54.5% of the participants were aged between 50 and 70 years). The information provided in table 10 is presented in a better way in figure 9
|
Frequency |
Percent |
Valid Percent |
Cumulative Percent |
Valid |
Between ages of 19-30 |
1 |
4.5 |
5.3 |
5.3 |
|
Between ages 31-49 |
6 |
27.3 |
31.6 |
36.8 |
|
Between ages 50-70 |
12 |
54.5 |
63.2 |
100.0 |
|
Total |
19 |
86.4 |
100.0 |
|
Missing |
System |
3 |
13.6 |
|
|
Total |
|
22 |
100.0 |
|
|
Table 11. Individuals who are comfortable with the use of MyChart portal (Table 11 captures the number of participants who thought that their patients are comfortable with the use of MyChart portal)
|
Frequency |
Percent |
Valid Percent |
Cumulative Percent |
Valid |
25% |
5 |
22.7 |
26.3 |
5.3 |
|
50% |
6 |
27.3 |
31.6 |
36.8 |
|
75% |
8 |
36.4 |
42.1 |
100.0 |
|
Total |
19 |
86.4 |
100.0 |
|
Missing |
System |
3 |
13.6 |
|
|
Total |
|
22 |
100.0 |
|
|
Table 12. Individuals who feel uncertain when using MyChart Portal (Table 12 is a representation of the individuals who feel uncertain using MyChart portal)
|
Frequency |
Percent |
Valid Percent |
Cumulative Percent |
Valid |
25% |
13 |
59.1 |
68.4 |
68.4 |
|
50% |
4 |
18.2 |
21.1 |
89.5 |
|
75% |
2 |
9.1 |
10.5 |
100.0 |
|
Total |
19 |
86.4 |
100.0 |
|
Missing |
System |
3 |
13.6 |
|
|
Total |
|
22 |
100.0 |
|
|
Table 13. Individuals who feel pressured to use MyChart portal (Table 13 is important in presenting the results of the individuals who feel pressured to use MyChart portal)
|
Frequency |
Percent |
Valid Percent |
Cumulative Percent |
Valid |
25% |
11 |
50.0 |
57.9 |
57.9 |
|
50% |
5 |
22.7 |
26.3 |
84.2 |
|
75% |
3 |
13.6 |
15.8 |
100.0 |
|
Total |
19 |
86.4 |
100.0 |
|
Missing |
System |
3 |
13.6 |
|
|
Total |
|
22 |
100.0 |
|
|
Table 14. Major barrier to the access of MyChart portal by patients (Table 14 sows the results obtained through the question on the major barrier to the access of MyChart portal by patients. 81.8% of the participants stated that lack of computers or phone skills is the major barrier to the use of the MyChart portal by patients while 4.5% of the participants were of the idea that difficulty in spelling was the major barrier)
|
Frequency |
Percent |
Valid Percent |
Cumulative Percent |
Valid |
Lack of Computer/phone skills |
18 |
81.8 |
94.7 |
94.7 |
|
Difficulty with Spelling |
1 |
4.5 |
5.3 |
100.0 |
|
Total |
19 |
86.4 |
100.0 |
|
Missing |
System |
3 |
13.6 |
|
|
Total |
|
22 |
100.0 |
|
|
Table 15. Readiness of callers to give out their identifying information
|
Frequency |
Percent |
Valid Percent |
Cumulative Percent |
Valid |
Yes, very reluctant |
6 |
27.3 |
31.6 |
31.6 |
|
No, they seem happy that we are securing their records by verifying their personal information |
13 |
59.1 |
68.4 |
100.0 |
|
Total |
19 |
86.4 |
100.0 |
|
Missing |
System |
3 |
13.6 |
|
|
Total |
|
22 |
100.0 |
|
|
Table 16. What happens when proxy access is requested (Table 16 presents the results on the question on what happens when a caller requesting access (login information) to another users MyChart account and proxy access is questioned by the help desk agent to the caller. 4.5% of the participants stated that their patients know what proxy access is while 9.1% of the participants stated that their patients would ask what proxy access is in such circumstances. 36.4% of the participants specified that their patients say that that have proxy access but the patients do not have access, requiring the agents to provide introduction on how to get access. Another 36.4% of the participants stated that their patients say that they have proxy access but do not have the same, requiring the agent to advise them the patients to have the other patient call in)
|
Frequency |
Percent |
Valid Percent |
Cumulative Percent |
Valid |
Know what proxy access is |
1 |
4.5 |
5.3 |
5.3 |
|
Ask what proxy access is |
2 |
9.1 |
10.5 |
15.8 |
|
Say that they have proxy access, but you find that they do not have access and provide instruction getting the access |
8 |
36.4 |
42.1 |
57.9 |
|
They say they have proxy access, but they do not. Advise them to have the patient call in |
8 |
36.4 |
42.1 |
100.0 |
|
Total |
19 |
86.4 |
100.0 |
|
Missing |
System |
3 |
13.6 |
|
|
Total |
|
22 |
100.0 |
|
|
Table 17. What to look for when checking for proxy access (Table 17 shows the results of the question on what care agents look for when checking for proxy access in a patient’s MyChart account. 72.7% of the participants stated that they look for a person’s name that is a blue hyperlink while 13.6 of the respondents specified that they look for a any name listed under suggested or emergency contact)
|
Frequency |
Percent |
Valid Percent |
Cumulative Percent |
Valid |
A person’s name that is a blue hyperlink |
16 |
72.7 |
84.2 |
84.2 |
|
A person listed under suggested or emergency contact |
3 |
13.6 |
15.8 |
100.0 |
|
Total |
19 |
86.4 |
100.0 |
|
Missing |
System |
3 |
13.6 |
|
|
Total |
|
22 |
100.0 |
|
|
Table 18. How to set the proxy access feature (Table 18 shows the results of the question that required the participants to share their thoughts about how to set the proxy feature in a MyChart photo. 18.2% stated that the proxy feature can be set by completing a form at the provider’s office only. 9.1% of the participants specified that this feature can be set by completing the request inside the patient’s MyChart account only while 59.1% of them stated that the feature can be set by completing a form at the provider’s office and by completing the request inside the patient’s account)
|
Frequency |
Percent |
Valid Percent |
Cumulative Percent |
Valid |
Completing a form at the providers office only |
4 |
18.2 |
21.1 |
21.1 |
|
Completing the request inside of the patients MyChart only |
2 |
9.1 |
10.5 |
31.6 |
|
Completing a form at the providers office and by completing the request inside of the patients MyChart |
13 |
59.1 |
68.4 |
100.0 |
|
Total |
19 |
86.4 |
100.0 |
|
Missing |
System |
3 |
13.6 |
|
|
Total |
|
22 |
100.0 |
|
|
Table 19. Thoughts on the recently implemented access request via email. Table 19 is a presentation of the results on the thoughts of the help care desk agents on the recently implemented request for access (password reset). 13.6% of the participants stated that the new access is a better way to request for access since it gives them all the information they need. 22.7% of the participants specified that the new access is better but requires them to contact the patient to verify his/her identity since most identifying information is not provided. Lastly, 50% of the participants thought that the new access is less effective as it requires them to search for the patient’s identity since most identifying information is not provided in the email
|
Frequency |
Percent |
Valid Percent |
Cumulative Percent |
Valid |
A better way for request for access to be handled, I have all the information that is needed |
3 |
13.6 |
15.8 |
15.8 |
|
Better, but requires me to contact the patient to verify identify as most identifying information is not provided |
5 |
22.7 |
26.3 |
42.1 |
|
Less effective, as it requires me to look the patient up (most identifying information is not provided in the email |
11 |
50.0 |
57.9 |
100.0 |
|
Total |
19 |
86.4 |
100.0 |
|
Missing |
System |
3 |
13.6 |
|
|
Total |
|
22 |
100.0 |
|
|
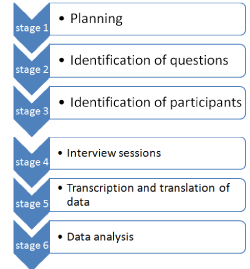
Figure 1. Interview process
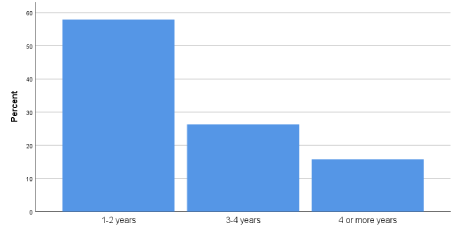
Figure 2. Participants’ experience (As seen above, 50% of the participants had assisted patients to access MyChart portal for 1-2 years. 22.7% of the participants had assisted the patients for 3-4 years while 12.6% of the participants had been assisting the patients for more than four years. This information is presented in a better way in the graph represented in figure 2
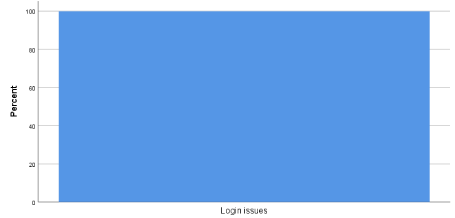
Figure 3. Most sought assistance when taking a MyChart call Results on the most requested assistance is presented in a graphical way
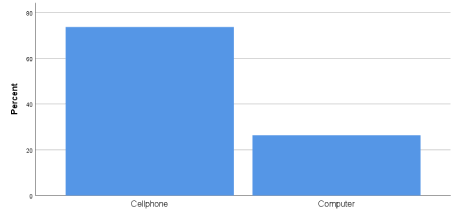
Figure 4. Devices preferred during password reset requests. (The results presented in table 6 captured the percentage of people who try to log into the wrong website when a patient/caller calls back after having their password reset)
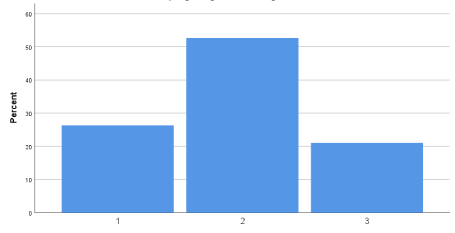
Figure 5. Individuals who attempt to log into the wrong website (The results presented in table 7 captured the percentage of people who try those who try to log in via MyChart App when a patient/caller calls back after having their password reset)
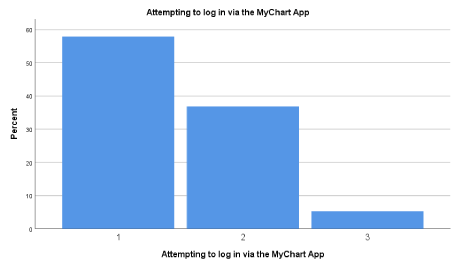
Figure 6. Individuals who attempt to log in via the MyChart App. (The results presented in table 8 captured the percentage of people who requested help with navigating inside of MyChart)
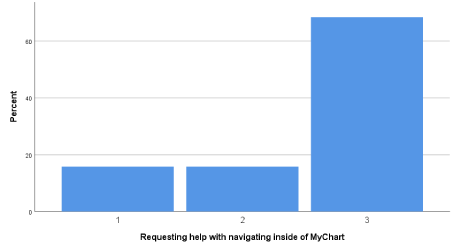
Figure 7. Individuals who request help with navigating inside of MyChart
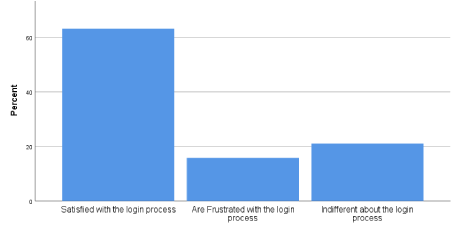
Figure 8. Level of patients’ satisfaction with the log in process
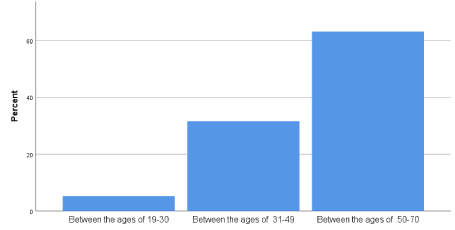
Figure 9. Average age of MyChart callers
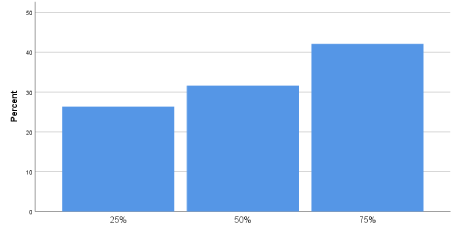
Figure 10. Individuals who are comfortable with the use of MyChart portal
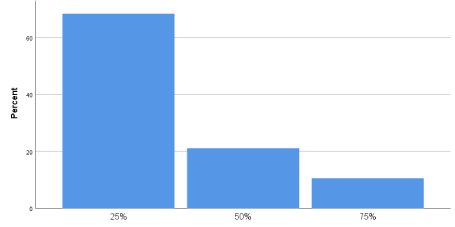
Figure 11. Individuals who feel uncertain when using MyChart Portal
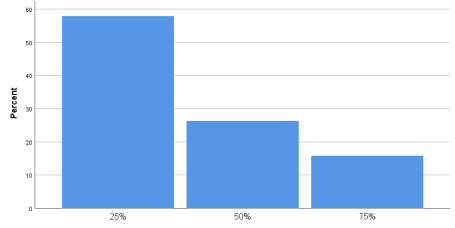
Figure 12. Individuals who feel pressured to use the MyChart portal
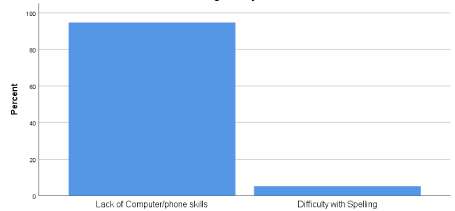
Figure 13. Major barrier in the access of MyChart portal (Results of the question on whether the callers are reluctant to give help desk agents identifying information required in the access of MyChart account are presented in table 15. 59.1% of the participants stated that their patients are not reluctant to give out their identifying information as they think that the identifying information is used by the help desk agents in the protection of the patients’ records. On the other hand, 27.3% of the participants stated that their patients are very reluctant to give out their identifying information)
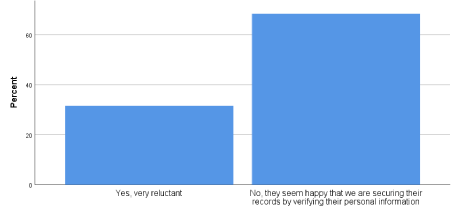
Figure 14. Readiness of callers to give out their identifying information
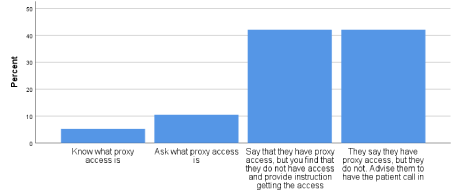
Figure 15. What happens when proxy access is requested
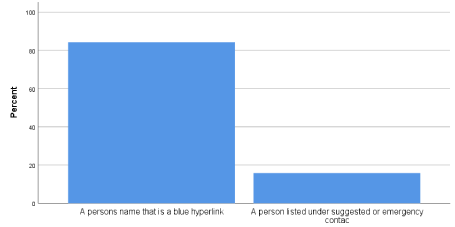
Figure 16. What agents look for when checking for proxy access in a patient’s MyChart account
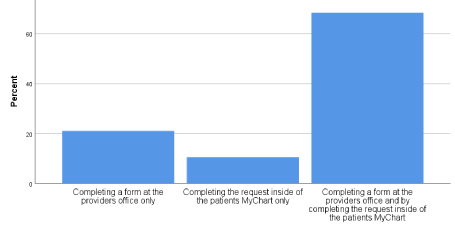
Figure 17. How to set the proxy access feature
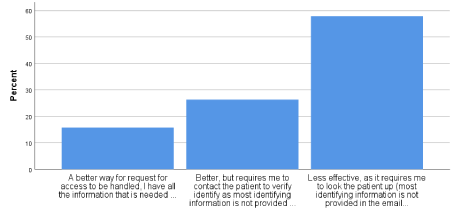
Figure 18. Thoughts on the recently implemented access request via email
The use of face-to-face interviews as another instrument in the process of data collection was preferred since such interviews have several advantages which can be used to overcome some limitations associated with questionnaires. Therefore, the data collection instrument increased the reliability of the study. One of the major advantages of face-to-face interviews is that they give the researcher a room to capture both verbal and non-verbal cues such facial expressions and body language [22]. This advantage allowed the data collector in this study to obtain more insights on the questions being asked. Also, it was possible for the data collector to identify when the interviewees were uncomfortable with the questions. Unlike when questionnaires are used, interviews allowed the interviewer to remain in control of the entire interview process in addition to keeping the interviews focused to completion. In other words, the interviewees were not subjected to distractions such as social sharing, web surfing, video streaming, and answering emails. At the same time, accurate screening of the participants was possible and more accurate data was obtained than when questionnaires are used. This is because the physical presence of the interviewer in the process of data collection may have discouraged the respondents from providing false information.
Since both qualitative and quantitative data were collected in this study, there was need to use qualitative and quantitative data analysis methods respectively. Analysis of quantitative data collected through the use of survey questionnaires was done using the inferential statistics aspects of Statistical Package for Social Sciences (SPSS) version 17.0. This package was important in determining statistical measures of the sample such as the mean, standard deviation, median, mode, variance, skewness, range, minimum, maximum, Kurtosis, and sum. For each research question, the researcher was interested in measuring the frequencies, percentages, and cumulative percentages. On the other hand, the analysis of qualitative data collected using face-to-face interviews was done through content analysis. Here, the specific aspects of the responses provided by the interviews were analyzed, with similar responses being grouped together to come up with reliable inferences [23-27].
In terms of the response rate, out of the 22 individuals made part of the sample, only 19 filled the questionnaires. However, all the five participants requested to become part of the interviews agreed to provide the sought data. The reliability of the data collection instrument was determined by using the student’s t-test to measure standard errors, such as the standard error of skewness, standard error of mean, and standard error of Kurtosis at p<0.001 level of significance. In the analysis of data generated from the interviews, the researcher used codes starting with PPP to stand for Patient Portal Project. In addition, a unique number was assigned to each participant to come up with PPP1, PPP2, PPP3, PPP4, and PPP5 as the codes for the five interviews.
Just like in any other study, there was a need to adhere to all relevant ethical principles in the process of carrying out this study. To begin with, ethical approval and permission was obtained from relevant authorities and institutions. For example, permission to use MyChart (Baptist’s Patient Portal) access data from MyChart Dashboard was requested from the Director-Medical Information Systems at BMHCC. Also, approval to circulate the survey to helpdesk agents was sought from the Director of Customer Support. Finally, the researcher gained IRB approval from Baptist Memorial Health Care Corporation IRB. As another ethical requirement, the researcher made sure that all the sampled help care desk agents were taken through the specifics of the research such as the focus, procedure or any risks following participation before they were asked to provide the required data. It is after this that the participants were given the consent forms to sign. The consent forms were used to reveal that individuals who took part in this study were not forced to do so but participated voluntarily. According to the details in the consent form, the participants were free to withdraw from the study at any time between enrollment and final stages of data collection without any fine.
The researcher was aware that confidentiality is an important aspect of a study. The need to achieve confidentiality in the study compelled the researcher to ensure that personal information provided by the agents was not made available to any individual who was not a party to the study. The use of interviews and survey questionnaires did not subject the participants to any physical, psychological, or emotional risk. The participants were specifically informed that their data was to be used for the study purpose only. A higher level of confidentiality was achieved by way of ensuring that only codes were used to identify the respondents rather than using names of the participants.
Despite the fact that online questionnaires were a source of a number of benefits, the instrument created notable limitations. The absence of the researcher when the participants were answering the questions may have encouraged some dishonesty. This can be circumvented in future by way of assuring the participants that a high level of privacy and confidentiality will be maintained. At the same time, some respondents may have interpreted the questions differently from others since there was no person to clarify the questions whenever a need arose as it is the case in interviews. Therefore, some of the answers provided by the help desk agents may have been subjective. To avoid such cases in future or to avoid skewed responses, it is important to use simple and easy-to-understand questions. The simple random sampling method used in the study may have created some limitations. For example, the method may have forced the researcher to over-select one gender thereby reducing the reliability of the data. Face-to-face interviews were also a source of some limitations for the study. Face-to-face interviews are expensive to schedule and conduct, a factor than increased the overall cost of the study. Additionally, the physical presence of the data collection in the interview sessions may have discouraged some interviews to provide sensitive information.
On the major issues hindering patients from accessing their MyChart portal, PPP1 stated, “I find the lack of computer skills to be the major stumbling block as my patients attempt to access their portals.” PPP2 and PPP5 had the same to say on this question. Different arguments were made by PPP3, who argued that, “Most of my patients are challenged by lack of cell phones.” The same assertion was obtained from PPP4.
On the level of patients’ satisfaction, PPP1 and PPP5 explained that their patients were very satisfied with the process of accessing their MyChart portal. PPP2 stated that the patients are somewhat satisfied with the access process while PPP3 and PPP4 explained that their patients are not satisfied with the access process.
Regarding the question on age disparities all the participants agreed that older patients seek help more than the younger patients. For example, PPP3 said, “Yes, help is sought by a higher proportion the older population than the younger population.”
When asked whether patients are reluctant when required to provide identifying information that is required to access their MyChart account, three interviewees said yes while two of them said no. For example, PPP2 stated, “Yes, patients find it hard to trust us with their personal information.”
When asked whether they experience proxy access challenges during patients’ access to MyChart Portal, all the interviewees said yes. For instance PPP4 argued, “Yes, I specifically find it challenging to respect the rights of underage patients.”
From the results presented in this chapter, it is clear that login issues are the major stumbling block in the adoption and use of MyChart portal. Again, the use of cell phones to access MyChart portal is preferred over the use of computers. The results have also indicated that a good number of patients attempt to log in to the wrong website when interested in accessing MyChart portal while others find it difficult to navigate the aspects of MyChart portal. However, it is encouraging to note that more than half of the participants stated that their patients satisfied with the log in process. The chapter has also revealed that lack of computer or phone skills is the major barrier to access of MyChart portal. Further challenges identified in this chapter include authentication and literacy level problems.
The results from this study indicate that patients find it difficult to use MyChart portal, especially due to the problems they experience when trying to access these portal. Specifically, it is clear that the major challenge is achieving proper login into the portal. Poor education background that leads to poor spelling skills may make it hard for patients to log in into portal since even spelling the username or password correctly is a challenge. Even after password reset, the spelling mistakes and poor education background make it difficult for some patients to browse the right website when trying to access their portals. The results have also indicated that most of the patients at BMHCC are aged between 50-70 years. Such individuals are mainly disadvantaged when it comes to the use of innovations such as patient portals since their health and digital literacy are relatively poor.
The results obtained in this study have indicated that most help care desks deal with patients with a low level of satisfaction in the use of MyChart portal. This can be attributed to the fact there are many barriers hindering patients from having an easy time when trying to access their MyChart portal. According to this study, lack of computer or phone skills is top in the list of the possible barriers. As a matter of fact, some patients feel that they are pressured to use the MyChart portal. According to some of the help care desk agents studied, employees are reluctant to give out their identifying information. This is a major challenge for the agents since it can be difficult to help their employees without specific identifying information such as the full names and social security number.
Another set of barriers in the access of MyChart portal by patients has got to do with proxy access, the study has indicated. Surprisingly, only 4.5% of the participants argued that their patients understand what proxy access is. This is an indication that authorization of individuals to access health information contained in another individual’s MyChart portal is a challenge for many help care desk agents. What is more, as high as 72.8% of the participants stated that their participants claimed to have proxy access when they did not have this access in real sense. The problem is complicated by the fact that some help care desk agents are not conversant with the right way to set the proxy access feature.
The finds obtained in this study can be looked at with reference to the arguments made by previous researchers in the same area of study. As seen in this study, the major barrier to access of MyChart portal by patients is difficulties in achieving successful log in into the portal. This is in line with the arguments made by Goldzweig who stated that, even before patients can start experiencing problems with portal navigation, gaining access of the interior aspects of the portal through proper log in is a challenge to many [7].
The study results are clear that cell phones are used more than computers in the access of MyChart Portal. According to Goldzweig , smartphones are replacing the use of computers in Internet access, including their use in accessing health applications and sites [7]. This trend has been attributed to the fact that smartphones are more convenient to use and carry around than computers. As a result, their use makes it easier for health systems to achieve some aspects of meaningful use by allowing the care receivers to access services at any location and at any time.
The study has indicated that the lack of computer or phone skills is the major barrier to the access of MyChart portal. These findings are similar to the findings of the study by Sarkar in which poor education background was linked to difficulties in accessing the patient portal [3]. Nevertheless, the study has revealed that a small number of participants are not able to access their portals due to spelling mistakes. This explains why some patients browse the right website even after password rest. Additionally, the poor education background of such individuals makes it difficult for them to navigate the internal aspects of the patient portal.
Closely related to the education challenge is the age problem. Most of the participants involved in this study indicated that their patients are aged between 50 and 70 years. Based on the assertions made by a number of previous researchers, this may be the reason for the challenges experienced in the access of MyChart portal. For example, Lober affirmed that older members of the society have low levels of digital literacy need in the proper use of innovations like patient portals [5]. Zickmund added that, despite the fact that older patients are in great need of patient portals in the management of chronic diseases, their digital literacy does not allow them to do these with ease [6].
The diffusion of innovations theory views users’ satisfaction with a new innovation as in important determinant of the speed of adoption and rate of use of the same innovation. However, the challenges experienced by individual patients in their efforts to access the MyChart portal explains why most of the agents studied stated that their employees are not satisfied with the access process. As a matter of fact, the study has indicated that some individuals feel that they are not comfortable with the use of patient portals and they are pressured to do so.
In line with the arguments made by Kruse, the study has indicated that trust issues can make it hard for patients to access their portals [7,8]. This happens when the patient does not trust the help care desk agent with identifying information needed before access to the portal can be guaranteed. According to the findings in this study, proxy access has become a stumbling block in the access of patient portals, mainly because a good number of patients are not even aware of the meaning and purpose of proxy access. In this regard, Kruse [7,8] argued that proxy access issues have become the main reason why access of health services by underage patients though patient portals is not easy.
The study is expected to have an immense value to the academic fraternity and the government in general. Patients can use the results generated by the study to appreciate the value of patient portals in management of their disease conditions. Again, health systems should use this study as a source of a better understanding of why the use of patient portals becomes difficult right from the accessibility point. This project will also help the audience to gain a better understanding about the role that IT support plays in helping a health care organizations meeting the some requires specified in the meaningful use criteria. With a better insight into the challenges that using patient portal present to those who use it most, relevant authorities can purpose to remedy this problem. The study is also important in filling the gap in literature about the major barriers in the access of patient portals.
Based on the results obtained from this study, several recommendations can made. To begin with, health care corporations should invest more on improving access to their patient portals to reduce cases where patients get frustrated when trying to access these portals. The best idea is to make the portals as user friendly as possible. Since digital and health literacy levels have been identified as some of the factors influencing the access of patient portals, health organizations and other relevant parties should consider providing training on basic access principles. Both digital and hardcopy manuals should be produced to reach as many potential users as possible. To overcome issues related to proxy access, health institutions must ensure that part of this training includes a section on the definition and the need for proxy access. Again, proxy access and security policies should be improved and changes circulated to all help agents and patients. These will guarantee the patients that their information is secure in the hands of the care agents.
The study concentrated on the challenges experienced by patients as they access a single patient portal, MyChart. To increase the reliability of results in future studies, it will be necessary to include the experiences users of other patient portals. Moreover, more reliable results can be obtained by making the actual portal users the point of interest in future studies. It will also be necessary to increase the sample size in future studies to make it possible to generalize the results to a large a bigger number of patient portal users.
Conflicts of interest
Authors disclose no existence of any financial arrangement with any company whose products figure prominently in the manuscript or with any competitor company
References
- Tieu L, Sarkar U, Schillinger D, Ralston JD, Ratanawongsa N, et al. (2015) Barriers and facilitators to online portal use among patients and caregivers in a safety net health care system: a qualitative study.Journal of medical Internet research 17.
- Goldzweig CL, Orshansky G, Paige NM, Towfigh AA, Haggstrom DA, et al. (2015) Electronic patient portals: evidence on health outcomes, satisfaction, efficiency, and attitudes: a systematic review.Annals of internal medicine 159: 677-687.
- Sarkar U, Karter AJ, Liu JY, Adler NE, Nguyen R, et al. (2017) Social disparities in internet patient portal use in diabetes: evidence that the digital divide extends beyond access.Journal of the American Medical Informatics Association 18: 318-321.
- Sarkar U, Karter AJ, Liu JY, Adler NE, Nguyen R, et al. (2016) The literacy divide: health literacy and the use of an internet-based patient portal in an integrated health system-results from the Diabetes Study of Northern California (DISTANCE).Journal of health communication 15: 183-196.
- Lober WB, Zierler B, Herbaugh A, Shinstrom SE, Stolyar A, et al. (2016) Barriers to the use of a personal health record by an elderly population. InAMIA Annual Symposium Proceedings 514. American Medical Informatics Association.
- Zickmund SL, Hess R, Bryce CL, McTigue K, Olshansky E, et al. (2015) Interest in the use of computerized patient portals: role of the provider-patient relationship.Journal of general internal medicine 23: 20-26.
- Kruse CS, Argueta DA, Lopez L, Nair A (2015) Patient and provider attitudes toward the use of patient portals for the management of chronic disease: a systematic review.Journal of medical Internet research 17.
- Kruse RL, Koopman RJ, Wakefield BJ, Wakefield DS, Keplinger LE, (2015). Internet use by primary care patients.Family medicine 44: 342-347.
- Goel MS, Brown TL, Williams A, Hasnain-Wynia R, Thompson JA, et al. (2017) Disparities in enrollment and use of an electronic patient portal.Journal of general internal medicine 26: 1112-1116.
- Goel MS, Brown TL, Williams A, Cooper AJ, Hasnain-Wynia, R, et al. (2011) Patient reported barriers to enrolling in a patient portal.Journal of the American Medical Informatics Association 18: 8-12.
- Irizarry T, Dabbs AD, Curran CR (2015) Patient portals and patient engagement: a state of the science review.Journal of medical Internet research 17: e148.
- Krist AH, Woolf SH, Bello GA, Sabo RT, Longo DR, et al. (2014) Engaging primary care patients to use a patient-centered personal health record.The Annals of Family Medicine 12: 418-426.
- Greysen SR, Garcia CC, Sudore RL, Cenzer IS, Covinsky KE, et al. (2015) Functional impairment and Internet use among older adults: implications for meaningful use of patient portals.JAMA internal medicine 174: 1188-1190.
- Turvey C, Klein D, Fix G, Hogan TP, Woods S, et al. (2017) Blue Button use by patients to access and share health record information using the Department of Veterans Affairs' online patient portal.Journal of the American Medical Informatics Association 21: 657-663.
- Osborn CY, Mayberry LS, Mulvaney SA, Hess R (2016) Patient web portals to improve diabetes outcomes: a systematic review.Current diabetes reports 10: 422-435
- Tang PC, Lansky D (2015) The missing link: bridging the patient–provider health information gap.Health Affairs 24: 1290-1295.
- Wade-Vuturo AE, Mayberry LS, Osborn CY (2016) Secure messaging and diabetes management: experiences and perspectives of patient portal users.Journal of the American Medical Informatics Association 20: 519-525.
- World Health Organization (2013) Social Determinants of Health: Health Systems.
- Furukawa MF, King J, Patel V, Hsiao CJ, Adler-Milstein J, et al. (2015) Despite substantial progress in EHR adoption, health information exchange and patient engagement remain low in office settings.Health Affairs 33: 1672-1679.
- Creswell JW, Clark VLP (2007) Designing and conducting mixed methods research.
- Neuman WL (2013) Social research methods: Qualitative and quantitative approaches. Pearson education.
- Taylor SJ, Bogdan R, DeVault M (2015) Introduction to qualitative research methods: A guidebook and resource. John Wiley & Sons.
- Ahern DK, Woods SS, Lightowler MC, Finley SW, Houston TK, et al. (2011) Promise of and potential for patient-facing technologies to enable meaningful use.American journal of preventive medicine 40: 162-S172.
- Archer N, Fevrier-Thomas U, Lokker C, McKibbon KA, Straus SE (2015) Personal health records: a scoping review.Journal of the American Medical Informatics Association 18: 515-522.
- Halamka JD, Mandl KD, Tang PC (2008) Early experiences with personal health records.Journal of the American Medical Informatics Association 15: 1-7.
- Mandl KD, Simons WW, Crawford WC, Abbett JM (2007) Indivo: a personally controlled health record for health information exchange and communication.BMC medical informatics and decision making 7: 25.
- Weitzman ER, Kaci L, Mandl KD (2009) Acceptability of a personally controlled health record in a community-based setting: implications for policy and design.Journal of medical Internet research 11.


