Abstract
The wild goat “bezoar” (Capra aegagrus) has been considered to be the strongest candidate for the ancestor of the domestic goats (C. hircus). This article describes the complete sequences of the mitochondrial DNA displacement loop (D-loop) region from Mahabadi goats. The control region (D-loop) is the most variable and non-coding portion of the mitochondrial genome.The genetic diversity and phylogenetic structure was analyzed in Mahabadi goat population by mitochondrial DNA sequences. It is estimated genetic distance between native goat and goat ancestor based on mtDNA. Recent analysis of the most of domestic goat individuals revealed a total of six different monophyletic mitochondrial DNA (mtDNA) haplogroups A, B, C, D, F, and G, with the A haplogroup representing >90% of individuals. Phylogenetic analysis was carried out using hyper variable region 1 (896 bp) obtained form 30 animals. All Mahabadi haplotypes were classified into A haplotype group and revealed remarkably high genetic distances within the population when compared with other goat populations from several places, indicating high genetic variation in the Mahabadi goat. After extracting DNA, displacement loop (D-loop) region of mtDNA was amplified with specific primers using PCR and after purification was sequenced. The phylogenic tree was drawn with the consensus sequence of other similar sequences of different goats breeds and wild goat “bezoar” (Capra aegagrus) obtained from GenBank. In the phylogenic tree, Mahabadi native goat was clustered with Switzerland, Romania, Austria, Cyprus, Jordan, Spain, Saudi Arabia, Albania, Turkey, Egypt, Kurdi Iran, Malaysia, Kyrgyzstan, Italya and ancestor of native goat breeds. The findings confirmed that Mahabadi goats was closed to Capra aegagrus compared to other domestic goats.
Key words
genetic diversity, capra aegagrus, mahabadi goat, mtDNA, phylogenetic, genetic distance.
Introduction
Domesticated goats (Capra hircus) are among the most important farm animals in many parts of the world, particularly Africa and Asia. Goats were thought to have been domesticated in the ninth and eighth millennia BC during the Pre-Pottery Neolithic B (PPNB) period, specifically between 8700 and 6800 cal BC in the Zagros Mountains, it is Known for their hardiness, goats have adapted to many different habitats, including savannas, deserts, scrubs and mountain ranges, and are found in all types of ecological environments, particularly in tropical and dry regions, where other livestock species have difficulties surviving. Goats are included in the entire range of production systems, from intensive production to small holders and nomadic human populations, and are raised around the world for their meat, milk, cheese, fiber and hides. Goats are also kept as pets or for entertainment or cultural and religious purposes. Angora goats appear in one color which is white to silver, but Mahabadi goats produce mohair in different natural colors which are a unique character of this breed. Keeping above in view in present study, the current phylogenetic status and genetic diversities of Mahabadi goat has been investigated in order to understand the genetic basis of this breed. Mitochondrial genome (mtDNA) analysis is a critical tool in the fields of evolutionary and population genetics, including molecular. The mitochondrial DNA (mtDNA) polymorphism, especially the displacement loop (D-loop) region, has been largely applied to understand phylogenetical relationships in many animal species, including cattle [1], pig [2], sheep [3], chicken [4], horse [5] and goat [6,7,8]. Previous studies on domestic goats identi-fied at least four major mtDNA lineages [9,10,11]. Lineage A is the most diverse and widely distributed across all continents.
This article describes the complete sequences of the mitochondrial DNA displacement loop (D-loop) region from domestic goats and several domestic goat and also native goat ancestor “Capra aegagrus”. The control region (D-loop) is the most variable and non-coding portion of the mitochondrial genome [12]. This region controls the mitochondrial DNA (mtDNA) replication by regulating the activities of various enzymes and proteins that are coded by the nuclear genes [13]. The sequences of the control region vary greatly in different mammalian species, however, preservation of several conserved regions indicate fundamental harmony in its function [14]. Because of their rapid evolution [15], the control region sequences are valuable for investigating the genetic diversity and evolutionary relationships among species [12]. The extent and pattern of genetic variability in livestock species will contribute to the conservation of livestock genetic resources. On the basis of the previously mentioned archaeological studies and bio-geography, it is likely that the molecular studies of diversity in Iranian goats will yield new understanding of the origin and process of goat domestication and will contribute to the resolution of goat phylogeny. More than 20 breeds of goats have been recognized in Iran, these small breeds of goat are distributed over the western and north-west of Iran near to the Turkey and Iraqi borders.
Three wild species of the genus Capra, the bezoar (C. aegagrus), markhor (C. falconeri) and ibex (C. ibex), are closely related to the domestic goat (C. hircus), and it has been suggested that these species contributed to the gene pool of domestic goats, possibly via early translocations of animals and feralization prior to the global spread of goats.
It is now widely agreed that C. aegagrus is the wild ancestor of domestic goats, and this finding has been confirmed by the presence of all “domestic” haplogroups in the current C. aegagrus populations. The bovid known as the Wild Goat (Capra aegagrus) was the progenitor of the Domestic Goat, although domestic goats have probably been hybridized with other wild goat species in Asia. Wild Goats are found in western Asia (since their introduction in 1970, a free-roaming population maintained by hunting at 500 to 1000 individuals has also existed in New Mexico [U.S.A.]). They live in rocky habitats associated with cliffs from sea level to around 4000 m (but usually below 2500 m). Although in Daghestan they inhabit some montane forests, in general Wild Goats are associated with deserts and semi-arid areas. Natural predators such as Gray Wolves (Canis lupus) and Leopards (Panthera pardus) have been extirpated in most areas now occupied by Wild Goats. The nucleotide sequence data reported in this paper will appear in the GenBank sequence database Capra aegagrus with the accession numbers AB004076.1. Recent analysis of 2,430 domestic goat individuals revealed a total of six different monophyletic mitochondrial DNA (mtDNA) haplogroups A, B, C, D, F, and G, with the A haplogroup representing >90% of individuals. The three goats (C. hircus) mtDNA haplogroups (A, B, and C) found by [14] Luikart et al. (Figure 1) have been interpreted to indicate three distinct domestication events. By comparing the sequence obtained from district HVR1-of-breed goats Mahabad sequences of these six groups of haplotypes as a sequence of reference in the study by Nader et al in 2009 took the form of a table in the study that Mahabadi goats belonging to haplotype group A is based on the analysis (Table 1).
Table 1. Haplotype diversity phylogeny tree bead on HVR1 sequence within Mahabadi goat population
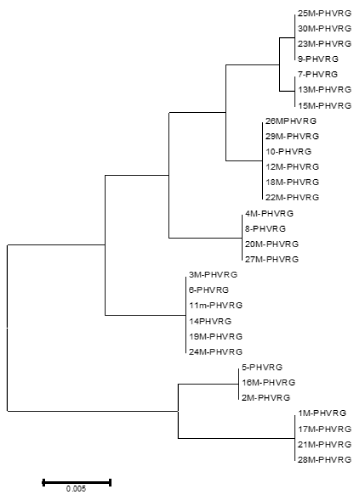
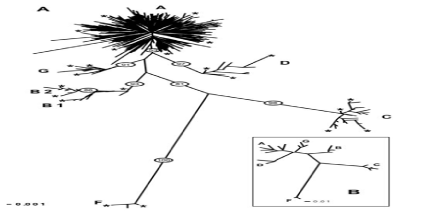
Figure 1. The frequency of haplotype groups goat species around the world
Assuming a single haplotype domesticated per haplogroup and a coalescence time of 10,000 years for the most common A haplogroup, it was hypothesized that the domestication of B and C haplogroups occurred approximately 2,130 and 6,110 years ago, respectively. This result has been explained by some authors (Luikart et al. 2001; Amills et al. 2009) [14,15] [16,17] because goat, owing to its moderate size and ability to adapt to different environments, well-suited to the intercontinental transportation in ancient times. Based on previous literatures, in this study, molecular analysis of Mahabadi goat population based on D-Loop region of mitochondrial DNA were investigated to develop molecular markers for breed identification. In this context, our Mahabadi goat objective was to better understand the domestication process through an extensive analysis of the mtDNA polymorphism. More specifically, using extensive and well-controlled sampling in the field, we aimed to localize the putative domestication centers by finding the present-day wild populations bearing the closest genotypes when compared to the domestic populations. (Naderi et al. 2007) [16] [18]. All fragments of the three datasets were aligned and trimmed using ClustalW in MEGA6 Domestic goats (Capra hircus) have been selected to play an essential role in agricultural production systems, since being domesticated from their wild progenitor, bezoar (Capra aegagrus). A detailed understanding of the genetic consequences imparted by the domestication process remains a key goal of evolutionary genomics. we analyzed ten economic important native goat breeds with domestic goat ancestor.
All of the studied are phenotypically distinct from each other and have very different geographic ranges. The genetic diversity and distribution of mitochondrial haplogroups among these breeds were examined, and the level of maternal introgression of goat populations from different putative domestication centers was also assessed. Finally, to support our genetic data and initiate a detailed documentation of Capra biodiversity in Iran, the hypothesis that C. aegagrus is the wild progenitor of the Mahabadi domestic goat was evaluated. Domestic Goats are sometimes referred to as Capra aegagrus hircus, but Valdez (2011) treats the Domestic Goat as a distinct species, Capra hircus. Feral Domestic Goats have a far wider distribution around the world than do true Wild Goats. The endemic goats on Crete and nearby islands, which are often referred to as C. aegagrus cretica, look similar to wild C, aegagrus, but genetic analyses have indicated that in fact they are actually, as some researchers have suspected, feral domestic goats descended from a very early introduction.
Material and method
We collected blood samples of native goat from Mahabadi goat. Blood samples (5ml in EDTA
Containing tubes) randomly collected from 20 animals and stored at -20°C until used at biotechnology laboratory. We amplified a 598-bp fragment of the mitochondrial hyper variable region 1 (HVR1) between positions 15,653 and 16,250 in the reference goat mitochondrial genome AF533441. DNA extraction, PCR amplification and sequencing.
We collected blood samples of native goat from Mahabadi goat. Blood samples (5ml in EDTA Amplification and sequencing The complete HVR1 region was amplified by using forward primer HVR1-F: 5َ-CTATCAACACACCCAAAGCTGAA-3َ and reverse primer HVR1-R: : 5َ-CGGAGCGAGAAGAGGGAT-3َ. The forward and reverse primers were designed sequences of the mtDNA genome (GenBank accession no. V00654). Polymerase chain reaction (PCR) was carried out in a total volume of 25 ul, containing 10 ug of genomic DNA, 2.5 ul of 10ul buffer, 0.2 mM of dNTP, 10 pM of each primer and 1.5 units of Taq polymerase (TaKaRa, Japan). Therminal cycling was performed on a PTC-200 thermocycler (MJ Research Inc.) under the following conditions; 2-minute denaturation at 94°C, followed by 35 cycles of 30 s at 94°C, 30 s at60°C, 60 s at 72°C, and a final 5 min at 72°C before cooling to 4°C for 10 min. The amplified products were separated by electrophoresis on 1% Agarose gels and were visualized under UV illumination after staining with Ethidium Bromide. The PCR products were purified using QIA quick PCR purification Kit (Qiagen, USA), and were directly sequenced on an ABI 3130xl Genetic Analyzer (PE Applied Biosystems, USA) Statistical and phylogenetic analyses. The sequences of the HVR1 region from different breeds were aligned in CLUSTAL W (Thompson etal., 1994). Numbers of nucleotide polymorphic sites(S) and haplotype (h), nucleotide diversity (Pi), haplotype diversity (Hd) and nucleotide divergence (Dxy) were performed in DNA sequence polymorphism Version 5.1 (Librado and Rozas,2009) [17] [19]. The Neighbor-joining (NJ) tree (Saitou and Nei, 1987) [18] [20] among haplotypes based on the HVR1 region sequences was reconstructed in MEGA 5.05 package with the reliability of the tree topology assessed by 1,000 bootstrap replications. The NJ tree among breeds was constructed in MEGA 5.05 package on the basis of divergence distances.
Phylogenetic reconstruction
The sequences obtained were compared by alignment to the international Gene Bank data-base in Chinese (KM 360063), Switzerland (KR059147) , Italy (KR059205) , jordan (KR059160 ) , Iran (KR059191 ) , Spain (KR059156 ), Austria (KR059180) , Egypt (KR059159) , Turkey (KR059200), Cyprus (KR059163) , Saudi Arabia (KR059154), Romania(K059198), Albania (KR059146), Kyrgyzstn (KR059122) , Malysia (KR059220) and Capra aegagrus (AB004076.1 ) using the BioEdit software program version 7.2 [21]. To investigate genetic relationship between mitochondrial sequences, an unrooted neighbor-joining phylogeny [22] was constructed using the Tamura–Nei distance method [23,24-43]. The distance computation and phylogenetic tree construction are incorporated in the MEGA package version. 5.1 (Figure 2).
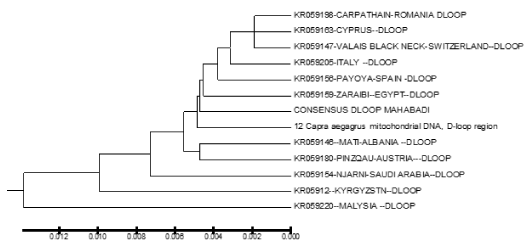
Figure 2. Phylogenetic relationship among several native goat and their ancestor (Capra aegagrus) of based on HVR1 region from goat breeds.
Result and discussion
(mtDNA variation in Mahabadi goat)
In the present study, we analyzed the mtDNA control region sequences of 30 Mahabadi goats to further elucidate its diversity. There were no insertions and deletions in 30 sequences of HVRI of the control regions. The HVRI sequences were highly polymorphic. Our 30 sequences gave 7 different haplotypes with 44 variable sites defined. The two largest haplotype group consisted of 6 individuals, two haplotype groups included 3 individuals, and three haplotypes included 4 individuals (table 1). The average base composition of the control region sequences was as follows; A: 30.38%, C: 23.77%, G: 15.70% and T: 30.16% and the molecular weight of single this sequence was 271807.00 Daltons and the molecular weight of pairs was 540684.00 Daltons and indicates that the caprine mtDNA control region has high A/T contents the control region is rich in A/C contents (Figure 3). This result indicates that Mahabadi goat the between group distances were computed using the MEGA 5.0 software. Distribution of the samples between the groups was made in accordance with the clusterization obtained. Apparently, the longest distance separated the KR059159 (Egypt) and KR059220 (Malaysia) from the others. The shortest distances were among KR059205 (Italy), Capra aegagrus (AB004076.1) and Mabadi goat. It can be reported that native goat from Iran is closed to domestic goat s ancestor (figure 4). A sequence analysis of native goat mtDNA revealed a comparative lack of genetic structure, supporting a geographic distribution that confirms the main trends observed in previous studies of mtDNA diversity in goats. A neighbor-joining and parsimony phylogenetic tree constructed using the sequences showed that the domestic goats of Iran and Italy and Spain and the bezoar belong to the same group that this result was confirmed by trees based on the sequence of the mitochondrial displacement loop regions. Phylogenetic analysis was carried out using hyper variable region 1 (896 bp). Mahabadi goat proved to be extremely diverse (average haplotype diversity of 0.999) and the nucleotide diversity values 0.022. These results indicate high-divergence status of the Mahabadi goat and will influence breeding and conservation strategies adopted for this breed (table 2). Distribution of the samples between the groups was made in accordance with the cluster obtained. This is possible because of geographical distance and it is distributed. The current study constitutes the first assessment of the genetic diversity and population structure of Mahabadi goat populations from the west of Iran and provides the first insights into the genetic history of native goat of Iran.
Table 2. Diversity composition of the control region sequences of Mahanadi goat population
KR059205-ITALY_--DLOOP |
|
|
|
|
|
|
|
|
|
|
|
|
12_Capra_aegagrus_mitochondrial_DNA,_D-loop_region |
0 |
|
|
|
|
|
|
|
|
|
|
|
CONSENSUS_DLOOP_MAHABADI |
0.0045 |
0.0045 |
|
|
|
|
|
|
|
|
|
|
KR059147-VALAIS_BLACK_NECK-SWITZERLAND--DLOOP |
0.009 |
0.009 |
0.0135 |
|
|
|
|
|
|
|
|
|
KR059146--MATI-ALBANIA_--DLOOP |
0.0135 |
0.0135 |
0.0181 |
0.0226 |
|
|
|
|
|
|
|
|
KR059159-ZARAIBI--EGYPT--DLOOP |
0.0045 |
0.0045 |
0.009 |
0.0136 |
0.0181 |
|
|
|
|
|
|
|
KR059154-NJARNI-SAUDI_ARABIA--DLOOP |
0.0135 |
0.0135 |
0.018 |
0.0225 |
0.018 |
0.009 |
|
|
|
|
|
|
KR05912--KYRGYZSTN--DLOOP |
0.0541 |
0.0541 |
0.0586 |
0.0541 |
0.0496 |
0.0497 |
0.0405 |
|
|
|
|
|
KR059156-PAYOYA-SPAIN_-DLOOP |
0 |
0 |
0.0045 |
0.009 |
0.0135 |
0.0045 |
0.0135 |
0.0541 |
|
|
|
|
KR059220--MALYSIA_--DLOOP |
0.0359 |
0.036 |
0.0405 |
0.0449 |
0.0494 |
0.0315 |
0.0314 |
0.0539 |
0.036 |
|
|
|
KR059198-CARPATHAIN-ROMANIA_DLOOP |
0.0226 |
0.0226 |
0.0271 |
0.0226 |
0.0271 |
0.0271 |
0.0271 |
0.0586 |
0.0226 |
0.0495 |
|
|
KR059180-PINZQAU-AUSTRIA---DLOOP |
0.009 |
0.009 |
0.0136 |
0.0181 |
0.0226 |
0.0045 |
0.0045 |
0.0451 |
0.009 |
0.027 |
0.0316 |
|
KR059163-CYPRUS--DLOOP |
0.0135 |
0.0135 |
0.0181 |
0.0226 |
0.0271 |
0.009 |
0.018 |
0.0496 |
0.0135 |
0.0315 |
0.0361 |
0.0135 |
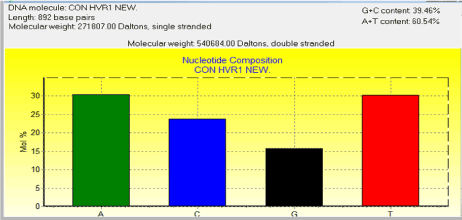
Figure 3. Diversity composition of the control region sequences of Mahabadi goat population
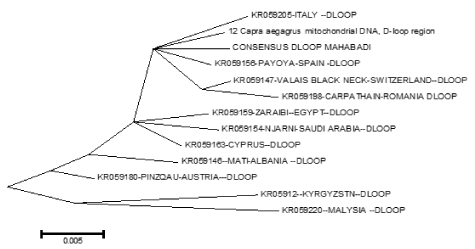
Figure 4. Phylogenetic relationship among several native goat and their ancestor (Capra aegagrus)
Acknowledgement
The authors acknowledged the three reviewers for constructive comments on the manuscript. We gratefully acknowledge all farmers who took part in the present study, giving access to the animals. This study provides the first insights into the genetic diversity and evolutionary background of domestic goats in Iran and provides a basis for further studies on the temporal fluctuations of domestic goat populations. The inclusion of more samples of wild goat species or ancient goats in future studies will provide additional insights into the history and gene flow of goat populations in Iran.
References
- Ilie DE, Cean A, Cziszter LT, Gavojdian D, Ivan A, et al. (2015) Microsatellite and Mitochondrial DNA Study of Native Eastern European Cattle Populations: The Case of the Romanian Grey.PLoS One10: e0138736. [Crossref]
- Li KY, Li KT, Cheng CC, Chen CH, Hung CY, et al. (2015) A genetic analysis of Taoyuan pig and its phylogenetic relationship to Eurasian pig breeds. Asian-Australas J Anim Sci 28: 457-466. [Crossref]
- Agaviezor BO, Adefenwa MA, Peters SO, Yakubu A, Ade-bambo OA, et al. (2012) Genetic diversity analysis of the mito-chondrial D-loop of Nigerian indigenous sheep. Anim Gen Resour 50: 13-20.
- Hoque MR, Choi NR, Sultana H, Kang BS, Heo KN, et al. (2013) Phylogenetic analysis of a privately-owned Korean Native chicken population using mtDNA D-loop variations. Asian-Australas J Anim Sci 26: 157-162. [Crossref]
- Zernekova C, Kott T, Majzlik I (2013) Mitochondrial D-loop sequence variation among Hucul horse. Czech J Anim Sci 58: 437-442.
- Hoda A, Bicoku Y, Dobi P (2014) Genetic diversity of Al-banian goat breeds revealed by mtDNA sequence variation. Biotechnol Biotec Equip 28: 77-81. [Crossref]
- Pakpahan S, Tunas Artama W, Widayanti R, Suparta G (2015) Genetic variations and the origin of native Indonesian goat breeds based on mtDNA D-Loop sequences. Asia J Anim Sci 9: 341-350.
- Çinar Kul B, Ertugrul O (2011) mtDNA diversity and phy-logeography of some Turkish native goat breeds. Ankara Üniv Vet Fak Derg 58: 129-134.
- Joshi MB, Rout PK, Mandal AK, Tyler-Smith C, Singh L, et al. (2004) Phylogeography and origin of Indian domestic goats.Mol Biol Evol21: 454-462. [Crossref]
- Luikart G, Gielly L, Excoffier L, Vigne JD, Bouvet J, et al. (2001) Multiple maternal origins and weak phylogeographic structure in domestic goats.Proc Natl Acad Sci U S A98: 5927-5932. [Crossref]
- Sultana S, Mannen H, Tsuji S (2003) Mitochondrial DNA diversity of Pakistani goats.Anim Genet34: 417-421. [Crossref]
- Wilson AC, Cann RL, Carr SM, George M, Gyllensten UB, et al. (1985) Mitochon-drial DNA and two perspectives on evolutionary genetics. Biol J Linn Soc 26: 375-400.
- Ghivizzani SC, Madsen CS, Hauswirth WM (1993) In organello footprinting: analysis of protein binding at regulatory regions in bovine mitochondrial DNA. J Biol Chem 268: 8675-8682. [Crossref]
- Saccone C, Pesole G, Sbisá E (1991) The main regulatory region of mammalian mitochondrial DNA: structure-function model and evolutionary pattern.J Mol Evol33: 83-91. [Crossref]
- Brown WM, George M Jr, Wilson AC (1979) Rapid evolution of animal mitochondrial DNA.Proc Natl Acad Sci U S A76: 1967-1971. [Crossref]
- Luikart G, Gielly L, Excoffier L, Vigne JD, Bouvet J, et al. (2001) Multiple maternal origins and weak phylogeographic structure in domestic goats.Proc Natl Acad Sci U S A98: 5927-5932. [Crossref]
- Amills M, Ramírez O, Tomàs A, Badaoui B, Marmi J, et al. (2009) Mitochondrial DNA diversity and origins of South and Central American goats.Anim Genet40: 315-322. [Crossref]
- Naderi S, Rezaei HR, Taberlet P, Zundel S, Rafat SA, et al. (2007) Large-scale mitochondrial DNA analysis of the domestic goat reveals six haplogroups with high diversity.PLoS One2: e1012. [Crossref]
- Librado P, Rozas J 2021 Copyright OAT. All rights reservehensive analysis of DNA polymorphism data.Bioinformatics25: 1451-1452. [Crossref]
- Saitou N, Nei M (1987) The neighbor-joining method: a new method for reconstructing phylogenetic trees.Mol Biol Evol4: 406-425. [Crossref]
- Arnason U, Gullberg A, Johnsson E, Ledje C (1993) The nucleotide sequence of the mitochondrial DNA molecule of the grey seal, Halichoerus grypus and a comparison with the mitochondrial sequences of other true seals. J Mol Evol 37: 323-330. [Crossref]
- Saitou N, Nei M (1987) The neighbor-joining method: A new method for reconstructing phylogenetic trees. Mol Biol Evol 4: 406-425. [Crossref]
- Tamura K, Nei M (1993) Estimation of the number of nucleotide substitutions in the control region of mitochondrial DNA in humans and chimpanzees.Mol Biol Evol10: 512-526. [Crossref]
- Arnason U, Gullberg A, Widegren B (1991) The complete nucleotide sequence of the mitochondrial DNA of the fin whale Balaenoptera physalus. J Mol Evol 33: 556-568. [Crossref]
- Ameur A, Stewart JB, Freyer C, Hagström E, Ingman M, et al. (2011) Ultra-deep sequencing of mouse mitochondrial DNA: mutational patterns and their origins.PLoS Genet7: e1002028. [Crossref]
- Anderson S, de Bruijn MH, Coulson AR, Eperon IC, Sanger F, et al. (1982) Complete sequence of bovine mitochondrial DNA. Conserved features of the mammalian mitochondrial genome.J Mol Biol156: 683-717. [Crossref]
- Chen SY, Su YH, Wu SF, Sha T, Zhang YP (2005) Mitochondrial diversity and phylogeographic structure of Chinese domestic goats.Mol Phylogenet Evol37: 804-814. [Crossref]
- Cozzi MC, Strillacci MG, Valiati P, Bighignoli B, Cancedda M, et al. (2004) Mitochondrial D-loop sequence variation among Italian horse breeds.Genet Sel Evol36: 663-672. [Crossref]
- Foran DR, Hixson JE, Brown WM (1988) Comparisons of ape and human sequences that regulate mitochondrial DNA transcription and D-loop DNA synthesis.Nucleic Acids Res16: 5841-5861. [Crossref]
- Hall TA (1999) Bio edit: a user-friendly biological sequence alignment editor and analysis program for Windows 95/98/NT. Nucleic Acids Symp Ser 41: 95-98.
- Kumar S, Tamura K, Jakobsen IB, Nei M (2004) MEGA3.1: Molecular Evolutionary Genetics Analysis Soft-ware. Arizona State University Press, Tempe, USA.
- Liu ZG, Lei CZ, Luo J, Ding C, Chen GH, et al. (2006) Genetic variability of mtDNA sequences in Chinese native chicken breeds. Asian-Australas J Anim Sci 17: 903-909.
- Mignotte F, Gueride M, Champagne AM, Mounolou JC (1990) Direct repeats in the non-coding region of mitochondrial DNA. Involvement in the generation of intra and inter-individual heterogeneity. European J Biochem 194: 561-571. [Crossref]
- Moradi MH, Rostamzadeh J, Rashidi A, Vahabi K, Farah-mand H (2014) Analysis of genetic diversity in Iranian mo-hair goat and its color types using Inter Simple Sequence Re-peat (ISSR) markers. Agric Commod 2: 55-62.
- Rozas J, Sachez-Delbarrio JC, Messeguer X, Rozas R (2003) DnaSP, DNA polymorphism analyses by the coales-cent and other methods. Bioinformatics 19: 2496-2497. [Crossref]
- Taberlet P, Valentini A, Rezaei HR, Naderi S, Pompanon F, et al. (2008) Are cattle, sheep, and goats endangered species?Mol Ecol17: 275-284. [Crossref]
- Xu X, Gullberg A, Arnason U (1996) The complete mito-chondrial DNA (mtDNA) of the donkey and mtDNA compari-sons among four closely related mammalian species pairs. J Mol Evol 43: 438-446. [Crossref]
- Naderi S, Rezaei HR, Taberlet P, Zundel S, Rafat SA, et al. (2007) Large-scale mitochondrial DNA analysis of the domestic goat reveals six haplogroups with high diversity.PLoS One2: e1012. [Crossref]
- Parma P, Feligini M, Greppi G, Enne G (2003) The complete nucleotide sequence of goat (Caprahircus) mitochondrial genome. DNA Seq 14: 199-203. [Crossref]
- Amer SAM (2014) Mitochondrial DNA Variability among Some. Saudi Arabian Goat Breeds. British Biotechn J 4: 877-882.
- Avise JC (1994) Molecular markers, natural history and evolution. Chapman & Hall, New York, NY Boyazoglu J, Hatziminaoglou I, Morand-Fehr P (2005) The role of the goat in society: past, present and per spectives for the future. SmallRumin Res 60: 13-23.
- Esposti MD, De Vries S, Crimi M, Ghelli A, Patarnello T, et al. (1993) Mitochondrial cytochrome b: evolution and structure of the protein.Biochim Biophys Acta1143: 243-271. [Crossref]
- Howell N (1989) Evolutionary conservation of protein regions in the protonmotive cytochrome b and their possible roles in redox catalysis. J Mol Evol 29: 157-169. [Crossref]


