Abstract
Introduction: The prevalence of metabolic syndrome (MetS) and MetS-related stroke is set to increase dramatically in coming decades. MetS is a complex disease that includes endothelial dysfunction, insulin resistance, diabetes, hypertension, ectopic obesity, and dyslipidaemia and an increased risk of cardiovascular events.This study aims to fill this gap of research by conducting a Bayesian network meta-analysis to compare major drugs to treat MetS.
Methods and analysis: We will search the PubMed, EMBASE, Cochrane Library, Web of Science, Embase, google scholar, clinical trials registry (ClinicalTrials.gov) for unpublished or undergoing research listed in registry platforms. Randomized controlled trials (RCTs) on the drug therapy of MetS with outcome measures including diagnostic criteria of MetS will be included. The quality of included RTCs will be evaluated according to the Cochrane Collaboration's risk of bias tool. Traditional pairwise meta-analysis and Bayesian network meta-analysis will be conducted to compare the efficacies of antidiabetic drugs. Sensitivity analysis on the sample size of RCTs, meta-regression analysis on the follow-up periods, dosages and baselines of outcome measure, contradiction analysis between pairwise and network meta-analyses, and publication bias analysis, will be performed. Randomized controlled trials (RCTs) on the drug therapy of MetS with outcome measures criteria of MetS diagnostic will be included. The quality of included RTCs will be evaluated according to the Cochrane Collaboration's risk of bias tool. Traditional pairwise meta-analysis and Bayesian network meta-analysis will be conducted to compare the efficacies of drugs. Sensitivity analysis on the sample size of RCTs, meta-regression analysis on the follow-up periods, dosages and baselines of outcome measure, contradiction analysis between pairwise and network meta-analyses, and publication bias analysis, will be performed.
Ethics and dissemination Ethics approval was not required for this study because it was based on published studies. The results and findings of this study will be submitted and published in a scientific peer-reviewed journal.
Trial registration number: PROSPERO (CRD42018083468).
Keywords
drugs, metabolic syndrome, systematic review
Abbreviations
Cis: Confidence Intervals, HDL: high-density lipoprotein, LDL: low-density lipoprotein, MD: mean difference, RR: risk ratio, WC = waist circumference, MetS = metabolic syndrome, CVD: cardiovascular disease, NMA: network meta-analysis, RCTs: randomized controlled trials.
Strengths and limitations of this study
This systematic review and meta-analysis will offer a better understanding regarding the association between drugs and MetS.
An improved understanding of this relationship may help to inform public health Mets prevention strategies.
Included studies may have substantially different methodologies, which could limit our ability to draw reliable conclusions from the existing evidence base.
Depending on the results, confounding factors that were not adjusted for in the selected studies and low generalizability can be limitations. Individual patient data will not be available.
Background
The prevalence of metabolic syndrome (MetS) and MetS-related stroke is set to increase dramatically in coming decades. The MetS describes an association between endothelial dysfunction, insulin resistance, diabetes, hypertension, ectopic obesity, and dyslipidaemia and an increased risk of cardiovascular disease and stroke [1-4].
It is in large part the result of unbalanced diet, low socioeconomic and cultural level, stress and sedentary lifestyle [3-5]. The MetS describes an association between endothelial dysfunction, insulin resistance, diabetes, hypertension, ectopic obesity, and dyslipidaemia and an increased risk of cardiovascular disease and stroke [5].
MetS present if three or more of the following is present: increased waist circumference, increased triglycerides, decreased HDL, increased fasting glucose and hypertension. This syndrome causes systemic inflammation that activates the coagulation system and may cause the formation of pathological thrombi [6-7].
Currently, there is a lack of high quality evidence to support the tailoring of drugs to treatment regimens for Mets according to an individual's characteristics or other treatment effect modifiers. As such, it is imperative to improve existing guideline recommendations and inform decision-makers about the safety and effectiveness of these interventions. This study conducted a Bayesian NAMto compare the risk factors control efficacy of drugs use in MetS.
Objective
The objective of this study is to compare efficacies of drugs by Bayesian NAM on RCTs.
Methods/design
Design: Systematic review and Bayesian NAM. MetS will be defined according to the unified definition of metabolic syndrome based on a Joint Interim Statement of the International Diabetes Federation Task Force on Epidemiology and Prevention; National Heart, Lung, and Blood Institute; American Heart Association; World Heart Federation; International Atherosclerosis Society; and International Association for the Study of Obesity. We also consider the patients with the MetS diagnosis based on previous definitions, mainly based on the National Cholesterol Education Program’s Adult Treatment Panel III. Individuals will be classified as having MetS if they have three or more of the followings from UHS Visit 1: elevated BP (systolic BP ≥ 130 mmHg or diastolic BP ≥ 85 mm Hg); elevated TG (≥ 150 mg/dL); low HDL-C (men <40 mg/dL, women < 50 mg/dL); impaired fasting glucose (>100 mg/dL); and elevated waist circumference (WC) (men ≥ 94 cm, women ≥ 80 cm). Diabetes will be defined as a fasting plasma glucose level ≥ 126 mg/dL. Impaired fasting glucose will be defined as a fasting plasma glucose level of 100 to 125 mg/dL [7-11].
The study is registered with PROSPEROCRD42018083468). This protocol conforms to the Preferred Reporting Items for Systematic Reviews and Meta-Analyses Protocols (PRISMA-P) guidelines [12-14].
Eligibility criteria
We will include randomized controlled trials (RCTs) comparing one drug with another drug as monotherapy or placebo for the treatment of TN. Quasi-randomized controlled trials allocating participants according to birth date or the consequences of enrolment will be excluded. The minimum duration for RCT inclusion will be set at 4 weeks. Trials with more than a two-arm design will be considered only if the available data meet the criteria for an intervention. For trials with a crossover design, data will only be extracted from the first randomization period. The retrieved reports will be screened according to the checklist of eligibility and the eligibility criteria are shown below including participants, interventions, controls, types of study and other criteria.
Patient and Public Involvement
The patients and/or the public are not involved; it is an article of the protocol of systematic revision and network of meta-analysis.
Search strategy
The following databases will be searched from their inception forward for potentially eligible studies in English language published on or before 31 January 2018: (1) PubMed, (2) Scopus, (3) Web of Science, (4) Cochrane Central Register of Controlled Clinical Trials, (5) Embase, (6) google scholar, (7) clinical trials registry (ClinicalTrials.gov). In addition, cross-referencing from retrieved studies will be conducted. As publication bias caused by insufficient unpublished data can significantly bias the comparative efficacy results of network meta-analyses and modify rankings, we will also perform searches for unpublished or ongoing trials using the System for information on Grey Literature in Europe (SIGLE) as well as other registry platforms, such as Clinicaltrials.gov and the International Clinical Trials Registry Platform. Prior to completing this review, we will perform an additional search of each database and registration platform to guarantee that the most recent studies are included. Electronic databases will be searched for studies on the effects of drugs on risk factors safety in adults with MetS. The first author will conduct all database searches. The search strategy for all other databases will be adapted based on the requirements of each database. The search strategy will be developed by LR and HRZ; we anticipate that the databases will be searched from their inception to 30 December 2018 (see online supplementary file 2 for the search strategies for PubMed, EMBASE, Cochrane Library, Web of Science, Embase, google scholar, clinical trials registry (ClinicalTrials.gov) (see online supplementary file1).
Participants
Inclusion: The participants were must be adults, aged at least 18 years, suffering from and requiring treatment pharmacology for MetS.
Exclusion: The participants suffering from other metabolic disease conditions or aged less than 18 years.
Interventions
Inclusion: Any RCT that evaluates the efficacy of these drugs.
Exclusion: Any RCT that evaluates other drugs or combined treatments of multiple drugs or placebo. We plan to include the following drugs: Simvastatin, Atorvastatin, Pravastatin, Rosuvastatin, Lovastatin, Fluvastatin, Pitavastatin, metformin, glimepiride, glyburide, glipizide, repaglinide, nateglinide, sitagliptin, vildagliptin, saxagliptin, SGLT-2 (sodium-glucose transporter-2) inhibitors, phentermine, topiramate, lorcaserin, orlistat, fibrates, nicotinic acid, omega-3 fatty and drugs from other classes [CCBs(calcium channel blockers), ARB(angiotensin II receptor blockers), diuretics and ACEIs(angiotensin-converting enzyme inhibitors)]. In addition to these drugs, we will also obtain information about interventions of interest from either pairwise RCTs or placebo-controlled trials, as some RCTs design a placebo-controlled arm as the comparator.
Controls
Inclusion: Any RCT that evaluates the efficacy of these drugs other than the drug of intervention or placebo. Exclusion: Any RCT that evaluates other drugs or combined treatments of multiple drugs.
Types of study
Inclusion: Only RCTs will be included.
Exclusion: Observational cohort and case–control studies, case reports, experimental studies and reviews will be excluded.
Other criteria
Other inclusion criteria: The RCTs must report complete efficacy data of risk factors of each treatment. Follow-up periods or durations in RCTs are at least 4 weeks. Other exclusion criteria are (1) duplicated or redundant studies and (2) combined treatments with multiple drugs.
Study selection
Reviewers will screen all titles or abstracts or full texts for database records independently according to the eligibility criteria. Disagreements between reviewers will be resolved by consensus. The selection process of relevant studies retrieved from databases will be shown in a PRISMA-compliant flowchart (figure 1) [12].
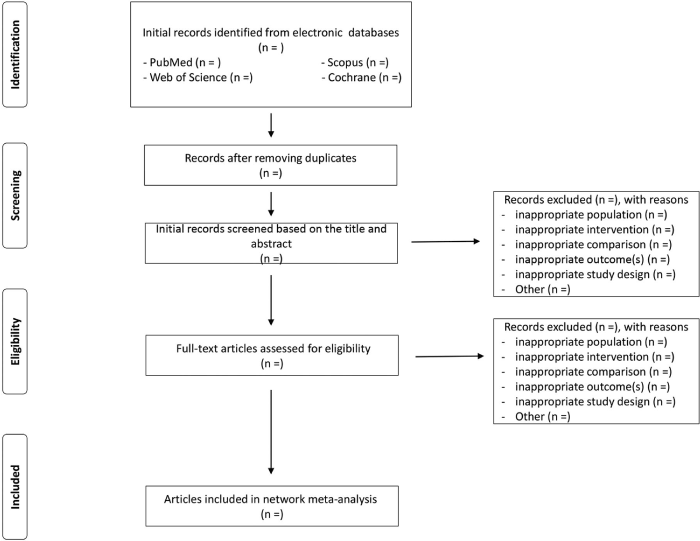
Figure 1. Flow diagram of study selection process
Data extraction and quality assessment
Data of the study characteristics and the clinical outcome measures will be extracted. The data extracted from the RCTs are: (1) authors; (2) publication year; (3) baseline of outcome measures; (4) sample sizes; (5) interventions of both arms; (6) dosages of both arms and (7) treatment outcome measures including HbA1c and FPG. The data will be standardized [table 1]. The quality of eligible studies will be evaluated according to the Cochrane Collaboration's risk of bias tool for assessing the risk of bias [table 2] [13]. Radar chart (or star chart) will be used to summarize the results [14].
Table 1. Summary of the included RCTs
|
Baseline |
Sample size |
Treatment duration |
Drug 1 dosage |
Drug 2 dosage |
Drug 2 dosage |
RCT 1 |
|
|
|
|
|
|
RCT2 |
|
|
|
|
|
|
RCT3 |
|
|
|
|
|
|
RCT-Randomized controlled trial.
Table 2. Randomized controlled trial (RCT) quality assessment according to the Cochrane Collaboration's risk of bias tool
|
RCT1 |
RCT2 |
RCT3 |
RCT4 |
Random sequence generation |
|
|
|
|
Allocation concealment |
|
|
|
|
Blinding of participants and personnel |
|
|
|
|
Blinding of outcome assessment |
|
|
|
|
Incomplete outcome data |
|
|
|
|
Selective reporting |
|
|
|
|
Other sources of bias |
|
|
|
|
Each item of included RCT will be evaluated at low risk, unclear risk and high risk of bias, based on the Cochrane Collaboration's risk of bias tool.
Outcomes
Outcome measures of drugs efficacy include mean changes of diagnostic of MetS and all-cause mortality (primary outcome) and risk factors, cardiovascular mortality, cancer mortality; cardiovascular incidence, and cancer incidence (secondary outcome) from baseline and their corresponding variation. Report the number of events, sample size, and follow-up time for each group, or report the hazard ratio with a measure of uncertainty or where there are sufficient details for this to be calculated (for example, from a confidence interval or P value).We will include the safety and efficacy assessment of drugs.
Statistical analysis
Pairwise meta-analysis of the included RCTs with random effect model due to the expected heterogeneity will be conducted [15-16]. Mean difference (MD) will be used to synthesis the continuous outcome data: mean changes from baseline of the risk factors in both arms. I2 was used to estimate the heterogeneity. Networks will be generated to visualize the results of the pairwise meta-analysis and the current evidence from the included RCTs [17].
NAM based on the Bayesian hierarchical model will be performed to compare the efficacy of selected drugs. Placebo will be used as common comparisonin NMA [18]. Relative MD to the placebo will be output to assess the efficacy. The probability of each drug being ranked in each position based on risk factors will be computed [19]. Kendall’s test will be used to test the correlation between the relative MD and the ranking position.
Sensitivity analysis based on the sample size of the RCTs will be conducted when RCTs with sample size less than 50 are excluded. Sensitivity analysis will also be conducted on different baselines. Meta-regression analyses will be conducted on the different follow-up periods and dosages for drugs of the included RCTs. Begg's and Egger's tests21 will be used to evaluate the publication bias [20]. The agreement will be computed to assess the consistency between pairwise and network meta-analyses.
R software will be used to implement the analysis workflow. Package “metafor” will be used to conduct the pairwise meta-analysis. Package ‘igraph’ will be used to visualize the networks [21-24]. Package ‘fmsb’ will be used to visualize the results of risk of bias assessment. Package ‘GeMTC’, ‘R2WinBUGS’ in R and WinBUGS will be used to conduct NAM. Package ‘ggplot2’will be used to visualize the distribution of ranking probability distribution [25-30]. p Values lower than 0.05 will be considered statistically significant.
Assessment of risk of bias of included studies
Two reviewers will evaluate the risk of bias of the selected RCTs according to the criteria and technique proposed in the Cochrane Handbook V.5.1.0, which includes random sequence generation (selection bias), allocation concealment (selection bias), blinding of participants and personnel (performance bias), blinding of outcome assessment (detection bias), incomplete outcome data (attrition bias), selective reporting (reporting bias) and other bias. Each study will be assigned a level of risk of bias (high risk, unclear risk, low risk) for each item [21]. Any disagreement will be resolved through discussion or consultation with a third independent adjudicator.
Geometry of the network
A network plot will be drawn to present the geometry of the network of comparisons across trials to ensure a NMA is feasible. Trials will be excluded if they are not connected by interventions. Nodes in network geometry represent different interventions and edges represent head to head comparisons. The size of nodes and thickness of edges are associated with sample sizes and numbers of RCTs, respectively.
Heterogeneity
We will assess clinical and methodological heterogeneity through examination of the characteristics of the included trials. Heterogeneity across trials will be assessed by c2 and I2 statistics. If the P value is ≥0.1 and I2 ≤ 50%, which suggests there is no statistical heterogeneity, then the Mantel–Haenszel fixed effects model will be employed. If the P value is < 0.1 and I2 > 50%, we will explore sources of heterogeneity by subgroup analysis and meta-regression. If no clinical heterogeneity is identified, the Mantel–Haenszel random effects model will be used [32]. Publication bias will be examined using Begg’s and Egger’s funnel plot method when applicable [33-34]. In addition, the contour-enhanced funnel plot will be obtained as an aid to distinguish asymmetry due to publication bias [35].
Network meta-analysis
We will perform Bayesian NMAs with the package ‘gemtc’ V.0.8.1 of R-3.3.2 software36 to compare the effects of different prophylactic agents. The Markov Chains Monte Carlo sampler will be used to generate samples. A total of 5000 simulations for each chain will be set as the ‘burn-in’ period. Then, posterior summaries will be based on 100 000 subsequent simulations. Model convergence will be assessed using the Brooks–Gelman–Rubin plots method [37]. Global heterogeneity will be assessed on the bias of the magnitude of heterogeneity variance parameter (I2 or τ2) estimated from the NMA models using the mtc.anohe command of the ‘gemtc’ package. A node splitting method will be used to examine the inconsistency between direct and indirect comparisons when a loop connecting three arms exists [38]. The ranking probabilities for all treatments will be estimated, and a treatment hierarchy using the probability of being the best treatment can be obtained. This process will be performed using the cumulative ranking curve (SUCRA) [39]. SUCRA values are expressed as percentages-100% for the best treatment, 0% for the worst treatment. We will also try to use the frequentist approach to compare stability if necessary [40-41].
Assessment of the quality of evidence
The quality of evidence will be evaluated using the Grading of Recommendations Assessment, Development and Evaluation (GRADE) using four levels-high quality, moderate quality, low quality and very low quality [42]. This process will be performed with the online guideline development tool (GDT, http://gdt.guidelinedevelopment.org/).
Meta-regression
In case there is significant heterogeneity and inconsistency, we will use meta-regression to explain the heterogeneity, provided we have enough data to do so; otherwise, we will perform subgroup analyses. We will perform meta-regression using study-level covariates: methodological quality (high risk of bias versus low risk of bias), participant’s average age, BMI status (obese and/or overweight BMI ≥ 25 kg/m2 versus normal < 25 kg/m2), homeostatic model assessment (HOMA-IR) (high and moderate ≥ 3 versus low < 3), medication dose, length of treatment (≥ 3 months versus < 3 months). We will also perform a subgroup analysis to assess the efficacy of different oral formulations to verify changes in MetS risk factors.
Rating the confidence in estimates of the effect in NMA
The confidence in the estimates (quality of evidence) for each reported outcome will be assessed independently by two reviewers (LR, FCV) using the Grading of Recommendations Assessment, Development, and Evaluation Working Group (GRADE Working Group) approach; for the flow of quality assessment [43]. The quality of evidence is categorized by GRADE into four levels: high quality, moderate quality, low quality, and very low quality. For the direct comparisons, we will assess and rate each outcome based on the five GRADE categories: risk of bias, imprecision, inconsistency, indirectness, and publication bias [44]. For the assessment of confidence in the estimates obtained in the NMA, we will use the recent approach recommended by the GRADE working group [45]. We will assess and rate the confidence in all the indirect comparisons, if available, obtained from first order loops following the five GRADE categories used for assessing the direct comparisons in addition to the intransitivity assessment. Then, we will rate the confidence in each NMA effect estimate using the higher quality rating when both direct and indirect evidence are present. However, the estimate can be rated down for incoherence [46].
Amendments
If it is necessary, we will update this protocol in the future. We will submit the original protocol, final protocol and summary of changes as a supplement.
Ethics and dissemination
Ethical issues: No ethical approval is required because this study includes no confidential personal data or interventions with the patients.
Publication plan: The procedures of this systematic review and NAM will be conducted in accordance with the PRISMA-compliant guideline. The results of this systematic review and NAM will be submitted to a peer-reviewed journal for publication.
Authors’ information: Not applicable.
Competing interests
The authors declare that they have no competing interests.
Consent for publication
Not applicable.
Ethics approval and consent to participate
Not applicable.
Availability of supporting data
Not applicable.
Funding
Not applicable.
Authors' contributions
LR, ASRB, ALDD, ACF, NPS, PMMD, RMLS, JLO, MN, AD, GBFO, GBZ, SAH, PEOR, AJG, RMP, ACF, PMMD, TMF, NN, SA, CD, PFSG, A.A, AVH, MIR, RDL, GT, TL and FCV conceived the study idea and devised the study methodology. LR, ASRB, ACPC and ESR participated in the design and coordination of the study. LR was primarily responsible for protocol writing and developed the search strategy. LR and FCV will screen identified literature, conduct data extraction and analyses the review findings. All authors read the drafts, provided comments and agreed on the final version of the manuscript.
Acknowledgements
Not applicable.
References
- Basurto Acevedo L, Barrera Hernández S, Fernández Muñoz MJ, Saucedo García RP, Rodríguez Luna AK, et al. (2018) An increase in epicardial fat in women is associated with thrombotic risk. Clin Investig Arterioscler 30: 112-117.
- Oliveira GBF, Avezum A, Roever L (2015) Cardiovascular disease burden: evolving knowledge of risk factors in myocardial infarction and stroke through population-based research and perspectives in global prevention. Front Cardiovasc Med 200032.
- Roever L, Biondi-Zoccai G, Chagas AC3 (2016) Non-HDL-C vs. LDL-C in Predicting the Severity of Coronary Atherosclerosis. Heart Lung Circ 25: 953-954. [Crossref]
- Roever LS, Resende ES, Diniz AL, Penha-Silva N, Veloso FC, et al. (2016) Abdominal Obesity and Association with Atherosclerosis Risk Factors: The Uberlândia Heart Study. Medicine (Baltimore) 95: e1357. [Crossref]
- Roever L, Resende ES, Diniz AL, Penha-Silva N, Veloso FC, et al. (2015) Ectopic adiposopathy and association with cardiovascular disease risk factors: The Uberlândia Heart Study. Int J Cardiol 190: 140-142. [Crossref]
- Roever L, Resende ES, Veloso FC, Diniz AL, Penha-Silva N, et al. (2015) Perirenal Fat and Association with Metabolic Risk Factors: The Uberlândia Heart Study. Medicine (Baltimore) 94: e1105. [Crossref]
- Van Rooy MJ, Pretorius E (2015) Metabolic syndrome, platelet activation and the development of transient ischemic attack or thromboembolic stroke. Thromb Res135: 434-442.
- Sarrafzadegan N, Gharipour M, Sadeghi M, Nezafati P4, Talaie M, et al. (2017) Metabolic Syndrome and the Risk of Ischemic Stroke. J Stroke Cerebrovasc Dis 26: 286-294. [Crossref]
- Sánchez-Iñigo L, Navarro-González D, Fernández-Montero A, Pastrana-Delgado J, Martínez JA (2017) Risk of incident ischemic stroke according to the metabolic health and obesity states in the Vascular-Metabolic CUN cohort. Int J Stroke 12: 187-191.
- Chei CL, Yamagishi K, Tanigawa T, Kitamura A, Imano H, et al. (2008) Metabolic Syndrome and the Risk of Ischemic Heart Disease and Stroke among Middle-Aged Japanese. Hypertens Res 31: 1887-1894. [Crossref]
- Fang X, Liu H, Zhang X, Zhang H, Qin X, et al. (2016) Metabolic Syndrome, Its Components, and Diabetes on 5-Year Risk of Recurrent Stroke among Mild-to-Moderate Ischemic Stroke Survivors: A Multiclinic Registry Study. Stroke Cerebrovasc Dis 25: 626-634.
- Glasziou P, Irwig L, Bain C, Colditz G (2001) Systematic reviews in health care: a practical guide. Cambridge: Cambridge University Press
- Higgins JP, Altman DG, Gøtzsche PC, Jüni P, Moher D, et al. (2011) The Cochrane Collaboration's tool for assessing risk of bias in randomised trials. BMJ 343: d5928. [Crossref]
- Chambers JM, Cleveland WS, Tukey PA et al. (1983) Graphical methods for data analysis. Wadsworth International Group, Duxbury Press
- Viechtbauer W (2005) Bias and efficiency of meta-analytic variance estimators in the random-effects model. J EducBehav Stat 30: 261-293
- Hedges LV, Vevea JL (1998) Fixed-and random-effects models in meta-analysis. Psychol Methods 3: 486-450
- Higgins JP, Thompson SG, Deeks JJ, Altman DG (2003) Measuring inconsistency in meta-analyses. BMJ 327: 557-560. [Crossref]
- Jansen JP, Fleurence R, Devine B et al (2011) Interpreting indirect treatment comparisons and network meta-analysis for health-care decision making: report of the ISPOR Task Force on Indirect Treatment Comparisons Good Research Practices: part 1. Value Health 14: 417-428
- Cipriani A, Furukawa TA, Salanti G et al. (2009) Comparative efficacy and acceptability of 12 new-generation antidepressants: a multiple-treatments meta-analysis. Lancet 373:746-758
- Begg CB, Mazumdar M (1994) Operating characteristics of a rank correlation test for publication bias. Biometrics 50: 1088-1101. [Crossref]
- Egger M, Davey Smith G, Schneider M, Minder C (1997) Bias in meta-analysis detected by a simple, graphical test. BMJ 315: 629-634. [Crossref]
- (2008) R Development Core Team. R: a language and environment for statistical computing. Reference index version 2.12.0. R Foundation for Statistical Computing, Vienna, Austria
- Viechtbauer W (2010) Conducting meta-analyses in R with the metafor package. J Stat Softw 36: 1-48.
- Csardi G, Nepusz T (2006) The igraph software package for complex network research. Inter J Complex Syst 1695.
- Nakazawa M (2014) Functions for medical statistics book with some demographic data. R package Version
- Van Valkenhoef G, Lu G, de Brock B, Hillege H, Ades AE, et al. (2012) Automating network meta-analysis. Res Synth Methods 3: 285-299. [Crossref]
- Sturtz S, Ligges U, Gelman A (2005) A package for running WinBUGS from R. J Stat Softw 12: 1-16.
- Lunn DJ, Thomas A, Best N et al. (2000) WinBUGS—a Bayesian modelling framework: concepts, structure, and extensibility. Stat Comput 10: 325-333
- Wickham H (2009) ggplot2: Elegant Graphics for Data Analysis. Springer.
- Jia Y, Lao Y, Leung SW2 (2015) Glycaemic control efficacy of oral antidiabetic drugs in treating type 2 diabetes: a protocol for network meta-analysis. BMJ Open 5: e006139. [Crossref]
- Higgins JPT GS (2011) Cochrance handbook for systematic reviews of interventions version 5.1.0[EB/OL]: The Cochrane Collaboration.
- Begg CB, Mazumdar M (1994) Operating characteristics of a rank correlation test for publication bias. Biometrics 50: 1088-1101. [Crossref]
- Egger M, Davey Smith G, Schneider M, Minder C (1997) Bias in meta-analysis detected by a simple, graphical test. BMJ 315: 629-634. [Crossref]
- Peters JL, Sutton AJ, Jones DR, et al. (2008) Contour-enhanced metaanalysis funnel plots help distinguish publication bias from other causes of asymmetry. J ClinEpidemiol 61: 991-996.
- Van Valkenhoef G, Kuiper J. gemtc: network meta-analysis using Bayesian methods.
- Wu HY, Huang JW, Lin HJ, Liao WC, Peng YS, et al. (2013) Comparative effectiveness of renin-angiotensin system blockers and other antihypertensive drugs in patients with diabetes: systematic review and bayesian network meta-analysis. BMJ 347: f6008. [Crossref]
- Lu G, Ades AE (2004) Combination of direct and indirect evidence in mixed treatment comparisons. Stat Med 23: 3105-3124. [Crossref]
- Salanti G, Ades AE, Ioannidis JP (2011) Graphical methods and numerical summaries for presenting results from multiple-treatment meta-analysis: an overview and tutorial. J ClinEpidemiol 64: 163-171.
- Hoaglin DC, Hawkins N, Jansen JP, et al. (2011) Conducting indirecttreatment-comparison and network-meta-analysis studies: report of the ISPOR Task Force on Indirect Treatment Comparisons Good Research Practices: part 2. Value Health 14: 429-437.
- (2017) Comparing bayesian and frequentist approaches for network metaanalysis: An empirical study.
- Puhan MA, Schünemann HJ, Murad MH, Li T, Brignardello-Petersen R, et al. (2014) A GRADE Working Group approach for rating the quality of treatment effect estimates from network meta-analysis. BMJ 349: g5630. [Crossref]
- Guyatt G, Oxman AD, Akl EA, Kunz R, Vist G, et al. (2011) GRADE guidelines: 1. Introduction-GRADE evidence profiles and summary of findings tables. J Clin Epidemiol 64: 383-394. [Crossref]
- Guyatt GH, Oxman AD, Kunz R, Woodcock J, Brozek J, et al. (2011) GRADE guidelines: 8. Rating the quality of evidence-indirectness. J ClinEpidemiol 64: 1303-1310.
- Puhan MA, Schünemann HJ, Murad MH, Li T, Brignardello-Petersen R, et al. (2014) A GRADE Working Group approach for rating the quality of treatment effect estimates from network meta-analysis. BMJ 349: g5630. [Crossref]
- Guyatt G, Oxman AD, Akl EA, Kunz R, Vist G, et al. (2011) GRADE guidelines: 1. Introduction-GRADE evidence profiles and summary of findings tables. J Clin Epidemiol 64: 383-394. [Crossref]
- Guyatt GH, Oxman AD, Kunz R, Woodcock J, Brozek J, et al. (2011) GRADE guidelines: 8. Rating the quality of evidence—indirectness. J Clin Epidemiol 64: 1303-1310.