Highlights
·Nicotine addiction is a serious public health concern because genetic and developmental vulnerability to nicotine effects predispose to neurological disorders.
·Use of quasi-congenic inbred RQI and progenitor mouse strains revealed significant genetic control of olfactory bulb serotonin content, which can be traced to serotonergic raphe nuclei which innervate the olfactory bulb.
·Co-analysis of olfactory bulb serotonin data with our previously reported nicotine-induced behavioral sensitization data showed significant negative between-strain correlation raising the possibility of genetic correlation.
Abstract
Tobacco is a widely consumed psychoactive substance. Nicotine, its active ingredient, is highly addictive. Genetic and developmental vulnerability to nicotine effects predispose adolescents to numerous diseases including neurological conditions, thus nicotine is a serious public health concern. Nicotine-induced behavioral sensitization is often linked to addiction. The mechanism of sensitization is not well known due to the complexity of the involved neural systems and heterogeneity in chemical neuronal identity even in sub-systems. For better understanding the neurochemical processes underlying sensitization and the influence of genetic variability we used an established protocol for nicotine-induced locomotor sensitization in the mouse to explore inbred strain differences in nicotine-induced neurotransmitter and metabolite changes in the hippocampus (HIP) and the Olfactory Bulb (OB). The results revealed significant genetic control of olfactory bulb serotonin content: In the C57BL/6By strain the OB serotonin content is more than three times as high as the OB serotonin content in the BALB/cJ strain. Co-analysis of OB serotonin data with our previously reported behavioral sensitization data showed significant negative between-strain (i.e., largely genetic) correlation. GLM MANCOVA did not indicate significant nicotine treatment effects on noradrenaline, DOPAC, and HVA content in HIP and OB. The results suggest strong genetic control of OB serotonin content, which may be traced to serotonergic raphe nuclei which innervate the OB. Further research may shed light on genetic vulnerability to behavioral disorders which are modulated by brain serotonin systems.
Keywords
nicotine, sensitization, behavior, locomotor activity, serotonin, 5-HT, RQI, mouse, strain, biogenic amines
Introduction
Nicotine can induce behavioral sensitization which has been hypothesized to be involved in drug addiction and related to changes in activity of the mesolimbic circuitry [1-6]. Nicotine affects gene expression in smokers [7], in rats [8] and mice [5,9].
We established a mouse model of nicotine-induced locomotor sensitization using a genetically mixed population of laboratory mice for assessing nicotine’s generalized, i.e., not strain-specific, effects on behavioral sensitization, and on mesencephalic gene expression [5]. Then, to address the question of strain-dependent specificity of transcriptome response to nicotine, we investigated the genetics of genomic response to nicotine in the ventral tegmentum of widely used, inbred mouse strains (C57BL/6ByJ, BALB/cJ progenitor strains) and inbred quasi-congenic Recombinant QTL Introgression (RQI) strains derived from the progenitor strains. Another aim of that study was to facilitate mapping of QTLs for nicotine-induced locomotor sensitization by combining the use of advanced quasi-congenic animal models with global gene expression profiling, and to identify candidate genes involved in neurochemical pathways of adaptation [9].
The limbic system of the brain is involved in expression of emotions and behaviors including substance use disorder related behaviors. It has traditionally been divided into cortical and subcortical components. Here, using mice and our nicotine-induced locomotor sensitization method, we addressed the question of changes of neurotransmitter and metabolite content in mouse cortical (hippocampus) and subcortical (olfactory bulb) limbic system [10,11].
Materials and Methods
Parts of the Materials and Methods, as applied for investigation of gene expression in the mouse ventral tegmentum, has been reported [9]. Here, we summarize the relevant aspects of it and describe the modifications: use of different analytic technique (HPLC) and different brain regions (hippocampus and olfactory bulb).
Experimental design
A three factor (10 Strain x 3 Treatment x 2 Brain Region) design was followed with 5 dependent variables serotonin (5-hydroxytryptamine, 5-HT) 5-Hydroxyindoleacetic (5-HIAAA), noradrenaline (NA), 3,4-Dihydroxyphenylacetic acid (DOPAC), homovanillic acid (HVA). The sample size in Brain Region was 18-91, in Treatment 36-38, in Strains 8-14. Data have also been obtained for two other variables (dopamine, adrenaline), however, these have been excluded from analysis because of insufficient sample size. The Between-Subjects Factors and relevant sample sizes are shown in Table 1.
Table 1. Between-Subjects Factors |
|
Value Label |
N |
BRAIN REGION |
HIPPOCAMPUS |
18 |
| |
OLFACTORY BULB |
91 |
TREATMENT |
SALINE |
38 |
| |
NICOTINE |
35 |
| |
NONE |
36 |
STRAIN |
B6By |
10 |
| |
BALB/cJ |
14 |
| |
C5A3 |
11 |
| |
C4A4 |
14 |
| |
C4A6B |
13 |
| |
C4A6N |
9 |
| |
C4A12 |
11 |
| |
C4B13 |
8 |
| |
C4B13C |
11 |
|
I5B25A |
8 |
Intermittent nicotine treatment was performed on 10 strains as described [9]. Littermate mice were chosen as triplets, and each member of the triplet was assigned to either NICOTINE (NIC), CONTROL1 (SAL), or CONTROL2 (NONE) groups.
Animals were subjected to behavioral tests and intermittent nicotine or saline injections for 41 days. Home cage locomotor activity tests took place on Day 1 and Day 41. Activity test Day 1 Hour 1 (D1H1) was immediately followed by test Day 1 Hour 2 (D1H2), each lasted for 60 min. In the D1H1 test mice of both the NIC and the CONTROL1 (SAL) groups received saline, the CONTROL2 (NONE) group was not treated. In the D1H2 test mice of the NIC group received nicotine, while mice of the CONTROL1 group received saline. From Day 2 to 19, saline (CONTROL1 group) or nicotine (NIC group) was injected once a day Monday through Friday (‘‘intermittent nicotine exposure phase’’). From Day 20 to 40 animals were not treated (‘‘withdrawal phase’’). CONTROL2 (NONE) animals were not handled or treated from Day 2 to Day 40. On day 41, a 60-min post-sensitization activity test was performed for all subjects without any injection (D41H1), which was followed immediately by a nicotine injection and a 60-min activity test (D41H2, ‘‘challenge-test’’). Locomotor activity of animals in home cages was measured for 60 min with an infrared beam-based activity sensor (Opto-Varimex-3 Auto-Track system, Columbus Instruments, Columbus, OH).
Drugs
For injections, 0.5 mg/kg nicotine (0.1 ml) or saline (0.1 ml) was administered subcutaneously. Nicotine base was calculated as 35% of the salt (–)-nicotine hydrogen tartarate. Nicotine was dissolved in unbuffered sterile saline; freshly prepared daily.
Animals
Inbred quasi-congenic Recombinant QTL Introgression (RQI) mice derived from C57BL/6ByJ background and BALB/cJ donor strains were used [12-16].
RQI strains were developed by a series of backcrosses to the background strain with concomitant phenotypic selection, followed by inbreeding [17]. Genomes of C4A4 and I5B25A mice are highly similar to the genome of the B6By background strain, however, they carry small chromosome segments of BALB/cJ origin, which can harbor quantitative trait loci responsible for behavioral differences [18] (genotype information can be obtained at http://RQIgenetics.org/ ). Because in our previous studies females showed higher sensitivity to repeated psychostimulant exposure, experiments of the present study were also carried out on females. At the beginning of the experiment mice were 115 ± 15 days old (mean ± SD). All subjects were raised and maintained in our research colony at the Animal Facility of The Nathan S. Kline Institute, Orangeburg, New York. Animals were maintained on a 12-h light/12-h dark schedule with free access to food (Purina #5008) and water. The care and use of animals were approved by the Nathan Kline Institute for Psychiatric Research Institutional Animal Care and Use Committee. All procedures were in accordance with the Guidelines for the Care and Use of Mammals in Neuroscience and Behavioral Research (Committee on Guidelines for the Use of Animals in Neuroscience and Behavioral Research, 2001).
Brain tissue dissection
Brain regions were dissected twenty-four hour after the challenge nicotine injection. Animals were killed by cervical dislocation. The brains were rapidly removed and dissected on ice-cold Peltier cold plate in the following order: Olfactory Bulb (OB), hypothalamus (HTH), Pons-Medulla (POM), Mesencephalon (MES), Nucleus Accumbens (NAC), Dorsal Corpus Striatum (DCS), and hippocampus (HIP).
Left and right OLB were pinched off with micro dissecting forceps at their base (about Bregma 3.5) [19] with a slightly oblique cut avoiding inclusion of the frontal cortex. Left and right OLB were pooled. HTH was dissected with four scissor-cuts bordered by the chiasma opticum (rostrally), choroidal fissures (laterally), and the rostral pole of the mammilary bodies (caudally). HTH, excluding the preoptic and mammilary areas, was removed en bloc by dissection from a ventral approach [14,15]. After removing the cerebellum, the superior colliculi were gently pushed rostrally. At about Bregma 7.6 (just rostral to paraflocculi in the ventral face of the brain) a vertical razor blade cut was applied to remove the pons and medulla oblongata. Using a narrow stainless steel spatula, MES was removed en bloc, including all dopaminergic cell body areas [substantia nigra, ventral tegmentum and rubral area; see Figure 2 in [16], with the following boundaries: caudal, posterior edge of the inferior colliculus, rostral, anterior edge ofsuperior colliculus at about 6 mm posterior to Bregma. After removal of the bloc, its dorsal part was cut off by a razor blade at the level of the cerebral aqueduct.
After removing the above regions, the forebrain was hemisected along its longitudinal axis. The hippocampus (HIP) was dissected following Jaszczik, et al. [20]. At about Bregma 1.8, (i.e., at about 1/3 of the distance between the tip of corpus callosum and the base of olfactory bulb) both halves were coronally cut. A second coronal cut was applied about 0.5 mm anterior to the anterior comissure, at about Bregma 0.5. Finally, the brain was cut horizontally at the level just above the anterior comissure. The dorsal portion above the horizontal cut was collected as DCS after removing cortex and corpus callosum with the following boundaries: lateral, lateral ventricle and corpus callosum; dorsal, corpus callosum; ventral, horizontal cutdescribed above. After the horizontal cut applied in DCS dissection, the ventral portion was collected as NAC. It also included small adjacent areas of olfactory tubercle, pyriform cortex, and ventral pallidum, etc.
After dissection, samples were placed in pre-cooled microcentrifuge tubes, and kept on dry ice until storing at -80 C in ultrafreezer. Samples were collected in six experimental batches.
HPLC Procedures
HPLC separation of biogenic amines and their metabolites
Biogenic monoamines and metabolites were extracted from frozen tissue by homogenizing with 300 uL ice cold 0.1M perchloric acid (PCA) containing 100 pg DHBA (3, 4- dihydroxy benzyl amine) per 10 µL as an internal standard. Each homogenate was divided into three equal parts for triplicate assay. The homogenates were centrifuged at 12,000x g for 10 min at 4oC. DA, DOPAC, HVA, A, NA, 5-HT, and 5-HIAA in the supernatant were separated concurrently with a reversed-phase ion pair high performance liquid chromatography system and detected electrochemically (HPLC – EC; Bioanalytical System, Inc, West Lafayette, IN).
Supernatants were filtered through 0.2 µm nylon filters. 10 µl aliquots of each supernatant were injected into a “Unijet LC Column” C18 reverse phase column (100 x 2.0 mm, 3µm, Bioanalytical Systems, Inc, West Lafayette, IN). Separation were performed at a flow rate of 0.4 ml/min using a mobile phase of 50.0 mM citrate phosphate buffer (pH 3.5) containing 30 µM EDTA, 10 mM 1- octanesulfonic acid, 10 mM dimethylamine, 1.7% acetonitrile and 1.1% N’, N’-dimethylamide. Quantitation was carried out with electrochemical detector set at +750 mV with reference to an Ag- AgCl reference electrode, and the sensitivity of the detector was maintained at 10.0 nA. Peak identifications and calculations of concentrations were determined by comparing retention times and peak areas with those of known external standards with 5-10% deviation of retention time. The concentrations of the neurotransmitters were calculated from the standard curve of each neurotransmitter and expressed as pg/mg of wet weight of the tissue. Values are expressed as mean ± SD. Experimental data were calculated as pg/mg of wet weight of the tissue Figure 1.
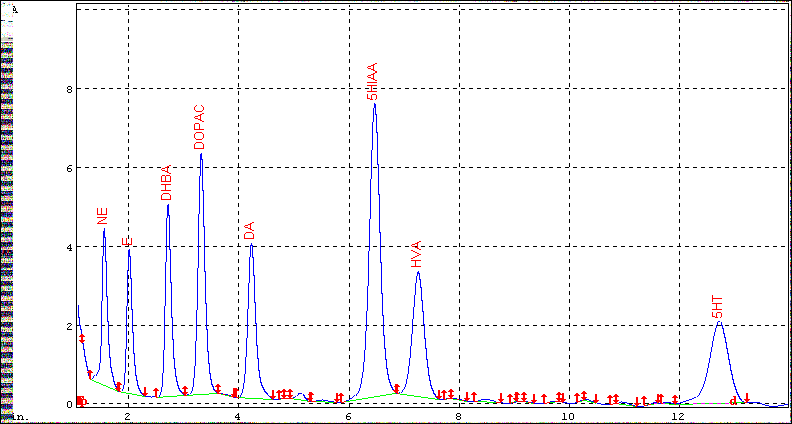
Figure 1: Separation profile for biogenic amines and their metabolites (250 pg each). 3, 4- dihydroxy benzyl amine, DHBA, (200 pg) was used as an internal standard.
Results
GLM MANCOVA with 3 factors and 4 variables
Dissected brain regions other than OLB and HIP have been excluded because of inadequate sample size or technical reasons. Because some of the HIP 5-HIAAA, A and dopamine DA data were missing, these data were not included in the comprehensive GLM MANCOVA. Multivariate tests (Pillai's Trace, Wilks' Lambda, Hotelling's Trace, Roy's Largest Root) showed significant strain (p < 0.000) and brain region (p < 0.000) effects, while the TREAT factor effect was not significant (p > 0.05).
The factors included STRAIN, TREAT, and BRAIN REGION (Table 2). Tests of between-subjects effects showed significant effects of STRAIN on 5HT and HVA (p < 0.05). TREAT had no significant effects (p > 0.05), while BRAIN REGION was a significant source of variability in 5HT, NA, DOPAC, and HVA (p < 0.05). In interaction effects STRAIN*BRAIN REGION was significant for 5-HT (Table 3). Accordingly, for further analysis of the sources of variation BRAIN REGIONs HIP and OB were investigated separately.
Table 1. Between-Subjects Factors |
|
Value Label |
N |
BRAIN REGION |
HIPPOCAMPUS |
18 |
| |
OLFACTORY BULB |
91 |
TREATMENT |
SALINE |
38 |
| |
NICOTINE |
35 |
| |
NONE |
36 |
STRAIN |
B6By |
10 |
| |
BALB/cJ |
14 |
| |
C5A3 |
11 |
| |
C4A4 |
14 |
| |
C4A6B |
13 |
| |
C4A6N |
9 |
| |
C4A12 |
11 |
| |
C4B13 |
8 |
| |
C4B13C |
11 |
|
I5B25A |
8 |
Table 2. Between-Subjects Factors
|
N |
STRAIN |
B6 |
10 |
BALB/cJ |
14 |
C4A12 |
14 |
C4A4 |
21 |
C4A6B |
17 |
C4A6N |
14 |
C4B13 |
14 |
C4B13C |
16 |
C5A3 |
11 |
I5B25A |
9 |
BRAIN REGION |
HIP |
45 |
OLB |
95 |
TREAT |
NIC |
50 |
NONE |
44 |
SAL |
46 |
Table 3. Tests of Between-Subjects Effects
Source |
Dependent Variable |
Type III Sum of Squares |
df |
Mean Square |
F |
Sig. |
Corrected Model |
ht5 |
9014687.163a |
53 |
170088.437 |
7.292 |
0.000 |
na |
6482372.326b |
53 |
122308.912 |
1.021 |
0.459 |
dopac |
46554.376c |
53 |
878.384 |
1.134 |
0.299 |
hva |
375510.683d |
53 |
7085.107 |
2.548 |
0.000 |
Intercept |
ht5 |
17342044.650 |
1 |
17342044.650 |
743.462 |
0.000 |
na |
12017147.310 |
1 |
12017147.310 |
100.315 |
0.000 |
dopac |
90296.637 |
1 |
90296.637 |
116.536 |
0.000 |
hva |
466431.798 |
1 |
466431.798 |
167.761 |
0.000 |
STRAIN |
ht5 |
929199.940 |
9 |
103244.438 |
4.426 |
0.000 |
na |
443736.077 |
9 |
49304.009 |
0.412 |
0.926 |
dopac |
6772.205 |
9 |
752.467 |
0.971 |
0.470 |
hva |
88206.910 |
9 |
9800.768 |
3.525 |
0.001 |
BRAIN REGION |
ht5 |
5135659.671 |
1 |
5135659.671 |
220.168 |
0.000 |
na |
3489022.258 |
1 |
3489022.258 |
29.125 |
0.000 |
dopac |
12550.967 |
1 |
12550.967 |
16.198 |
0.000 |
hva |
117308.218 |
1 |
117308.218 |
42.192 |
0.000 |
TREAT |
ht5 |
48946.667 |
2 |
24473.334 |
1.049 |
0.355 |
na |
9640.423 |
2 |
4820.212 |
0.040 |
0.961 |
dopac |
631.544 |
2 |
315.772 |
0.408 |
0.667 |
hva |
2084.363 |
2 |
1042.182 |
0.375 |
0.689 |
strain * brain region |
ht5 |
895120.316 |
8 |
111890.040 |
4.797 |
0.000 |
na |
237194.818 |
8 |
29649.352 |
0.248 |
0.980 |
dopac |
2382.859 |
8 |
297.857 |
0.384 |
0.926 |
hva |
13306.740 |
8 |
1663.342 |
0.598 |
0.777 |
strain * treat |
ht5 |
435025.376 |
18 |
24168.076 |
1.036 |
0.430 |
na |
822381.172 |
18 |
45687.843 |
0.381 |
0.988 |
dopac |
9833.659 |
18 |
546.314 |
0.705 |
0.797 |
hva |
21851.195 |
18 |
1213.955 |
0.437 |
0.975 |
brainregion * treat |
ht5 |
29484.971 |
2 |
14742.486 |
0.632 |
0.534 |
na |
149599.203 |
2 |
74799.602 |
0.624 |
0.538 |
dopac |
1067.582 |
2 |
533.791 |
0.689 |
0.505 |
hva |
420.514 |
2 |
210.257 |
0.076 |
0.927 |
strain * brainregion * treat |
ht5 |
380003.031 |
13 |
29231.002 |
1.253 |
0.258 |
na |
256352.344 |
13 |
19719.411 |
0.165 |
1.000 |
dopac |
2383.618 |
13 |
183.355 |
0.237 |
0.997 |
hva |
10618.988 |
13 |
816.845 |
0.294 |
0.991 |
Error |
ht5 |
2006041.489 |
86 |
23326.064 |
|
|
na |
10302304.670 |
86 |
119794.240 |
|
|
dopac |
66636.367 |
86 |
774.841 |
|
|
hva |
239108.717 |
86 |
2780.334 |
|
|
Total |
ht5 |
27530391.060 |
140 |
|
|
|
na |
41810209.000 |
140 |
|
|
|
dopac |
290052.000 |
140 |
|
|
|
hva |
1666984.000 |
140 |
|
|
|
Corrected Total |
ht5 |
11020728.650 |
139 |
|
|
|
na |
16784676.990 |
139 |
|
|
|
dopac |
113190.743 |
139 |
|
|
|
hva |
614619.400 |
139 |
|
|
|
a. R Squared = 0.818 (Adjusted R Squared = 0.706) |
b. R Squared = 0.386 (Adjusted R Squared = 0.008) |
c. R Squared = 0.411 (Adjusted R Squared = 0.048) |
d. R Squared = 0.611 (Adjusted R Squared = 0.371) |
GLM MANCOVA of HIP data with factors TREAT, STRAIN and 4 variables
For the separate analysis of HIP data, between-subject factors are shown in Table 4. Tests of between-subjects effects showed that STRAIN and TREAT factors were not a significant source of variation in 5HT, 5HIAAAA, NA, DOPAC, and HVA (p > 0.05; Table 5). Using only HIP data, tests of between-subjects effects showed that STRAIN and TREAT factors were not a significant source of variation in 5HT, NA, DOPAC, and HVA (p > 0.05; Table 4).
Table 4. Between-Subjects Factors
|
N |
STRAIN |
B6 |
2 |
BALB/cJ |
4 |
C4A12 |
5 |
C4A4 |
9 |
C4A6B |
7 |
C4A6N |
4 |
C4B13 |
6 |
C4B13C |
6 |
I5B25A |
1 |
TREAT |
NIC |
16 |
NONE |
12 |
SAL |
16 |
BRAIN REGION |
HIP |
44 |
GLM MANCOVA of OLB data with factors TREAT, STRAIN and 4 variables
For the separate analysis of OLB data, between-subject factors are shown in Table 6, Table 7 shows 5-HT and HVA content (pg/mg)in OLB. Tests of between-subjects effects showed that STRAIN was significant for 5HT and HVA (p < 0.05), while TREAT or interactions were not significant sources of variation in 5HT, NA, DOPAC, and HVA (p > 0.05; Table 8). Thus, the results suggest that genetic (STRAIN) variation in OLB is the primary source of the variation. Because TREAT was not a significant source of variability, for further GLM MANCOVA the 3 subgroups (SAL, NIC, and NONE) were collapsed into one, not distinguished.
Table 5. Tests of Between-Subjects Effects
Source |
Dependent Variable |
Type III Sum of Squares |
df |
Mean Square |
F |
Sig. |
Corrected Model |
ht5 |
1835535.792a |
23 |
79805.904 |
1.048 |
0.459 |
na |
201233.944b |
23 |
8749.302 |
0.503 |
0.944 |
dopac |
2848.711c |
23 |
123.857 |
0.461 |
0.963 |
hva |
3291.800d |
23 |
143.122 |
0.212 |
1.000 |
Intercept |
ht5 |
15287918.440 |
1 |
15287918.440 |
200.808 |
0.000 |
na |
930968.636 |
1 |
930968.636 |
53.474 |
0.000 |
dopac |
10457.331 |
1 |
10457.331 |
38.952 |
0.000 |
hva |
24325.911 |
1 |
24325.911 |
36.015 |
0.000 |
STRAIN |
ht5 |
1154592.030 |
8 |
144324.004 |
1.896 |
0.115 |
na |
144811.333 |
8 |
18101.417 |
1.040 |
0.439 |
dopac |
1447.437 |
8 |
180.930 |
0.674 |
0.709 |
hva |
2282.023 |
8 |
285.253 |
0.422 |
0.895 |
BRAINREGION |
ht5 |
0.000 |
0 |
. |
. |
. |
na |
0.000 |
0 |
. |
. |
. |
dopac |
0.000 |
0 |
. |
. |
. |
hva |
0.000 |
0 |
. |
. |
. |
TREAT |
ht5 |
58649.267 |
2 |
29324.634 |
0.385 |
0.685 |
na |
12998.411 |
2 |
6499.205 |
0.373 |
0.693 |
dopac |
66.839 |
2 |
33.420 |
0.124 |
0.884 |
hva |
111.183 |
2 |
55.592 |
0.082 |
0.921 |
strain * brainregion |
ht5 |
0.000 |
0 |
. |
. |
. |
na |
0.000 |
0 |
. |
. |
. |
dopac |
0.000 |
0 |
. |
. |
. |
hva |
0.000 |
0 |
. |
. |
. |
strain * treat |
ht5 |
588911.097 |
13 |
45300.854 |
0.595 |
0.831 |
na |
49793.165 |
13 |
3830.243 |
0.220 |
0.996 |
dopac |
1162.259 |
13 |
89.405 |
0.333 |
0.977 |
hva |
905.971 |
13 |
69.690 |
0.103 |
1.000 |
brainregion * treat |
ht5 |
0.000 |
0 |
. |
. |
. |
na |
0.000 |
0 |
. |
. |
. |
dopac |
0.000 |
0 |
. |
. |
. |
hva |
0.000 |
0 |
. |
. |
. |
strain * brainregion * treat |
ht5 |
0.000 |
0 |
. |
. |
. |
na |
0.000 |
0 |
. |
. |
. |
dopac |
0.000 |
0 |
. |
. |
. |
hva |
0.000 |
0 |
. |
. |
. |
Error |
ht5 |
1598771.494 |
21 |
76131.976 |
|
|
na |
365607.967 |
21 |
17409.903 |
|
|
dopac |
5637.867 |
21 |
268.470 |
|
|
hva |
14184.200 |
21 |
675.438 |
|
|
Total |
ht5 |
23256437.860 |
45 |
|
|
|
na |
1958299.000 |
45 |
|
|
|
dopac |
22780.000 |
45 |
|
|
|
hva |
51096.000 |
45 |
|
|
|
Corrected Total |
ht5 |
3434307.286 |
44 |
|
|
|
na |
566841.911 |
44 |
|
|
|
dopac |
8486.578 |
44 |
|
|
|
hva |
17476.000 |
44 |
|
|
|
a. R Squared = 0.534 (Adjusted R Squared = 0.025) |
b. R Squared = 0.355 (Adjusted R Squared = -0.351) |
c. R Squared = 0.336 (Adjusted R Squared = -0.392) |
d. R Squared = 0.188 (Adjusted R Squared = -0.701) |
Table 6. Between-Subjects Factors
|
N |
STRAIN |
B6 |
8 |
BALB/cJ |
10 |
C4A12 |
8 |
C4A4 |
12 |
C4A6B |
10 |
C4A6N |
10 |
C4B13 |
8 |
C4B13C |
10 |
C5A3 |
11 |
I5B25A |
8 |
BRAINREGION |
OLB |
95 |
TREAT |
NIC |
34 |
NONE |
31 |
SAL |
30 |
Table 7. 5-HT and HVA content (pg/mg) in OB
|
strain |
Mean |
Std. Deviation |
N |
5-HT |
B6 |
284.8325 |
88.19501 |
8 |
BALB/cJ |
88.9950 |
48.76169 |
10 |
C4A12 |
175.2638 |
78.41854 |
8 |
C4A4 |
179.5842 |
68.63924 |
12 |
C4A6B |
255.4410 |
97.43620 |
10 |
C4A6N |
227.2990 |
100.49865 |
10 |
C4B13 |
104.1187 |
44.27969 |
8 |
C4B13C |
214.5670 |
63.88360 |
10 |
C5A3 |
203.2791 |
53.75179 |
11 |
I5B25A |
180.3012 |
89.18745 |
8 |
Total |
191.6866 |
91.28489 |
95 |
HVA |
B6 |
118.00 |
73.836 |
8 |
BALB/cJ |
121.70 |
53.879 |
10 |
C4A12 |
119.63 |
50.356 |
8 |
C4A4 |
83.25 |
44.841 |
12 |
C4A6B |
87.20 |
67.870 |
10 |
C4A6N |
123.50 |
57.956 |
10 |
C4B13 |
91.88 |
48.457 |
8 |
C4B13C |
89.30 |
43.032 |
10 |
C5A3 |
193.27 |
40.321 |
11 |
I5B25A |
116.25 |
74.344 |
8 |
Total |
114.82 |
62.179 |
95 |
GLM MANCOVA of OB data with fixed factor STRAIN and 4 variables
Because of lack of significant differences between SAL, NIC, and NONE treatment groups, TREAT sub-groups were combined, not distinguished in further analysis of STRAIN effects on OB samples (descriptive statistics are shown in Table 9).Tests of between-subjects effects showed that STRAIN effect was significant for 5HT, and HVA (p < 0.05) Table 10).
Table 8. Tests of Between-Subjects Effects
Source |
Dependent Variable |
Type III Sum of Squares |
df |
Mean Square |
F |
Sig. |
STRAIN |
5-HT |
320079.481 |
9 |
35564.387 |
5.676 |
0.000 |
NA |
667345.137 |
9 |
74149.460 |
0.485 |
0.880 |
DOPAC |
7634.320 |
9 |
848.258 |
0.904 |
0.527 |
HVA |
106616.441 |
9 |
11846.271 |
3.423 |
0.002 |
TREAT |
5-HT |
1412.239 |
2 |
706.120 |
0.113 |
0.894 |
NA |
141724.495 |
2 |
70862.247 |
0.464 |
0.631 |
DOPAC |
1623.238 |
2 |
811.619 |
0.865 |
0.426 |
HVA |
3674.601 |
2 |
1837.300 |
0.531 |
0.591 |
Table 9. RQI and progenitor strain differences in OB 5-HT content (pg/mg)
|
strain |
Mean |
Std. Deviation |
N |
5-HT |
B6 |
284.8325 |
88.19501 |
8 |
BALB/cJ |
88.9950 |
48.76169 |
10 |
C4A12 |
175.2638 |
78.41854 |
8 |
C4A4 |
179.5842 |
68.63924 |
12 |
C4A6B |
255.4410 |
97.43620 |
10 |
C4A6N |
227.2990 |
100.49865 |
10 |
C4B13 |
104.1187 |
44.27969 |
8 |
C4B13C |
214.5670 |
63.88360 |
10 |
C5A3 |
203.2791 |
53.75179 |
11 |
I5B25A |
180.3012 |
89.18745 |
8 |
Total |
191.6866 |
91.28489 |
95 |
Tukey’s HSD Multiple Comparison test indicated that the two progenitor strains B6 and BALB/cJ significantly differed in OB 5-HT content representing the highest and lowest values among the strains (284.83 and 88.99 pg/mg wet tissue, respectively). When strains were compared using Tukey’s HSD Multiple Comparison test no significant differences between the progenitor strains in OB HVA content could be identified (p > 0.05): B6 and BALB/cJ fell in the same homogeneous subset of strains (Tables 9-11).
Table 10. Tests of Between-Subjects Effects
Source |
Dependent Variable |
Type III Sum of Squares |
df |
Mean Square |
F |
Sig. |
STRAIN |
5-HT |
301204.297 |
9 |
33467.144 |
5.901 |
0.000 |
NA |
809247.632 |
9 |
89916.404 |
0.673 |
0.731 |
DOPAC |
8967.084 |
9 |
996.343 |
1.131 |
0.351 |
HVA |
99524.976 |
9 |
11058.331 |
3.562 |
0.001 |
Table 11. Multiple Comparisons RQI and progenitor strain OB 5-HT content (pg/mg)
Tukey HSD |
Dependent Variable |
(I) strain |
(J) strain |
Mean Difference (I-J) |
Std. Error |
Sig. |
95% Confidence Interval |
Lower Bound |
Upper Bound |
5-HT |
B6 |
BALB/cJ |
195.8375* |
35.72288 |
0.000 |
79.7656 |
311.9094 |
C4A12 |
109.5688 |
37.65522 |
0.119 |
-12.7817 |
231.9192 |
C4A4 |
105.2483 |
34.37435 |
0.082 |
-6.4419 |
216.9385 |
C4A6B |
29.3915 |
35.72288 |
0.998 |
-86.6804 |
145.4634 |
C4A6N |
57.5335 |
35.72288 |
0.839 |
-58.5384 |
173.6054 |
C4B13 |
180.7138* |
37.65522 |
0.000 |
58.3633 |
303.0642 |
C4B13C |
70.2655 |
35.72288 |
0.624 |
-45.8064 |
186.3374 |
C5A3 |
81.5534 |
34.99376 |
0.381 |
-32.1494 |
195.2562 |
I5B25A |
104.5313 |
37.65522 |
0.162 |
-17.8192 |
226.8817 |
Based on observed means.
The error term is Mean Square (Error) = 3104.647. |
*. The mean difference is significant at the 0.05 level. |
|
Previously, using the intermittent exposure method we reported the highest nicotine-induced within-subject locomotor sensitization (WSS) for BALB/cJ (863% increase, p = 0.009) and in the present study the lowest OB 5-HT content in BALB/cJ. The negative association pattern of OB 5-HT and sensitization raised the question of genetic correlation, therefore we used strain mean values of the published nicotine-induced within-subject locomotor sensitization data [9] and strain means of the current OB 5-HT data presented here, for between-strain correlation analysis (Tables 12-13). Because normal distribution could not be assumed and negative correlation was expected, nonparametric correlation test (1-tailed Sperman’s rho) was applied, which detected significant negative correlation (rho = -0.578, p < 0.05; Figure 2).
Table 12. OB 5-HT content and nicotine-induced within-subject locomotor sensitization in RQI and progenitor mouse strains
STRAIN |
5-HT* |
NIC-WSS** |
|
|
|
|
|
|
|
B6 |
285 |
384 |
|
|
|
|
|
|
|
BALB/cJ |
89 |
2016 |
|
|
|
|
|
|
|
C4A12 |
175 |
423 |
|
|
|
|
|
|
|
C4A4 |
180 |
821 |
|
|
|
|
|
|
|
C4A6B |
255 |
340 |
|
|
|
|
|
|
|
C4A6N |
227 |
823 |
|
|
|
|
|
|
|
C4B13 |
104 |
490 |
|
|
|
|
|
|
|
C4B13C |
215 |
406 |
|
|
|
|
|
|
|
C5A3 |
203 |
246 |
|
|
|
|
|
|
|
I5B25A |
180 |
873 |
|
|
|
|
|
|
|
*pg/mg wet weight OLB, strain means |
|
|
|
|
|
|
|
**NIC-WSS reflects within-subject sensitization, Total ambulatory counts Day 41 - Total ambulatory counts Day 1 in the NICOTINE group, strain means [data from (Vadasz, Saito, O'Brien, et al., 2007)]
Table 13. Between-strain correlation of OB 5-HT and nicotine-induced sensitization
|
5-HT |
NIC-WSS |
Spearman's rho |
5-HT |
Correlation Coefficient |
1.000 |
-.578* |
Sig. (1-tailed) |
. |
0.040 |
N |
10 |
10 |
NIC-WSS |
Correlation Coefficient |
-0.578* |
1.000 |
Sig. (1-tailed) |
0.040 |
. |
N |
10 |
10 |
*Correlation is significant at the 0.05 level (1-tailed). NIC-WSS reflects within-subject sensitization, Total ambulatory counts Day 41 - Total ambulatory counts Day1 in the NICOTINE group, strain means [NIC-WSS data from (Vadasz, Saito, O'Brien, et al., 2007)] |
|
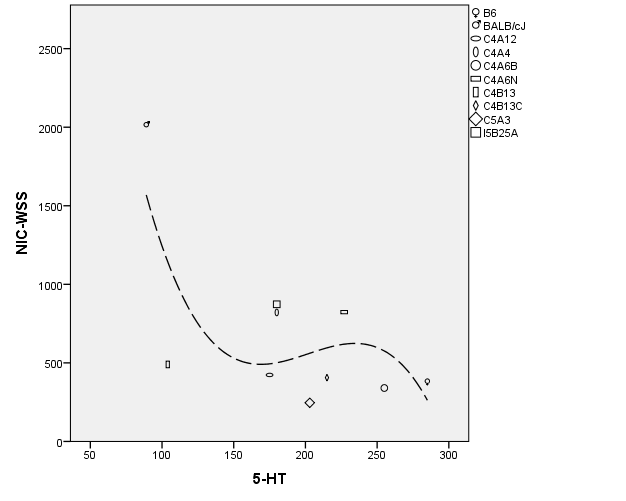
Figure 2: Regression variable plot. Symbols and longdash line represent strains and cubic fit line, respectively.
C4B13, one of the inbred quasi-congenic RQI strain, carries only about 3% introgressed BALB/c genome [18], and RQIgbase (http://RQIgenetics.org/) queries (with the option of “ignore blank values”) suggest that BALB/cJ derived chromosome segments can be found on six chromosomes [chr. 1 (D1Mit311, D1Mit286), chr.5 (D5Mit331), chr.7 (D7Mit100, D7Mit105), chr.15 (D15Mit107, D15Mit159, D15Mit242), chr.17 (D17Mit129) and chr.19 (D19Mit88)], providing targets for candidate QTL search. Genotype status for other chromosomes (including chr.10 which harbors tryptophan hydroxylase, Tph2, are presently not available, thus input from additional genomic regions is possible.
Discussion
Highlights
The main results suggest significant genetic control of olfactory bulb serotonin content (Table 9, Table 11). Co-analysis of olfactory bulb serotonin content with our previously reported nicotine-induced behavioral sensitization [18] show significant between-strain correlation raising the possibility of common genetic control (Tables 12-13, Figure 2). The source of between-strain correlation can be considered largely genetic and not environmental (maintenance, handling, treatment, etc.) because the strains were subjected to the same environmental factors while genetic differences between the strains have been established (see databases https://www.informatics.jax.org/home/strain, http://rqigenetics.org/: RQIgbase, Strain Search). Based on DNA marker genotype distribution polygenic genetic control seems likely, and effects of Tph2 or other genes cannot be excluded (see 4.3.). Nicotine treatment did not result in statistically detectable hippocampal changes, however, different treatment paradigms and greater power may yield significant effects.
DA, 5-HT and theories of addiction
The neurobiological, molecular mechanisms of phases of nicotine addiction are not well known. In general, the allostasis theory of addiction suggests a shift from positive reinforcement to negative reinforcement, with a corresponding reduction in the stimulating and pleasurable effects. This process involves a progressive dysregulation of neurobiological systems governing reward and stress, which can persist over long periods of time and render individuals vulnerable to subsequent relapse [21]. The incentive sensitization theory, proposed by Robinson and Berridge, emphasizes a distinction between desire (‘wanting’) and reward (‘liking’), involves a progressive increase in desire for a substance and sensitivity to substance related cues, with hedonic or rewarding properties either remaining the same or decreasing [22,23].
Dopamine (DA) and serotonin (5-HT) have been previously identified as co-occurring key neurotransmitters for of Substance Use Disorders (SUD). Nagai, et al. suggest that 5-HT neurons from the DRN, perhaps by the interaction they establish with dopaminergic neurons of the ventral tegmental area, are a key component in the balance between reward and aversion [24]. Recent genetic studies provided further support demonstrating a pleiotropic contribution of genes in dopaminergic and serotonergic pathways to addiction and related behavioral traits [25].
Substances of abuse share a largely common neural substrate and basic mechanism. Addictive drugs activate a component of the mesotelencephalic (MES) DA system of the brain: DA neurons whose cell bodies are in the Ventral Tegmental Area (VTA) of the MES. DA neurons project to Nucleus Accumbens (NAc) where all addictive drugs produce increase in DA concentration. The initial phase of interaction varies: Nicotine directly activates the DA neuron by activating nicotinic acetylcholine receptors, cocaine increases DA level by blocking DA re-uptake sites. Morphine and cannabis bind to receptors on inhibitory VTA GABA neurons which target VTA DA neurons and eventually diminish the release of the inhibitory GABA neurotransmitter [26].
Genetic association between the serotonergic system and addiction
The serotonergic system has been investigated in numerous addiction related genetic studies with special emphasis on the use of ethyl alcohol, which interacts with the serotonergic system. For example, studies on laboratory rodents namely in the HAD/LAD rats [27], the 5-HT deficient Fawn-Hooded rats which display a preference towards ethanol intake [28], the alcohol-preferring P and alcohol non-preferring NP rats [29,30] and the Sardinian alcohol-preferring (sP) and Sardinian alcohol-non-preferring (sNP) rats [31]. Studies on mice are somewhat contradicting. Daszuta and Portalier found a higher number of 5-HT neurons in the most caudal (B6) part of nucleus raphe dorsalis of BALB/c compared to the C57BL strain [32]. Highlighting the complexity of serotonerg control, Siesser, et al. concluded that tryptophan hydroxylase 2 gene (Tph2, mouse Chromosome 10, 63.51 cM) genotype determines brain serotonin synthesis but not tissue content in C57BL/6 and BALB/c congenic mice [33].
Primates readily consume alcohol solution for its reinforcing effects. Cloninger proposed a psychobiological model of alcoholism (Type II) in its original formulation as male-limited, and characterized by impaired impulse control resulting in unrestrained alcohol consumption [34]. Cloninger attributed impulse-mediated alcoholism (Type II) primarily to CNS serotonin deficit. Linnoila’s investigations showed that men with low CSF 5-HIAA concentrations frequently exhibit behavioral problems that may be indicative of impaired impulse control and excessive alcohol consumption [35].
Considering the evolutionary underpinnings of excessive alcohol consumption and integrating behavioral and neuroendocrine data from captive and semi-free-ranging rhesus macaques, Gerald and Higley hypothesized that benefits derived from impulsive and aggressive behaviors in some contexts might contribute indirectly to the maintenance of traits involved in excessive alcohol intake [36]. Studies on humans and rhesus macaques showed relationships between excessive alcohol consumption and serotonergic function, as measured by concentrations of 5-HIAA in the Cerebrospinal Fluid (CSF). Rhesus monkeys with low CSF 5-HIAA concentrations exhibited deficits in impulse control and consumed large amounts of alcohol similarly to individuals characterized by Type II-like deficits [37].
Serotonin neurotransmission and nicotine exposure
Some studies suggest that the development of behavioral sensitization also involves serotonergic mechanisms. It has been reported that behavioral sensitization to nicotine is associated with behavioral disinhibition and that chronic citalopram treatment counteracted the expression of both phenomena. Because citalopram is a selective serotonin reuptake inhibitor, it was hypothesized that the effects of citalopram may be due to a facilitation of serotonin neurotransmission caused by the chronic citalopram treatment [38].
The raphe nuclei provide serotonergic innervation widely in the brain mediating a variety of neuromodulatory effects. In all Olfactory Bulb (OB) samples we detected consistently substantial 5-HT content which supports reports showing that the mammalian OB is a prominent recipient of serotonergic fibers [39].
If increased availability of serotonin counteracts behavioral sensitization [38], lower regional serotonin concentration may facilitate sensitization, which is consistent with our results: Association of lower OB serotonin content with higher nicotin-induced behavioral sensitization can be a consequence of genetically controlled modification of brain serotonergic systems, presumably involving the Dorsal Raphe Nucleus (DRN) and the Median Raphe Nucleus (MRN), which are known to densely innervate the OB, especially the Glomerular Layer (GL). It has been suggested that the source of GL innervation is the MRN [40].
The exact nature of the genetic control is not known. “Direct” genetic control may stem from variations in the cellular, neurochemical components of the 5-HT system. For example, Muller and Homberg identified various mechanisms in the 5-HT system, which are specific for single drugs. Based on overlap of substance effects they proposed a time course for neuroplastic changes in the 5-HT system, which coincide with the establishment and maintenance of drug use-associated behaviors arguing that these adaptations render the nervous system susceptible to a loss of control over the established behaviors, specifically a reduction of impulse control by 5-HT, due to higher levels of SERT in terminal regions [41]. Also, the genetic control can be “indirect”, targeting external neural circuitries with projection to the DRN and MRN [42].
Acute and chronic effects of nicotine on DRN serotonergic systems
Acute nicotine administration, via presynaptic alpha4beta2 nicotinic acetylcholine receptors, increases glutamate release and serotonin neuron excitability in the dorsal raphe nucleus [43]. Neuronal activation in the rostral and lateral wings of the DRN can change topographically: Nicotine can decrease activation in the ventral DRN [44]. However, chronic nicotine administration results in an almost opposite pattern [44]. A review of the role of serotonin in drug use and addiction suggests that the reports on effects of nicotine-induced extracellular levels of serotonin are not always consistent [41].
Association of phenotypes with nicotine-induced locomotor sensitization
Brain serotonin has been implicated in neuroadaptive changes caused by repeated exposure to addictive substances which may underlie advanced phases of substance use disorders. Investigation of repeated nicotine treatment on locomotor activity and the influence of citalopram, a highly selective serotonin reuptake inhibitor, on the behavioral effects in male rats showed that acutely, nicotine stimulated locomotor activity, and repeated daily nicotine injections sensitized vehicle + nicotine rats to the nicotine-induced locomotor stimulation, whereas in citalopram + nicotine rats the enhancement of nicotine-induced locomotion was suppressed. However, when challenged with nicotine after citalopram withdrawal, the citalopram + nicotine treated animals were also sensitized. Moreover, the degree of nicotine sensitization correlated to the behavioral disinhibition observed in the elevated plus-maze. Behavioral sensitization to nicotine was associated with behavioral disinhibition and chronic citalopram treatment counteracted the expression of both phenomena, thus the effects of citalopram maybe due to aiding of serotonin neurotransmission caused by the chronic citalopram treatment [38].
Further studies investigated the effects of decrease in serotonin neurotransmission caused by brain 5-HT depletion [intra-cranial infusion of 5,7-Dihydroxytryptamine (5,7-DHT) by 5,7-DHT to the lateral ventricles). Effects of repeated daily nicotine treatment (15 days) on the behavioral and neurochemical effects showed that depletion of brain 5-HT produced behavioral disinhibition in the elevated plus-maze, and in 5-HT-depleted animals nicotine-induced locomotor sensitization was observed on treatment days 5, 10, and 15. Global 5-HT depletion was shown to promote the sensitization of the locomotor response to nicotine [45].
[41] also suggested involvement of 5-HT in nicotine use-associated behaviours, and pointed out that no mechanism could be proposed at that stage [41]. While different behavioral assays and activation methods may contribute to conflicting results, they may also stem from treating the DR serotonin system as a monolithic whole [46].
Dorsal raphe serotonergic neuronal pathways
It is well established that two highly complementary parallel serotonergic neuronal pathways projecting from the dorsal raphe to cortical and subcortical regions of the brain are each activated by reward but show opposite responses to aversive stimuli. Recent studies demonstrated that serotonin neurons projecting to subcortical regions localized more in the dorsal DR, whereas those that project to the OB and three cortical areas preferentially localized in the ventral DR. Orbitofrontal Cortex (OFC)-projecting DR serotonin neurons had more overlap with OB-projecting ones than with central amygdala (CeA)-projecting ones. The OFC and OB were intensively innervated by DRSert/OFC axons but lacked DRSert/CeA axons further indicating that the collateralization of individual DR serotonin neurons can be extremely broad. It could be emphasized that each sub-system characterized may still be heterogeneous in their composition [46] [but see also [40].
Conclusion
Our results demonstrated highly significant genetic control of OB serotonin content, which may be a consequence of differential organization and function of sub-systems within the DRN and MRN. While it is possible that OB serotonin content is genetically associated with nicotine-induced behavioral sensitization, in view of the complexity of the raphe serotonergic systems, further systematic functional analyses are needed including the utilization of the methods of single cell RNA seq and high-resolution tracing of the axonal arborizations of individual serotonin neurons to provide a better understanding of how the genetically controlled OB serotonin content affects the diverse psycho-physiological functions modulated by DRN and MRN.
Contributors
Csaba Vadasz and Beatrix Gyetvai conceived the project, designed and carried out the experiments. Beatrix Gyetvai bred and maintaned the experimental animals, participated in sample acquisition. Csaba Vadasz and Beatrix Gyetvai analyzed the data, interpreted the results and wrote the manuscript. Nibedita Royyuru and Goutam Cakraborty participated in sample acquisition and performed sample processing, HPLC analysis, data collection.
Declaration of competing interest
No conflict declared.
Acknowledgements
Development of animal models was supported by The National Institute of Neurological Disorders and Stroke NS19788, The National Institute on Alcohol Abuse and Alcoholism R01 AA11031, and United States Department of Defense (U.S. Army Medical Research and Materiel Command DAMD 17-00-1-0578), nicotine-induced sinsitization studies were supported by Philip Morris USA Inc. and Philip Morris International. We are not aware of any funding, affiliations, memberships, or other factors that might be perceived as affecting the objectivity of this work. We are grateful for the excellent contributions of Drs. Nibedita Royyuru and Goutam Chakraborty (deceased) who participated in sample acquisition and performed sample processing, HPLC analysis, data collection.
References
- Benwell ME, Balfour DJ (1992) The effects of acute and repeated nicotine treatment on nucleus accumbens dopamine and locomotor activity. Br J Pharmacol 105: 849-856. [Crossref]
- Celik E, Uzbay IT, Karakas S (2005) Caffeine and amphetamine produce cross-sensitization to nicotine-induced locomotor activity in mice. Prog Neuropsychopharmacol Biol Psychiatry 30: 50-55. [Crossref]
- Clarke PB, Fu DS, Jakubovic A, Fibiger HC (1988) Evidence that mesolimbic dopaminergic activation underlies the locomotor stimulant action of nicotine in rats. J Pharmacol Exp Ther 246: 701-708. [Crossref]
- Le Foll B, Diaz J, Sokoloff P (2003) Increased dopamine D3 receptor expression accompanying behavioral sensitization to nicotine in rats. Synapse 47: 176-183. [Crossref]
- Saito M, O'Brien D, Kovacs KM, Wang R, Zavadil J, Vadasz C (2005) Nicotine-induced sensitization in mice: changes in locomotor activity and mesencephalic gene expression. Neurochem Res 30: 1027-1035. [Crossref]
- Shim I, Javaid JI, Wirtshafter D, Jang SY, Shin KH, et al. (2001) Nicotine-induced behavioral sensitization is associated with extracellular dopamine release and expression of c-Fos in the striatum and nucleus accumbens of the rat. Behav Brain Res 121: 137-147. [Crossref]
- Mexal S, Frank M, Berger R, Adams CE, Ross RG, et al. (2005) Differential modulation of gene expression in the NMDA postsynaptic density of schizophrenic and control smokers. Brain Res Mol Brain Res 139: 317-332. [Crossref]
- Belluardo N, Olsson PA, Mudo G, Sommer WH, Amato G, et al. (2005) Transcription factor gene expression profiling after acute intermittent nicotine treatment in the rat cerebral cortex. Neuroscience 133: 787-796. [Crossref]
- Vadasz C, Saito M, O'Brien D, Zavadil J, Morahan G, et al. (2007) Ventral tegmental transcriptome response to intermittent nicotine treatment and withdrawal in BALB/cJ, C57BL/6ByJ, and quasi-congenic RQI mice. Neurochem Res 32: 457-480. [Crossref]
- Appan D, Hsu SM, Hsu WH, Chou SJ (2023) Patterning the cerebral cortex into distinct functional domains during development. Curr Opin Neurobiol 80: 102698. [Crossref]
- Crumbie L (2023) Limbic system. Limbic system. [Crossref]
- 12.Vadasz C (1990) Development of congenic recombinant inbred neurological animal model lines. Mouse Genome 88: 16-18.
- Vadasz C, Sziraki I, Balla A, Lafrancois J, Mao R (1997) Recombinant QTL Introgression animal models serve as a novel tool for mapping dopamine-system genes. American Journal of Medical Genetics 74: 584-585.
- Vadasz C, Sziraki I, Murthy LR, Sasvari-Szekely M, Kabai P, et al. (1994) Transfer of brain dopamine system-specific quantitative trait loci onto a C57BL/6ByJ background. Mamm Genome 5: 735-737. [Crossref]
- Vadasz C, Sziraki I, Sasvari M, Kabai P, Laszlovszky I, et al. (1996) Genomic characterization of two introgression strains (B6.Cb4i5) for the analysis of QTLs. Mamm Genome 7: 545-548. [Crossref]
- Vadasz C, Sziraki I, Sasvari M, Kabai P, Murthy LR, et al. (1998) Analysis of the mesotelencephalic dopamine system by quantitative-trait locus introgression. Neurochem Res 23: 1337-1354. [Crossref]
17.Abiola O, Angel JM, Avner P, Bachmanov AA, Belknap JK, et al. (2003) The nature and identification of quantitative trait loci: a community's view. Nat Rev Genet 4: 911-916. [Crossref]
- Vadasz C, Saito M, Gyetvai BM, Oros M, Szakall I, et al. (2007) Mapping of QTLs for oral alcohol self-administration in B6.C and B6.I quasi-congenic RQI strains. Neurochem Res 32: 1099-1112. [Crossref]
- Franklin KBJ, Paxinos G (1997) The Mouse Brain in Stereotactic Coordinates. Academic Press.
- Jaszczyk A, Stankiewicz AM, Juszczak GR (2022) Dissection of Mouse Hippocampus with Its Dorsal, Intermediate and Ventral Subdivisions Combined with Molecular Validation. Brain Sci 12. [Crossref]
- 21.Koob GF, Le Moal M (2001) Drug addiction, dysregulation of reward, and allostasis. Neuropsychopharmacology 24: 97-129. [Crossref]
- Robinson TE, Berridge KC (1993) The neural basis of drug craving: an incentive-sensitization theory of addiction. Brain Res Brain Res Rev 18: 247-291. [Crossref]
- Robinson TE, Berridge KC (2008) Review. The incentive sensitization theory of addiction: some current issues. Philos Trans R Soc Lond B Biol Sci 363: 3137-3146. [Crossref]
- Nagai Y, Takayama K, Nishitani N, Andoh C, Koda M, et al. (2020) The Role of Dorsal Raphe Serotonin Neurons in the Balance between Reward and Aversion. Int J Mol Sci 21.[Crossref]
- Anton-Galindo E, Cabana-Dominguez J, Torrico B, Corominas R, Cormand B, et al. (2023) The pleiotropic contribution of genes in dopaminergic and serotonergic pathways to addiction and related behavioral traits. Front Psychiatry 14: 1293663.
- Luscher C (2016) The Emergence of a Circuit Model for Addiction. Annu Rev Neurosci 39: 257-276. [Crossref]
- Gongwer MA, Murphy JM, McBride WJ, Lumeng L, Li TK (1989) Regional brain contents of serotonin, dopamine and their metabolites in the selectively bred high- and low-alcohol drinking lines of rats. Alcohol 6: 317-320. [Crossref]
- Rezvani AH, Overstreet DH, Janowsky DS (1990) Genetic serotonin deficiency and alcohol preference in the fawn hooded rats. Alcohol Alcohol 25: 573-575. [Crossref]
- Zhou FC, Bledsoe S, Lumeng L, Li TK (1994) Reduced serotonergic immunoreactive fibers in the forebrain of alcohol-preferring rats. Alcohol Clin Exp Res 18: 571-579. [Crossref]
- Zhou FC, Pu CF, Murphy J, Lumeng L, Li TK (1994) Serotonergic neurons in the alcohol preferring rats. Alcohol 11: 397-403.[Crossref]
- Devoto P, Colombo G, Stefanini E, Gessa GL (1998) Serotonin is reduced in the frontal cortex of Sardinian ethanol-preferring rats. Alcohol Alcohol 33: 226-229.
- Daszuta A, Portalier P (1985) Distribution and quantification of 5-HT nerve cell bodies in the nucleus raphe dorsalis area of C57BL and BALBc mice. Relationship between anatomy and biochemistry. Brain Res 360: 58-64.
- Siesser WB, Zhang X, Jacobsen JP, Sotnikova TD, Gainetdinov RR, et al. (2010)Tryptophan hydroxylase 2 genotype determines brain serotonin synthesis but not tissue content in C57Bl/6 and BALB/c congenic mice. Neurosci Lett 481: 6-11.
- Cloninger CR (1987) Neurogenetic adaptive mechanisms in alcoholism. Science 236: 410-416. [Crossref]
- 35.Linnoila M, Virkkunen M, George T, Eckardt M, Higley JD, et al. (1994) Serotonin, violent behavior and alcohol. Exs 71: 155-163. [Crossref]
- Gerald MS, Higley JD (2002) Evolutionary underpinnings of excessive alcohol consumption. Addiction 97: 415-425. [Crossref]
- Higley JD, Bennett AJ (1999) Central nervous system serotonin and personality as variables contributing to excessive alcohol consumption in non-human primates. Alcohol Alcohol 34: 402-418. [Crossref]
- Olausson P, Engel JA, Soderpalm B (1999) Behavioral sensitization to nicotine is associated with behavioral disinhibition; counteraction by citalopram. Psychopharmacology (Berl) 142: 111-119. [Crossref]
- Petzold GC, Hagiwara A, Murthy VN (2009) Serotonergic modulation of odor input to the mammalian olfactory bulb. Nat Neurosci 12: 784-791. [Crossref]
- Steinfeld R, Herb JT, Sprengel R, Schaefer AT, Fukunaga I (2015) Divergent innervation of the olfactory bulb by distinct raphe nuclei. J Comp Neurol 523: 805-813. [Crossref]
- Muller CP, Homberg JR (2015) The role of serotonin in drug use and addiction. Behav Brain Res 277: 146-192. [Crossref]
- Souza R, Bueno D, Lima LB, Muchon MJ, Goncalves L, et al. (2022) Top-down projections of the prefrontal cortex to the ventral tegmental area, laterodorsal tegmental nucleus, and median raphe nucleus. Brain Struct Funct 227: 2465-2487. [Crossref]
- Garduno J, Galindo-Charles L, Jimenez-Rodriguez J, Galarraga E, Tapia D, et al. (2012) Presynaptic alpha4beta2 nicotinic acetylcholine receptors increase glutamate release and serotonin neuron excitability in the dorsal raphe nucleus. J Neurosci 32: 15148-15157. [Crossref]
- Sperling R, Commons KG (2011) Shifting topographic activation and 5-HT1A receptor-mediated inhibition of dorsal raphe serotonin neurons produced by nicotine exposure and withdrawal. Eur J Neurosci 33: 1866-1875. [Crossref]
- Olausson P, Akesson P, Petersson A, Engel JA, Soderpalm B (2001) Behavioral and neurochemical consequences of repeated nicotine treatment in the serotonin-depleted rat. Psychopharmacology (Berl) 155: 348-361. [Crossref]
- Ren J, Friedmann D, Xiong J, Liu CD, Ferguson BR, et al. (2018) Anatomically Defined and Functionally Distinct Dorsal Raphe Serotonin Sub-systems. Cell 175: 472-487 e420. [Crossref]