Women with breast cancer receiving aromatase inhibitors often cannot resume normal life because their quality of life is affected severely from side effects.
At the moment these physical side effects of aromatase inhibitors cannot be avoided effectively so that a stress reduction by undergoing a mindfulness-based stress (MBSR) reduction training seems to be a chance to enhance the quality of life for affected women.
In this context our randomized control trial examines the hypothesis, whether an MBSR training of 8 weeks improves quality of life for women of the MBSR group (MBSR group n=10). By contrast women of the control group (n=15) take part in Nordic walking once per week.
Surprisingly, results reveal that women of the MBSR group noticed an increase of breast pain located in their breast affected by cancer and also an increase of insomnia. The cortisol level in the afternoon had fallen slightly at the end of 8 weeks in participants of the control group and had risen in participants of the MBSR group.
However, as a long-term effect the cognitive functioning in the MBSR group was improved after 16 weeks.
Participants of the MBSR group (intervention group, limited to N=10) and control group with Nordic walking training were randomized. All women had breast cancer, were aged 50-79, had hormon-rezeptive tumors, and a tumor stage UICC I-III [1].
The period of training was 8 weeks for both groups. Three measurements were taken in each group:
- t1: before the beginning of 8 weeks training
- t2: 8 weeks after the beginning of training (at the end of training)
- t3: 16 weeks after the beginning of training (8 weeks after training)
Primary endpoint (measuring time points t1 and t2) were the physiological parameters of serum cortisol and serum prolactin. Secondary endpoint was the quality of life at the measuring time points t2 and t3 according to the inventary of EORTC-questionnaire (Figure 1)
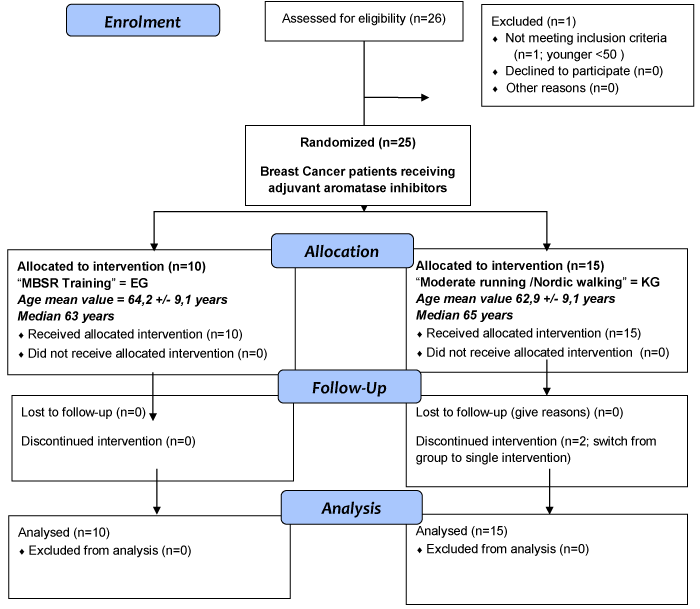
Figure 1. Consort Flow Chart
- EORTC QLQ-C30 Version 3.0 and
- EORTC QLQ-BR23
Considering the small sample, we focused the effect size to get valuable information to clinical effects despite not having significance.
We did an analysis of covariance (ANCOVA) with timepoint t1 (= beginning of the intervention) as covariate.
The effect size ƞ2 was calculated related to the effect of the factor “group”. For interpretation of the effect size we used Table 1 [1].
Table 1. Interpretation of effect size
|
small |
moderate |
large |
r |
< 0.3 |
0.3 – 0.5 |
> 0.5 |
d |
< 0.5 |
0.5 – 0.8 |
< 0-8 |
ƞ² |
0.06 |
0.06 – 0.14 |
> 0.14 |
Results of the physiological parameters
Analysis of covariance: Timepoints t1 and t2: Participants of the MBSR group had a small increase of postprandial cortisol at 2 p.m., whereas participants of the Nordic walking group had a small decrease of postprandial cortisol at 2 p.m. (ƞ2=0,162, Table 2).
Table 2. Physiological parameters.
Parameters
Mean values (and SD) |
t1
MBSR |
t2
MBSR |
t1
Nordic
walking |
t2
Nordic
walking |
ANCOVA (t1 = covariate) |
effect size* |
Cortisol
at 2 pm
(SD) |
304,2
(109,309)
|
318
(102,177) |
279,867
(151,394) |
228,533
(100,904) |
F=4,252 df=1 p = 0,051 (group) |
ƞ²=0,162 |
Prolaktin
at 2 pm
(SD) |
8,659
(1,773) |
9,386
(2,1) |
8,549
(2,643) |
9,996
(4,078) |
F=0,262 df=1 p = 0,614 (group) |
ƞ²=0,012 |
*effect size related to the effect of the factor “group“
[cortisol standard value in serum: 138 – 690 nmol/l; prolactin standard value in serum: 4,79 – 23.3 µg/l]
Results of the EORTC-Questionnaires
Analysis of covariance timepoints t1 (beginning of intervention) and t2 = 8 weeks (end of intervention/training). Participants of the MBSR group reported an increase of breast pain, Table 3 (p = 0,042; ƞ2=0,175) and an increase of isomnia (ƞ2=0,113, Table 3), which disappeared 8 weeks after the end of MBSR training.
Table 3. Analysis of covariance: timepoints t1 and t2=8 weeks.
Parameters
Mean values (and SD) |
t1
MBSR |
t2
MBSR |
t1
Nordic walking |
t2
Nordic walking |
ANCOVA (t1 = covariate) |
effect size* |
Quality of Life (SD) |
53,33
(16,29) |
61,67
(18,92) |
65,00
(21,41) |
64,44
(21,47) |
F=1,100 df=1 (group) |
p = 0,306 |
Ƞ2=0,048 |
Physical
Functioning (SD) |
71,33
(12,98) |
74,00
(13,86) |
80,44
(21,30) |
81,33
(18,89) |
F=0,004 df=1 (group) |
p = 0,951 |
Ƞ2=0,001 |
Role
Functioning (SD) |
61,67
(17,66) |
61,67
(24,91) |
67,78
(34,20) |
71,11
(26.33) |
F=0,624 df=1 (group) |
p = 0,438 |
Ƞ2=0,028 |
Emotional
Functioning (SD) |
55,83
(26,95) |
61,67
(24,91) |
58,89
(31,88) |
70,56
(26,14) |
F=1,383 df=1 (group) |
p = 0,252 |
Ƞ2=0,059 |
Cognitive
Functioning
(SD) |
70,00
(30,23) |
71,67
(26,12) |
71,11
(31,16) |
70,00
(32,85) |
F=0,179 df=1 (group) |
p = 0,677 |
Ƞ2=0,008 |
Social
Functioning (SD) |
60,00
(43,18) |
71,67
(27,27) |
64,44
(36,11) |
70,00
(34,62) |
F=0,216 df=1 (group) |
p = 0,646 |
Ƞ2=0,010 |
Fatigue |
48,89
(29,26) |
46,67
(27,12) |
38,52
(28,75) |
36,30
(29,83) |
F=0,058 df=1 (group) |
p = 0,811 |
Ƞ2=0,003 |
Nausea and
Vomiting (SD) |
|
|
5,56
(17,44) |
3,33
(12,91) |
F=0,381 df=1 (group) |
p = 0,544 |
Ƞ2=0,017 |
Pain (SD) |
38,33
(24,91) |
45,00
(30,48) |
36,67
(32,24) |
38,89
(27,94) |
F=0,308 df=1 (group) |
p = 0,585 |
Ƞ2=0,014 |
Dyspnoea (SD) |
23,33
(22,50) |
20,00
(28,11) |
33,33
(37,80) |
28,89
(27,79) |
F=0,090 df=1 (group) |
p = 0,768 |
Ƞ2=0,004 |
Insomnia (SD) |
56,67
(38,65)
|
60,00
(37,84) |
57,78
(36,66) |
44,44
(39,17) |
F=2,792 df=1 (group) |
p = 0,109 |
Ƞ2=0,113 |
Appetite loss (SD) |
20,00
(35,83) |
16,67
(36,00) |
11,11
(24,12) |
6,67
(18,69) |
F=0,262 df=1 (group) |
p = 0,614 |
Ƞ2=0,012 |
Constipation (SD) |
13,33
(32,20) |
20,00
(35,83) |
22,22
(27,22) |
17,78
(24,77) |
F=1,113 df=1 (group) |
p = 0,303 |
Ƞ2=0,048 |
Diarrhoea (SD) |
3,33
(10,54) |
3,33
(10,54) |
6,67
(18,69) |
0,00
(0,00) |
F=2,391 df=1 (group) |
p = 0,136 |
Ƞ2=0,098 |
Financial
Diffuculties
(SD) |
30,00
(42,89) |
20,00
(32,20) |
26,67
(38,21) |
(24,44
(38,76) |
F=1,502 df=1 (group) |
p = 0,233 |
Ƞ2=0,064 |
Body Image (SD) |
52,50
(35,15) |
59,17
(35,67) |
62,78
(36,31) |
66,11
(37,86) |
F=0,078 df=1 (group) |
p = 0,782 |
Ƞ2=0,004 |
Sexual
Functioning (SD) |
77,08
(30,78) |
78,57
(31,50) |
72,22
(33,73) |
76,19
(25,08) |
F=0,285 df=1 (group) |
p = 0,600 |
Ƞ2=0,016 |
Sexual
Enjoyment (SD) |
66,67
(47,14) |
66,67
(47,14) |
50,00
(43,03) |
66,67
(27,22) |
not possible to evaluate
|
|
Future
Perspective (SD) |
50,00
(28,33) |
53,33
(32,20) |
46,67
(41,40) |
35,56
(36,66) |
F=2,427 df=1 (group) |
p = 0,134 |
Ƞ2=0,099 |
Systemic
Therapy
Side Effects (SD) |
34,76
(19,83) |
29,96
(22,07) |
27,94
(14,94) |
26,03
(17,90) |
F=1,043 df=1 (group) |
p = 0,318 |
Ƞ2=0,045 |
Breast
Symptoms
(SD) |
15,83
(19,02) |
25,00
(19,25) |
25,00
(21,13) |
22,22
(21,52) |
F=4,663 df=1 (group) |
p = 0,042 |
Ƞ2=0,175 |
Arm Symptoms
(SD) |
33,33
(29,63) |
35,56
(30,45) |
37,04
(27,11) |
31,48
(21,99) |
F=1,610 df=1 (group) |
p = 0,218 |
Ƞ2=0,068 |
Upset by Hair
loss (SD) |
67,67
|
22,22
(38,49) |
61,11
(38,97) |
41,67
(42,72) |
F=1,812 df=1 (group) |
p = 0,236 |
Ƞ2=0,266 |
*effect size related to the effect of the factor “group“
Analysis of covariance timepoints t1 (beginning of intervention) und t3 = 16 weeks (= 8 weeks after finishing intervention). Participants of the MBSR group had an increase of cognitive functioning (ƞ2=0,131, Table 4).
Table 4. Analysis of covariance: timepoints t1 and t3=16 weeks.
Parameters
Mean values (and SD) |
t1
MBSR |
t3
MBSR |
t1
Nordic
walking |
t3
Nordic
walking |
ANCOVA (t1 = covariate) |
effect size* |
Quality of Life (SD) |
53,3
(16,3) |
56,7
(26,6) |
65,0
(21,4) |
65,6
(20,9) |
F=0,010 df=1 |
p = 0,919 (group) |
Ƞ2=0,001 |
Physical
Functioning (SD) |
71,3
(13,0) |
77,3
(15,8) |
80,4
(21,3) |
80,9
(18,7) |
F=0,276 df=1 |
p = 0,610 (group) |
Ƞ2=0,012 |
Role
Functioning (SD) |
61,7
(17,7) |
60,0
(29,6) |
67,8
(34,2) |
73,3
(24,2) |
F=1,324 df=1 |
p = 0,262 (group) |
Ƞ2=0,057 |
Emotional
Functioning (SD) |
55,8
(26,9) |
54,2
(26,7) |
58,9
(31,9) |
63,9
(32,5) |
F=0,864 df=1 |
p = 0,363 (group) |
Ƞ2=0,038 |
Cognitive
Functioning (SD) |
70,0
(30,2) |
78,3
(23,6) |
71,1
(31,2) |
65,6
(34,2) |
F=3,322 df=1 |
p = 0,082 (group) |
Ƞ2=0,131 |
Social
Functioning (SD) |
60,0
(43,2) |
65,0
(32,8) |
64,4
(36,1) |
70,0
(36,3) |
F=0,043 df=1 |
p = 0,838 (group) |
Ƞ2=0,002 |
Fatigue (SD) |
48,9
(29,3) |
47,8
(28,2) |
38,5
(28,8) |
34,8
(27,8) |
F=0,552 df=1 |
p = 0,465 (group) |
Ƞ2=0,024 |
Nausea and
Vomiting (SD) |
,0
(,0) |
3,3
(10,5) |
5,6
(17,4) |
3,3
(9,3) |
F=0,073 df=1 |
p = 0,790 (group) |
Ƞ2=0,003 |
Pain (SD) |
38,3
(24,9) |
41,7
(28,6) |
36,7
(32,2) |
40,0
(31,4) |
F=0,003 df=1 |
p = 0,954 (group) |
Ƞ2=0,001 |
Dyspnoea (SD) |
23,3
(22,5) |
23,3
(27,4) |
33,3
(37,8) |
26,7
(33,8) |
F=0,206 df=1 |
p = 0,654 (group) |
Ƞ2=0,009 |
Insomnia (SD) |
56,7
(38,7) |
56,7
(41,7) |
57,8
(36,7) |
48,9
(39,6) |
F=0,861 df=1 |
p = 0,363 (group) |
Ƞ2=0,038 |
Appetite loss (SD) |
20,0
(35,8) |
23,3
(41,7) |
11,1
(24,1) |
4,4
(11,7) |
F=2,323 df=1 |
p = 0,142 (group) |
Ƞ2=0,096 |
Constipation (SD) |
13,3
(32,2) |
23,3
(31,6) |
22,2
(27,2) |
15,6
(21,3) |
F=1,733 df=1 |
p = 0,202 (group) |
Ƞ2=0,073 |
Diarrhoea (SD) |
3,3
(10,5) |
10 (22,5) |
6,7
(18,7) |
2,2
(8,6) |
F=1,939 df=1 |
p = 0,178 (group) |
Ƞ2=0,081 |
Financial
Diffuculties (SD) |
30,0
(42,9) |
30,0
(36,7) |
26,7
(38,2) |
28,6
(38,9) |
F=0,702 df=1 |
p = 0,412 (group) |
Ƞ2=0,032 |
Body Image (SD) |
52,5
(35,1) |
53,9
(32,3) |
62,8
(36,3) |
66,7
(36,2) |
F=0,301 df=1 |
p = 0,589 (group) |
Ƞ2=0,013 |
Sexual
Functioning (SD) |
77,1
(30,8) |
77,1
(19,8) |
72,2
(33,7) |
81,0
(24,3) |
F=1,341 df=1 |
p = 0,262 (group) |
Ƞ2=0,069 |
Sexual
Enjoyment (SD) |
66,7
(47,1) |
44,4
(19,2) |
50,0
(43,0) |
50,0
(43,0) |
F=2,400 df=1 |
p = 0,261 (group) |
(ƞ2=0,545 ) |
Future
Perspective (SD) |
50,0
(28,3) |
56,7
(31,6) |
46,7
(41,4) |
48,9
(39,6) |
F=0,373 df=1 |
p = 0,548 (group) |
Ƞ2=0,017 |
Systemic Therapy
Side Effects (SD) |
34,8
(19,8) |
33,3
(19,0) |
27,9
(14,9) |
27,0
(19,3) |
F=0,015 df=1 |
p = 0,904 (group) |
Ƞ2=0,001 |
Breast Symptoms (SD) |
15,8
(19,0) |
21,7
(22,3) |
25,0
(21,1) |
28,9
(24,6) |
F=0,005 df=1 |
p = 0,942 (group) |
Ƞ2=0,001 |
Arm Symptoms
(SD) |
33,3
(29,6) |
30,0
(29,7) |
37,0
(27,1) |
41,5
(25,7) |
F=1,494 df=1 |
p = 0,234 (group) |
Ƞ2=0,064 |
Upset by Hair loss (SD) |
66,7
(,0) |
33,3
(,0) |
61,1
(39,0) |
53,3
(47,7) |
F=1,143 df=1 p = 0,397 (group) |
(ƞ2=0,364) |
* effect size related to the effect of the factor „group“
The quality of life was not improved for participants of both groups as a short-time effect after 8 weeks of training, thus Nordic walking or MBSR training were both equally ineffective to improve quality of life.
The striking result for MBSR training was the increased sensitization for unpleasant body sensations in breasts. Accordingly, most participants of the MBSR group did not answer the EORTC-questionnaire as to questions concerning sexual enjoyment and only one participant could report to have still pleasant sexual experiences.
This result of a disturbed acceptance of parts of the body could be an effect of the attention and self-reflection which is induced by MBSR training. Women might have located unconsciously their fear of breast cancer in their body experience. Therefore, we propose individual psychotherapy to develop confidence in their own body sensations after cancer treatment.
Further studies are necessary because of the small sample in this study.
Mattes J (2017) Awareness Culture and Health: A Prospective, Randomized and Controlled Study of Spiritual Practice in Breast Cancer Patients. Marburg, Tectum Verlag, ISBN 978-3-8288-3907-6.