To evaluate the effect of dichloromethane fraction (DCM-F) of Rhizophora mucronata on noninsulin dependent diabetes mellitus (NIDDM) rats and find out the biological action using docking studies. Rats treated post orally DCM-F (100 mg/kg b.wt.) for forty-five days. Different biochemical profiles using blood sample, in addition, the levels of glycolytic enzymes in the liver tissues of animals estimated on completing the study, Then, high-performance liquid chromatography photodiode detector mass spectroscopy (HPLC-DAD-MS) used to identify the active compounds in DCM-F. Moreover, active molecules in DCM-F have docking with possible anti-diabetic targets. DCM-F treatment presented significant (p<0.01) decrease in blood glucose, glycosylated hemoglobin (HbA1C), increased the body weight, high-density lipoprotein (HDL), plasma insulin and action of hexokinase when compared with untreated rats. Further, DCM-F treatment showed reduce acting serum glutamic oxaloacetic transaminase (SGOT), serum glutamic pyruvic transaminase (SGPT), alkaline phosphatase (ACP) and ALP as well as the intensity of creatinine and urea. HPLC-MS identified ajmalicine, catharanthine, colchicine, hyoscyamine, reserpine, and vindoline present in DCM-F. Docking simulation confirmed that ajmalicine interacted with dipeptidyl peptidase-4 (DPP-4) and tyrosine-protein phosphatase non-receptor type 1(PTPN1) but catharanthine produced more affinity and binding energy with insulin receptor tyrosine kinase (IRTK). This study infers DCM-F of R. mucronata acts as a promising source of anti-diabetic drug development.
Key words
Ajmalicine, dichloromethane, DPP-4, mangrove, vindoline
Introduction
Diabetes mellitus is an endocrine metabolic disease caused by the resistance to insulin or inadequate secretion of insulin results in an increased level of blood glucose [1]. More than 7% of the peoples in the World diagnosed with NIDDM and assumed most leading reasons of death [2]. Failure of major human body tissues and organs such as blood vessels, eyes, heart, kidney and nerves is a prevalence of severe stage of diabetes mellitus. Enormous reports have described the features liable for NIDDM, and the unfavorable result of marketable drugs [3]. Nevertheless, the practice of Phytomedicine as antidiabetic agents still is rising in the Asian, African, American and European population.
Studies reported that R. mucronata Poir (Family: Rhizophoraceae) has antimicrobial, anticancer, antinociceptive, antiplasmodial, free radical scavenging effects, α-amylase with α-glucosidase inhibition [4-10]. Nemours chemical substances had identified in R. mucronata such as terpenoids, volatile derivatives, and phenolic constituents [11-13]. In addition, computational studies reported that alkaloids and their derivatives of R. mucronata act as an efficient inhibitor on DPP-4, alpha-ketoglutarate-dependent dioxygenase and cyclooxygenase II receptor activities [14-16]. Previously, we reported the dichloromethane fraction of R. mucronata explains potential antihyperglycemic and antihyperlipidemic activities in different diabetic animal models [17]. In the continuity of earlier studies the active DCM-F of the study plant as competent to control blood glucose, and it has evaluated on the non-insulin-dependent diabetes mellitus rat model. HPLC-DAD-MS used to identify the active molecules in DCM-F. Besides, active molecules in DCM-F have docking with possible to prove the biological interaction.
Materials and methods
Plant material
During the January 2010, leaves of R. mucronata have collected from the brackish water regions of Tamil Nadu. The voucher specimen (#AUCASMB 11/2010) authenticated and deposited. After, cleaning the leaves, shade dried and coarsely powdered.
Extraction and preparation of fractions
About 1500 g of powder stuff extracted with light ligroin (3L) at 27ºC for 24 h to remove wax and fatty substances. Followed by removing the solvent, the filtrate extracted with 1000 ml of ethanol (80%) up to 5 times at 27ºC. Greenish-dark brown mass of ethanolic extract gained after removing the solvent. Then, hydrochloric acid (1N; 500 ml) used to acidify the residue after that neutralize with sodium hydroxide (NaOH). Further, separated DCM-F used for experimental studies.
Experimental animals
Male Wistar albino rats (200-250 g) brought from Central Animal House, Annamalai University. Rats fed on standard pellet diet and water and kept under hygienic conditions (27 ± 2ºC and humidity 50%; 12 h light and dark cycle). The study protocols have approved by Institute Animal Ethical Committee, Rajah Sir Muthiah Medical College and Hospital, Annamalai University (Prop. No.:928) India.
Induction of diabetes mellitus
A single-dose intraperitoneal injection (I.P.) of streptozotocin (60 mg/kg b.wt.) induced diabetes mellitus in overnight fasted rats followed by injecting nicotinamide (I.P., 120 mg/kg b.wt.) 15 min later. During STZ injection, 5% glucose orally has given to the rats to avoid the hypoglycemia. NIDDM confirms in rats through oral glucose tolerance test (OGTT) and fasting insulin resistance index (FIRI) [18].
Effect of DCM-F on diabetic rats in prolonged treatment
Forty rats separated into five different groups (24 diabetic and 16 nondiabetic rats). For 45 days Glyburide (600 μg/kg) or DCM-F gave orally using the intragastric tube.
Group 1: Normal control rats (0.5% CMC, one ml/kg)
Group 2: Normal rats + DCM-F (100 mg/kg)
Group 3: Negative control (Diabetic rats; Water)
Group 4: Diabetic rats + DCM-F (100 mg/kg)
Group 5: Positive control (Diabetic rats + Glyburide; 600 μg/kg)
On the first and final day of the experiment body weight of each experimental rats noted. In the morning at 7:30 am FBS of experimental animals estimated by the glucose oxidase-peroxidise method on 1st, 8th, 15th, 30th, and 45th days (Trinder 1969). According to protocols of Asritha Diatech's (Hyderabad, India) serum HDL-C, total cholesterol (TC) and triglycerides (TG) also estimated in rats using diagnostic kits.
Last day of the experiment, the animals sacrificed by cervical decapitation following anesthetized with ketamine injection (24 mg/kg/b.wt.; I.M.). Blood samples collected with and without anticoagulant tubes for serum and plasma separation. Cells in anticoagulant-treated tubes remove by centrifugation for 10 min at 2000 g to separate the plasma. The plasma insulin estimated by using ELISA kit (Linco Research, USA) [19]. Blood samples without anticoagulant allowed clotting at 27ºC for 20 min. Then, the serum separated by centrifugation at 2,000 g for 10 min to remove the clot. Glycosylated hemoglobin (HbA1c) and hemoglobin determined in the serum samples [20,21]. After that, SGPT, SGOT, and ACP determined to measure the hepatocytes injury [22,23]. To assess biliary and kidney action ALP, bilirubin, urea, and creatinine have measured by the standard methods [24,25]. One gram of clean liver tissue cut into pieces and homogenized for 2 min in 15 ml of ice-cold sucrose (250 mM), centrifuged at 10000 × g for 30 min. In the supernatant of liver homogenate used to estimate the protein concentration, FBPase, G6Pase and HK and levels as explained by standard methods [26-29].
Identification of active metabolites using HPLC-DAD-MS
DCM-F has subjected to do HPLC-DAD-MS (Agilent, Waldbronn, Germany) analysis. It performs to identify individual metabolites in the test sample. The sample dilutes fourfold and filtered through a 0.45 µm Millipore filter before automatic injection. HPLC analysis carried out in Sep-Pak C18 column (250 mm × 4.6 mm I.D., 5 µm) at room temperature. Methanol: acetonitrile: water used as the mobile phase in a gradient mode at volume ratios of 15:38:47 for 0 - 22 min, and 45:38:17 for 22 - 65 min. The flow rate of the mobile phase was 1 ml/min. The effluents recorded at 254 nm with a photodiode array detector. The mass quantified using Wiley National Institute of Standards and Technology (NIST) 2008 library.
In silico docking studies
Preparation of receptors
Target proteins used in this study such as the DPP-4 (PDB ID: 2RIP), IRTK (PDB ID: 1IR3), and PTPN1 (PDB ID: 2F70) get from Protein Data Bank (PDB). LigPlot tool employed to clear mutation in their peptide sequences of target proteins.
Preparation of ligands
Ligands used in this study obtain from the PubChem database. After optimization, ligands have used for docking studies.
Molecular docking
Auto-Dock tools 4.0 used to plan, run, and examine the docking reproductions. Kollman charges, polar hydrogen's and solvation features included into the receptor for docking reproduction. The features used to perform docking includes as Grid box size (x, y, and z): 60, 60, and 60 Å; Spacing between grid points: 0.451 Å; Algorithm for best conformers: Lamarckian Genetic Algorithm 23; No of conformers: 10; Population size: 150; No. of vitality assessment: 250000; No. of generation: 54000; Torsion angle 5.0°; External grid energy: 1000; Maximum number of retries; 10000. Binding energy calculates with adding intermolecular energy, total internal energy, torsion free energy and with subtracting unbound energy.
Statistical analysis
Analysis of Variance followed by Dunnett’s multiple range test. It employs to distinguish statistical significance (p<0.05) of results of the biochemical test. Graph Pad Instat (GraphPad Software, Inc., USA) program used for statistical analysis.
Results
Impact of DCM-F on blood glucose, body weight, HbA1c and lipid profile
The present study used 31 rats and 9 rats perished during completing the study (group 1- 2; group 2 - 1; group 3 - 3; group 4 -1; group 5-2). The blood glucose of experimental rats have described in Table 1a. The blood glucose was essentially (p<0.01) reduced in group 4 rats contrasted with the group 3 rats. In group 3 rats, there was a huge decline in the body weight (p<0.05) contrasted with the group 1 rats. There was a noteworthy boost up the body weight (p<0.01) in the group 4 rats contrasted with the group 3 rats (Table 1b).
Table 1. Changes in the blood glucose level and body weight of DCM-F treated normal and diabetic rats.
Normal Control |
Control + DCM-F |
Diabetic control |
Diabetic + DCM-F |
Diabetic + Glibenclamide |
(a) Blood glucose (mg/dl) |
0th day |
90.50 ± 7.87c,f |
88.67 ± 6.83a,c,e |
388.83 ± 20.95b,h |
396.67 ± 14.21b,e,f |
382.83 ± 14.44b,e |
7th day |
89.33 ± 7.28c,f |
89.17 ± 7.49a,c,f |
391.34 ± 21.69b,g |
369.67 ± 13.59b,d,h |
367.00 ± 19.31b,d |
15th day |
90.67 ± 5.92c,f |
87.10 ± 5.14a,c,f |
407.67 ± 17.91b,f |
302.83 ± 35.53b,c,h |
321.83 ± 16.85b,c |
30th day |
83.83 ± 7.08c,f |
83.17 ± 7.19a,c,f |
451.67 ± 33.24b,f |
164.83 ± 30.21b,c,h |
171.17 ± 17.16b,c |
45th day |
81.83 ± 2.32c,f |
86.17 ± 9.43a,c,f |
465.67 ± 28.27b,f |
126.10 ± 11.45b,c,h |
135.17 ± 13.67b,c |
(b) Body weight (g) |
Initial |
204.2 ± 0.90 |
204.2 ± 1.12 |
216.9 ± 2.6 |
215.8 ± 1.32 |
212.8 ± 1.2 |
|
Final |
213.3 ± 0.88c,f |
210.1 ± 0.83a,c,f |
103.4 ± 0.60b,g |
155.2 ± 2.62b,c,h |
168.5 ± 0.60b,d |
|
Changes |
9.1 |
5.9 |
- 93.5 |
- 60.6 |
- 44.3 |
|
| |
|
|
|
|
|
|
|
|
|
|
Values are mean ± SD. a – ns (not significant) compared with control; b- p<0.01 compared with control; c – p < 0.01 compared with diabetic control; d – p < 0.05 compared with diabetic control; e – ns (not significant) compared with diabetic control; f – p < 0.01 compared with diabetic rats treated with glibenclamide; g – p< 0.05 compared with diabetic rats treated with glibenclamide; h – ns (not significant) compared with diabetic rats treated with glibenclamide
Changes in the hemoglobin, glycosylated hemoglobin, plasma insulin, serum lipid profile, serum liver markers, urea, creatinine, and carbohydrate metabolic enzymes in experimental rats had shown in Table 2. The group 3 rats, there was a decline in the hemoglobin (p<0.05) contrasted with the group 1 rats. There was a decisive increase the hemoglobin and a decrease in HbA1c in the group 4 rats than contrasted with the group 3 rats. In the group 3 rats following 45 days, there was a huge decrease in plasma insulin contrasted with the group 1 rats. In group 4 and 5, DCM-F and Glyburide treatment increased plasma insulin in rats when contrasted with group 3 rats. Table 2b clarifies the results of lipid profiles in the experimental animals. In the group 3 rats proved an increase in the serum TG, TC, and decrease in HDL level when contrasted with group 1 rats. In group 4 and 5, rats treated with DCM-F and Glyburide had decreased TG, TC, and expanded HDL level when contrasted with group 3 rats. There were no huge changes noted in the group 2 rats when contrasted with group 1 rats.
Table 2. Effect of DCM-F on biochemical parameters in the normal and diabetic rats.
Group |
Normal Control |
Control + DCM-F |
Diabetic Control |
Diabetic + DCM-F |
Diabetic + Glibenclamide |
(a) Haemoglobin, Protein and Insulin |
Haemoglobin (g %) |
13.43 ± 0.59d,e |
13.31 ± 0.47a,d,g |
8.03 ± 0.26b,f |
12.21 ± 0.97b,d,f |
14.26 ± 0.30a,d |
HbA1c (mg/g) |
0.18 ± 0.02 d,e |
0.19 ± 0.01a,d,e |
0.62 ± 0.06b,f |
0.21 ± 0.01b,d,f |
0.20 ± 0.02a,d |
Protein (g/dL) |
5.59 ± 0.31d,e |
5.75 ± 0.24a,d,e |
3.17 ± 0.47b,f |
5.22 ± 0.25b,d,g |
5.87 ± 0.26a,d |
Plasma Insulin (U/ml) |
19.11 ± 0.72 d,f |
19.03 ± 0.26a,d,e |
4.11 ± 0.25b,f |
14.66 ± 0.54b,d,e |
15.26 ± 0.59a,d |
(b) Serum lipid profile |
TC (mg/dL) |
84.67 ± 4.93d,e |
83.50 ± 2.41a,d,e |
168.83 ± 8.98b,f |
81.17 ± 4.36b,d,e |
78.18 ± 6.79a,d |
TG (mg/dL) |
82.00 ± 3.03d,e |
84.50 ± 3.51a,d,e |
164.67 ± 6.56b,f |
95.17 ± 3.06b,d,f |
85.00 ± 4.65a,d |
HDL (mg/dL) |
53.50 ± 2.95d,e |
51.83 ± 2.48a,d,f |
33.34 ± 3.56b,f |
58.17 ± 3.19c,d,e |
57.50 ± 1.38a,d |
(c)Serum liver marker enzymes |
SGOT (µg/dL) |
41.53 ± 4.89d,f |
40.48 ± 3.53a,d,e |
85.44 ± 2.04b,f |
54.51 ± 3.69b,d,e |
52.25 ± 2.78b,d |
SGPT (µg/dL) |
39.60 ± 1.80d,e |
39.67 ± 2.50a,d,e |
112.50 ±10.7b,f |
47.67 ± 3.60b,d,e |
41.78 ± 1.60a,d |
ALP (µg/dL) |
12.08 ± 1.90d,e |
12.15 ± 1.41a,d,e |
42.83 ± 3.29b,f |
17.33 ± 3.29c,d,e |
13.67 ± 1.81a,d |
ACP (µg/dL) |
9.31 ± 1.30d,e |
9.20 ± 1.29a,d,e |
28.00 ± 1.29b,f |
15.04 ± 2.61c,d,g |
10.55 ± 1.70a,d |
Bilirubin (mg/dL) |
0.68 ± 0.08d,e |
0.67 ± 0.07a,d,e |
5.28 ± 1.60b,f |
0.92 ± 0.08b,d,e |
0. 84 ± 0.15a,d |
(d)Serum kidney function test |
Urea (mg/dL) |
14.90 ± 1.30d,e |
14.40 ± 1.30a,d,e |
37.80 ± 3.01b,f |
13.41 ± 1.51b,d,e |
12.71 ± 1.51a,d |
Creatinine (mg/dL) |
0.63 ± 0.05d,f |
0.62 ± 0.04a,d,f |
1.25 ± 0.14b,f |
0.98 ± 0.02b,d,e |
0.89 ± 0.06b,d |
(e) Carbohydrate metabolic enzyme levels in the liver tissues |
HK(Unit a/mg of protein) |
0.252 ± 0.028d,e |
0.242 ±0.022a,d,e |
0.081 ± 0.009b,f |
0.233 ± 0.02a,d,e |
0.233 ± 0.233a,d |
G6Pase (Unit b/mg of protein) |
0.186 ± 0.006d,e |
0.174 ±0.011a,d,e |
0.403 ± 0.055b,f |
0.204 ± 0.05a,d,e |
0.203 ± 0.203a,d |
FBP(Unit c/mg of protein) |
0.421 ± 0.021d,e |
0.435± 0.011a,d,g |
0.688 ± 0.025b,f |
0.459 ± 0.01a,d,e |
0.464 ± 0.464a,d |
Values are mean ± SD (n=6). a – ns (not significant) compared with control; b- p<0.01 compared with control; c – p < 0.05 compared with control; d – p < 0.01compared with diabetic control; e – ns (not significant) compared with diabetic rats treated with glibenclamide; f – p < 0.01 compared with diabetic rats treated with glibenclamide; g – p< 0.05 compared with diabetic rats treated with glibenclamide (HbA1c –glyoxylated hemoglobin; ACP - acid phosphatase; ALP - alkaline phosphatase, ALT - alanine transaminase; AST -aspartate amino transferase; HK- hexokinase; G6Pase – glucose 6 phosphatase; FBP – fructose 1,6 bis phosphatase)
Impact of DCM-F on liver and kidney function tests
In group 3 rats, noteworthy (p<0.05) increases in the SGOT, SGPT, ALP, ACP, bilirubin, urea and creatinine levels contrasted with group 1 rats. DCM-F in group 4 rats reduced the SGOT, SGPT, ALP, ACP, bilirubin (Table 2c), urea, creatinine, and increased the protein when contrasted with group 3 rats. There is no critical distinction between the DCM-F, and Glyburide treated rats (Table 2d).
Impact of DCM-F on Carbohydrate metabolic enzymes
The role of hexokinase reduced while G6-Pase and FBPase are essentially (p<0.01) increased in the group 3 rats contrasted and group 1 rats. Treatment of DCM-F and Glyburide have increased acts hexokinase and reduced the role of G6-Pase and FBPase contrasted with group 3 rats. In the features of group 1 and group 2 rats, there was no statistical significance noted (Table 2e).
Identification of active compound from DCM-F
The metabolites in the DCM-F of R. mucronata have identified based on their absorbance, mass spectral fragmentation (MSF) pattern and retention time and where possible, by co-chromatography with a genuine standard. A few alkaloids originated in the R. mucronata do not exist in a purified form. These compounds identified based on MSF data coupled with characterizations in previous reports (Table 3; A1). Identified alkaloids showed in Figure 1.
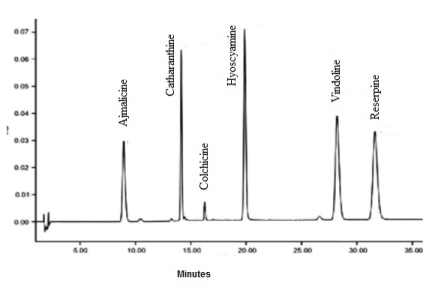
Appendices 1. HPLC-DAD-MS chromatogram of alkaloid elutes of R. mucronata DCM-F.
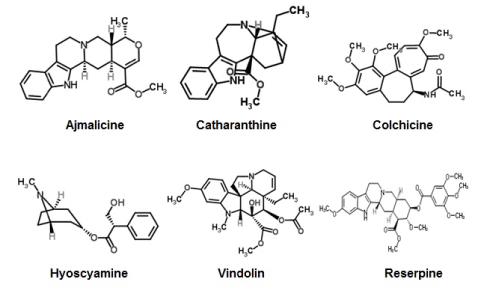
Figure 1. Chemical structures of identified alkaloids from R. mucronata DCM-F.
Table 3. HPLC-MS identified compouds in the active DCM-F of R. mucronata.
No. of Peak |
Retention time (tR) |
λmax |
[M + H]+ at m/z |
Name of the compound |
Peak 1 |
8.944 min |
230 nm |
353 |
Ajmalicine |
Peak 2 |
14.129 min |
284 nm |
765 |
Catharanthine |
Peak 3 |
16.786 min |
350 nm |
358 |
Colchicine |
Peak 4 |
19.879 min |
271 nm |
290 |
Hyoscyamine |
Peak 5 |
28.210 min |
420 nm |
555 |
Vindoline |
Peak 6 |
31.620 |
225 nm |
609 |
Reserpine |
Docking studies of identified alkaloids with targets
All the ligands have adopted with Lipinski's rule five except reserpine (Table 4). Docking simulation of all the ligands with targets produced clusters of conformers. It uses root mean square difference (RMSD) of 2.0 Å on the amino acid residues arginine, asparagine, glutamine, lysine, serine, tryptophan and tyrosine (ARG; ASN; GLN; LYS; TRP; SER; THR; TYR) in the target protein. Table 5 points out hydrogen bond donor and acceptor, intermolecular energy, inhibition constant and binding energy of selected ligands with target receptors. The result exposed ajmalicine, catharanthine, and colchicine showed the principal interaction with DPP-4, IRTK, and PTPN1, respectively (Figure 2).
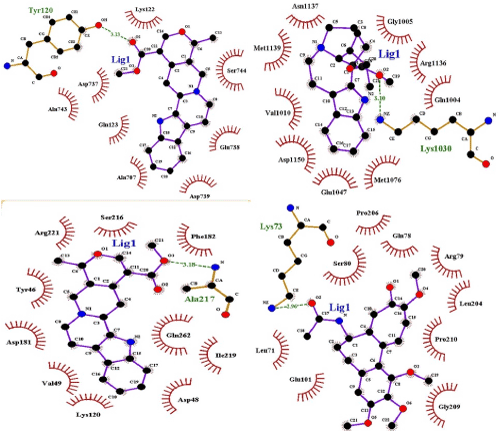
Figure 2. Alkaloids of R. mucronata DCM-F docked with DPP-IV, Insulin receptor tyrosine kinase and PTP-1B receptor. The receptor interaction with ligand is represented by gray, blue, green magenta and bright orange colors. The interacting bond between ligand and receptor represent in bright orange color (a) The atomic interaction between: HH12 atom of the ARG356 (magenta colour) in the DPP-IV receptor and the oxygen atom of ajmalicine (b) The atomic interaction between HZ3 atom of the LYS1030 (magenta colour) in the Insulin receptor and oxygen atom of catharanthine (c) The atomic interaction between HN atom of the SER 80 (magenta colour) in the PTP-1B receptor and an oxygen atom of colchicine.
Table 4. ADMET profile of identified compounds of R. mucronate.
Name of the compound |
MW |
logP |
tPSA |
HB Donors |
HB Acceptors |
Lipinski Violations |
Solubility
(mg/l) |
Oral Bioavailability (VEBER) |
Phospholipidosis |
PPI_Friendly |
Ajmalicine |
352.43 |
2.75 |
55.76 |
1 |
5 |
0 |
8216.11 |
Good |
Noninducer |
No |
Catharanthine |
336.43 |
2.8 |
46.53 |
1 |
4 |
0 |
8940.7 |
Good |
Noninducer |
No |
Colchicine |
399.44 |
1.96 |
83.09 |
1 |
7 |
0 |
13337.75 |
Good |
Inducer |
No |
Hyoscyamine |
289.37 |
2.27 |
50.97 |
1 |
4 |
0 |
16989.66 |
Good |
Inducer |
No |
Reserpine |
608.68 |
4.04 |
118.98 |
1 |
11 |
2 |
2181.78 |
Low |
Noninducer |
Yes |
Vindoline |
456.53 |
2.36 |
89.74 |
1 |
8 |
0 |
9915.06 |
Good |
Noninducer |
No |
Discussion
The diverse plant species around the world has recommended for treating diabetes by the World health organization (WHO). Earlier studies using animal models have hypoglycemic of a number of mangrove species [30]. However, knowledge about the novel therapeutic molecules from the mangrove plants is still inadequate. Therefore, we evaluate the anti-diabetic impact of R. mucronata through animal and computational studies. STZ is structurally similar to glucose, that used to induce β-cell necrosis. It correlates with a rapid decrease of NAD concentration [31]. Treatment of pre-diabetic rats with nicotinamide which is a water-soluble vitamin to induces diabetes with steady changes and decline in the insulin [32,33]. In this study, the STZ/nicotinamide diabetic rat employs to confirm NIDDM. Glucose is a synthetic classifier that gives carbohydrate as an energy molecule to the cells.
Hepatic glycogenolysis, gluconeogenesis and a limited amount of glucose intake by the cells were the main reasons to increase the glucose level in blood [34]. The self-regulated liver action keeps in the DCM-F treated rats through increased hemoglobin content and decreases blood glucose. Augmented blood glucose in diabetic rats causes attachment of glucose into the hemoglobin. Note of this, the glycosylated hemoglobin (HbA1C) increases in the diabetic rats and cause several micro and macrovascular complications [35]. We note the elevated HbA1C in the diabetic rats as result of improper liver homeostasis. It explained the hyperlipidemic disorders coupled with the characteristic symptom of diabetes i.e. hyperglycemia. However, the hypoinsulinemic circumstances are progressively in diabetic control rats. Meanwhile, the DCM-F treatment shows the notable anti-hyperlipidemic impact on rats on group four contrasted with group three rats. It shows the active substance present in the fraction have the ability to recover islets of Langerhans in treated diabetic rats [36].
Similarly, the SGOT, SGPT, ALP, ACP, and bilirubin are the marker compounds to show the ability of the liver metabolism. Acidic and soluble Phosphatases are catalyzing the hydrolysis of inorganic phosphate, and the these tolerably expand in diabetic rats [37]. The dcm-f treatment proved a critical decrease in these protein levels. SGOT and SGPT liver markers prolong in diabetic control by the vast action of gluconeogenesis [38]. Sellamuthu et al. [39] reported the mitochondrial and cell layer destruction in examining rats by a raised plasma SGOT. DCM-F treatment reduces this enzyme action in diabetic rats. It represented the renewal capacity of liver and kidney works by the active substance in the DCM-F.
Bilirubin dismisses by the liver, thusly; barrier with the ordinary liver capacities influence its rate of conjugation and dismiss. In this manner, an abnormal state of bilirubin has used as a record for liver ability and bile free status [40]. The present study explained a critical increment in bilirubin in diabetic untreated rats. These levels decrease in the treated gatherings, recommending improving liver abilities by DCM-F. This study proves a critical decreasing in serum all-out proteins levels in the diabetic rats. The decrease in serum protein in diabetic creatures shows tubular brokenness. It expands after organizing DCM-F.
Hexokinase is one of the keys glycolytic protein changes over glucose into glucose 6-phosphates. From now, the excess of G6Pase and FBPase expand in diabetic liver [41]. At the same time, acting hexokinase reduced effectively in untreated hyperglycemic rats. In DCM-F treated diabetic rats, the altitude of glycolytic metabolic pathway activated. It may reason for hexokinase increases. G6pase is an also protein of glucose homeostasis since it catalyzes the biochemical response of both glycogenolysis and gluconeogenesis [42]. Increased G6Pase movement in raised blood glucose rats gives hydrogen, which ties with NADP+ as NADPH, improves lipogenesis, last adds to expanded levels of glucose in the blood. Actuation of the gluconeogenic is because of the condition of insulin insufficiency, because under typical conditions, insulin capacities as a silencer for this protein. Fructose-1,6-bisphosphatase (FBPase-1) is upregulated in islets or pancreatic β-cell lines presented to elevated amounts of fat. This protein has unregulated, that catalyzes the dephosphorylation of FBPase-1 to FBPase [43]. Total triglycerides and cholesterol in diabetic control upgrades acting FBPase-1, and it gets to standardize when the treated with DCM-F of R. mucronata. Creatinine and urea level depict the function of the kidney. Increased urea production in diabetic rats breakdown the plasma and liver proteins. DCM-F action has clearly standardized the role of protein and urea. In untreated diabetic rats, creatinine increase in the serum, proposing a difficulty of kidney capacities [44]. DCM-F obviously proves a change in kidney working abilities.
Various instruments have proposed to isolate, recognize, and evaluate alkaloids from plants. Liquid chromatography - mass spectroscopy is one of the procedures that widely used in pharma industry [45]. It consolidates both the physical partition abilities of fluid chromatography and mass analysis capacities. HPLC-MS has to recognize and evaluate the alkaloids in Corydalis yanhusuo [46]. More than 200 alkaloids have identified from therapeutic plants and marine resources. It shows different pharmacological effects, for example, hostile to malarial movement (quinine), against disease (vincristine, and vinblastine), antidiabetic (Berberine and Glycosin), calming, α-glucosidase and free radical searching properties [47-50].
In the present study, there are six noteworthy alkaloids were distinguishing proof from the viable dichloromethane division of R. mucronata. Ajmalicine is an indole alkaloid reported that reduced the blood glucose levels in diabetic mice [51]. Catharanthine is a terpene indole alkaloid created by Catharanthus roseus used to treat diabetes [52]. Colchicine a calming drug, in NIDDM studied. Colchicine could decrease blood-glucose level in both fasting and post-prandial NIDDM patients [53-54]. Hyoscyamine is one of the main anticholinergic segments of belladonna alkaloids. It uses to treat symptomatic alleviation of the different gastrointestinal issue, heart issues, control a portion of the manifestations of Parkinson's ailment, and in addition for the control of respiratory discharges in palliative care, however, there is not a point by point study to affirm its antidiabetic impact. Reserpine is an indole alkaloid, an antipsychotic and antihypertensive medication [55]. Vindoline, a simple of Vinblastine, accounts for a compelling segment of chemotherapy in stage IA or IIA Hodgkin lymphomas [56]. The reports of prior studies confirm for the recognized alkaloids of R. mucronata for a further set of examinations to build up an antidiabetic specialist.
Computational medication plan gives a brilliant collaboration between the ligand and receptor. This method is not tedious, sensible; lessen the expense and reactions when gone into clinical studies, not like the regular method for medication disclosure [57]. Insulin release regulates by glucagon-like peptide-1 (GLP-1) and insulinotropic peptide (GIP) to slow down the blood glucose level [58]. DPP-4 deregulates these incretin hormones and cause hyperglycemia. Peptide hormone insulin accelerated the insulin receptor tyrosine kinase. However, the PTPN1 dephosphorylates the tyrosine amino acids of insulin receptor proteins, is fundamentally in charge of insulin resistance in T2DM [59]. In this way, the results of docking explain alkaloids of R. mucronata bind with the DPP-4 and PTPN1 receptors molecules. It stabilizes acting incretin to keep the normoglycemic conditions. There are some other conceivable mechanisms could also involve, for example, oxidative anxiety and stimulating target protein in the DCM-F.
Conclusion
This study gives strong affirmation of the useful impact of DCM-F of R. mucronata on noninsulin dependent diabetes mellitus. 100 mg/kg of DCM-F treatment in diabetes rats stimulate the action of β-cells to secrete insulin and improve anti-hyperglycemic conditions in NIDDM. It clearly evidenced from the carbohydrates, lipid profile, plasma insulin and marker enzymes in serum. Also, the favorable changes by DCM-F identified alkaloids ajmalicine, catharanthine, hyoscyamine, reserpine, and vindoline on DPP-4, PTPN1, and insulin receptor inhibitory action proved by molecular docking simulation. In summary, our results strongly suggest potential clinical benefits of DCM-F of R. mucronata use to regulate hyperglycemic condition against type 2 diabetes mellitus and this protection also associate with antihyperlipidemic effect.
Table 5. Molecular Docking interaction of identified molecules with target receptors.
Ligand |
Binding energy
(Kcal/mol) |
Total Intermolecular
Energy
(Kcal/mol) |
Inhibition constant
Ki (µM) at temperature
(298.15 K) |
No. of H bonds |
H bond donor |
H bond acceptor |
Ref. RMSD |
No. of Run |
DPP-IV |
Ajmalicine |
-6.55 |
-6.82 |
15.91 |
1 |
TYR120:HH |
LIG1: O |
129.691 |
10 |
Catharanthine |
-6.61 |
-6.82 |
14.17 |
2 |
TRP216:O
TRP305:HN |
LIG1:H
LIG1: O |
104.216 |
3 |
Colchicine |
-6.15 |
-6.42 |
31.23 |
1 |
SER212:HG |
LIG1: O |
105.091 |
6 |
Hyoscyamine |
-5.48 |
-6.48 |
96.22 |
1 |
TYR547:OH |
LIG1: O |
114.112 |
5 |
Vindoline |
-6.16 |
-6.62 |
30.28 |
1 |
THR156:HG1 |
LIG1:O,O |
129.676 |
1 |
IR |
Ajmalicine |
-7.45 |
-7.73 |
3.45 |
0 |
* |
* |
36.021 |
10 |
Catharanthine |
-6.43 |
-6.74 |
19.39 |
1 |
LYS1030:HZ3 |
LIG1: O |
36.988 |
9 |
Colchicine |
-6.08 |
-6.26 |
35.08 |
2 |
GLN1208:HE22
ASN1215:HD21 |
LIG1: O
LIG1: O |
29.888 |
3 |
Hyoscyamine |
-5.34 |
-6.35 |
121.81 |
1 |
GLN1107:OE1 |
LIG1:H |
38.912 |
1 |
Vindoline |
-5.99 |
-6.40 |
38.477 |
1 |
ASN1215:HD21 |
LIG1: O |
38.477 |
9 |
PTP-1 |
Ajmalicine |
-7.04 |
-7.43 |
6.97 |
1 |
LYS58:HN |
LIG1: O |
67.943 |
4 |
Catharanthine |
-4.82 |
-5.14 |
295.06 |
0 |
* |
* |
46.950 |
3 |
Colchicine |
-7.25 |
-7.50 |
4.86 |
1 |
SER80:HN |
LIG1: O |
46.387 |
6 |
Hyoscyamine |
-5.03 |
-6.10 |
204.25 |
1 |
SER80:OG |
LIG1:H |
47.970 |
6 |
Vindoline |
-4.93 |
-5.33 |
241.55 |
1 |
LYS73:HZ3 |
LIG1: O |
44.484 |
9 |
Note: * indicates no hydrogen bond formation
Acknowledgments
The authors are grateful to the University Grants Commission, Govt. of India, New Delhi, India (UGC Reference No.: 39-439/2010) for financial support. The authors extend special thanks to Central Instrumentation Facility, Department of Chemistry, IIT-Madras for HPLC-DAD-MS analysis.
References
- Kitabchi AE, Umpierrez GE, Miles JM, Fisher JN (2009) Hyperglycemic crises in adult patients with diabetes. Diabetes Care 32: 1335-1343. [Crossref]
- Ganz ML, Wintfeld N, Li Q, Alas V, Langer J, et al. (2014) The association of body mass index with the risk of type 2 diabetes: a case–control study nested in an electronic health records system in the United States. Diabetol Metab Syndr 6: 1-8. [Crossref]
- Inzucchi SE, Bergenstal RM, Buse JB, Diamant M, Ferrannini E, et al. (2012) Management of hyperglycemia in type 2 diabetes: a patient-centered approach position statement of the American Diabetes Association (ADA) and the European Association for the Study of Diabetes (EASD). Diabetes Care 35: 1364-1379. [Crossref]
- Ravikumar S, Inbaneson SJ, Suganthi P, Gnanadesigan M (2011) In vitro antiplasmodial activity of ethanolic extracts of mangrove plants from South East coast of India against chloroquine-sensitive Plasmodium falciparum. Parasitol Res 108: 873-878. [Crossref]
- Gurudeeban S, Ramanathan T, Satyavani K (2013) Antimicrobial and radical scavenging effects of alkaloid extracts from Rhizophora mucronate. Pharm Chem J 47: 50-53.
- Pandey AK, Gupta PP, Lal VK (2014) Hypoglycemic effect of Rhizophora mucronata in streptozotocin induced diabetic rats. J Complement Integr Med 11: 179-183. [Crossref]
2021 Copyright OAT. All rights reserv
- Rege A, Chowdhary A (2014) Evaluation of Alpha-Amylase and Alpha-Glucosidase Inhibitory Activities of Rhizophora mucronata. Int J Pharml Sci Res 5: 2261.
- Selvaraj G, Kaliamurthi S, Sheik HS, Thiruganasambandam R (2014) Molecular docking, isolation and biological evaluation of Rhizophora mucronata flavonoids as anti-nociceptive agents. Biomed. Prev Nutr 4: 555-560.
- Hardoko ES, Puspitasari Y, Amalia R (2015) Study of ripe Rhizophora mucronata fruit flour as functional food for antidiabetic. Int Food Res J 22: 953-959.
- Manilal A, Merdekios B, Idhayadhulla A, Muthukumar C, Melkie M (2015) An in vitro antagonistic efficacy validation of Rhizophora mucronate. Asian Pacific J Trop Dis 5: 28-32.
- Rohini RM, Das AK (2010) Triterpenoids from the stem bark of Rhizophora mucronata. Nat Prod Res 24: 197-202. [Crossref]
- Arumugam S, Palanisamy D, Sambandam RT (2014) Identification of bioactive compounds of Rhizophora mucronata poir. leaves using supercritical fluid extraction and GC-MS. World J Pharm Pharm Sci 3: 1621-1631.
- Satyavani K, Gurudeeban S, Manigandan V, Rajamanickam E, Ramanathan T (2015) Chemical Compositions of Medicinal Mangrove Species Acanthus ilicifolius, Excoecaria agallocha, Rhizophora apiculata and Rhizophora mucronate. Curr Res Chem 7: 1-8.
- Gurudeeban S, Satyavani K, Ramanathan T, Balasubramanian T (2012b) An In silico approach of alpha-ketoglutarate dependent Dioxygenase FTO inhibitors derived from Rhizophora mucronate. Drug Invent Today 4: 594-598.
- Gurudeeban S, Satyavani K, Ramanathan T, Ravikumar P (2012c) Dipeptidyl peptidase IV inhibitors derived from a mangrove flora Rhizophora mucronata: An in silico approach. Bangladesh J Pharmacol 7: 203-210.
- Manigandan V, Gurudeeban S, Satyavani K, Ramanathan T (2014) Molecular Docking Studies of Rhizophora mucronata Alkaloids Against Neuroin?ammatory Marker Cyclooxygenase 2. Int J Biol Chem 8: 91-99.
- Gurudeeban S, Kaliamurthi S, Thirugnanasambandam R (2016) Positive Regulation of Rhizophora mucronata Poir Extracts on Blood Glucose and Lipid Profile in Diabetic Rats. Herb Med 2: 2.
- Duncan MH, Singh BM, Wise PH, Carter G, Alaghband-Zadeh J (1995) A simple measure of insulin resistance. Lancet 346: 120-121. [Crossref]
- Csont T (2013) Determination of serum insulin level by ELISA, Practical course: Basic biochemical methods and ischemic heart models, pp: 3-4.
- Drabkin DL, Austin JH (1932) Spectrophotometric studies I. Spectrophotometric constants for common hemoglobin derivatives in human, dog, and rabbit blood. J Biol Chem 98: 719-733.
- Larsen ML, Horder M, Mogensen EF (1999) Effect of long-term monitoring of glycosylated hemoglobin levels in insulin-dependent diabetes mellitus. N Engl J Med 323: 1021-1025. [Crossref]
- Ghodkar P (1984) Chemical tests in kidney disease, Textbook of Medical Laboratory Technology pp: 118-132.
- Karmen A, Wroblewski F, Ladue JS (1955) Transaminase activity in human blood. J Clin Invest 34: 126-131. [Crossref]
- Kind PR, King EJ (1954) Estimation of plasma phosphatase by determination of hydrolysed phenol with amino-antipyrine. J Clin Pathol 7: 322-326. [Crossref]
- Malloy HT, Evelyn KA (1937) The determination of bilirubin level with the photoelectric colorimeter. J Biol Chem 119: 481-484.
- Lowry OH, Rosebrough NJ, Farr AL, Randall RJ (1951) Protein measurement with the Folin phenol reagent. J Biol Chem 193: 265-275. [Crossref]
- Cori GT, Cori CF (1952) Glucose-6-phosphatase of the liver in glycogen storage disease. J Biol Chem 199: 661-667. [Crossref]
- Crane RK, Sols A (1953) The association of hexokinase with particulate fractions of brain and other tissue homogenates. J Biol Chem 203: 273-292. [Crossref]
- Shibib BA, Khan LA, Rahman R (1993) Hypoglycaemic activity of Coccinia indica and Momordica charantia in diabetic rats: depression of the hepatic gluconeogenic enzymes glucose-6-phosphatase and fructose-1, 6-bisphosphatase and elevation of both liver and red-cell shunt enzyme glucose-6-phosphate dehydrogenase. Biochem J 292: 267-270. [Crossref]
- Selvaraj G, Kaliamurthi S, Thirugnasambandan R (2016) Effect of Glycosin alkaloid from Rhizophora apiculata in non-insulin dependent diabetic rats and its mechanism of action: In vivo and in silico studies. Phytomedicine 23: 632-640. [Crossref]
- Nayak Y, Hillemane V, Daroji VK, Jayashree BS, Unnikrishnan MK (2014) Antidiabetic activity of benzopyrone analogues in nicotinamide-Streptozotocin induced Type 2 diabetes in rats. The Scientific World J.
- Azooz MM, Alzahrani AM, Youssef MM (2013) The potential role of seed priming with ascorbic acid and nicotinamide and their interactions to enhance salt tolerance in broad bean (Vicia faba L.). Aust J Crop Sci 7: 2091-2100.
- Szkudelska K, Nogowski L, Szkudelski T (2014) Adipocyte dysfunction in rats with streptozotocin-nicotinamide-induced diabetes. Int J Exp Pathol 95: 86-94. [Crossref]
- Exton JH, Mallette LE, Jefferson LS, Wong EH, Friedmann N, et al. (1970) The hormonal control of hepatic gluconeogenesis. Recent Prog Horm Res 26: 411-461. [Crossref]
- Singh VP, Bali A, Singh N, Jaggi AS (2014) Advanced glycation end products and diabetic complications. Korean J Physiol Pharmacol 18: 1-14. [Crossref]
- Chikezie PC, Ojiako OA, Nwufo KC (2015) Overview of Anti-Diabetic Medicinal Plants: The Nigerian Research Experience. J Diab Metabol 6: 546.
- Pushparani DS (2015) High acid phosphatase level in the gingival tissues of periodontitis subjects. J Basic Clin Pharm 6: 59-63. [Crossref]
- Anupama V, Narmadha R, Gopalakrishnan VK, Devaki K (2012) Enzymatic alteration in the vital organs of streptozotocin diabetic rats treated with aqueous extract of Erythrina Variegata bark. Int J Pharm Pharm Sci 4: 134-147.
- Sellamuthu PS, Arulselvan P, Muniappan BP, Fakurazi S, Kandasamy M (2013) Mangiferin from Salacia chinensis prevents oxidative stress and protects pancreatic ß-cells in streptozotocin-induced diabetic rats. J Med Food 16: 719-727.
- Oche O, Sani I, Chiaka NG, Samuel NU, Samuel A (2014) Pancreatic islet regeneration and some liver biochemical parameters of leaf extracts of Vitex doniana in normal and streptozotocin–induced diabetic albino rats. Asian Pacific J Trop Biomed 4: 124-130. [Crossref]
- Visinoni S, Khalid NF, Joannides CN, Shulkes A, Yim M, et al. (2012) The role of liver fructose-1,6-bisphosphatase in regulating appetite and adiposity. Diabetes 61: 1122-1132. [Crossref]
- Mithieux G, Gautier-Stein A (2014) Intestinal glucose metabolism revisited. Diabetes Res Clin Pract 105: 295-301. [Crossref]
- Murali R, Srinivasan S, Ashokkumar N (2013) Antihyperglycemic effect of fraxetin on hepatic key enzymes of carbohydrate metabolism in streptozotocin-induced diabetic rats. Biochimie 95: 1848-1854. [Crossref]
- Ronco C, Grammaticopoulos S, Rosner M, De Cal M, Soni S, et al. (2010) Oliguria, creatinine and other biomarkers of acute kidney injury. Contrib Nephrol 164: 118-127. [Crossref]
- Li M, Hou XF, Zhang J, Wang S, Fu Q, et al. (2011) Applications of HPLC/MS in the analysis of traditional Chinese medicines. J Pharm Anal 1: 81-91.
- Cheng X, Shi Y, Zhen S, Sun H, Jin W (2010) HPLC-MS analysis of ethanol extract of Corydalis yanhusuo and simultaneous determination of eight protoberberine quaternary alkaloids by HPLC-DAD. J Chromatogr Sci 48: 441-444. [Crossref]
- Achan J, Talisuna AO, Erhart A, Yeka A, Tibenderana JK, et al. (2011) Quinine, an old anti-malarial drug in a modern world: role in the treatment of malaria. Malar J 10: 144. [Crossref]
- Chakraborty A, Brantner AH (2001) Study of alkaloids from Adhatoda vasica Nees on their antiinflammatory activity. Phytother Res 15: 532-534. [Crossref]
- Satyavani K, Gurudeeban S, Ramanathan T, Balasubramanian T (2014) Radical scavenging effect and GCMS identification of alkaloid fractions from Excoecaria agallocha L. Inventi Rapid: Ethnopharmacol 1: 1-4.
- Selvaraj G, Kaliamurthi S, Thirugnanasambandam R, Palanisamy M (2015) Formulation and Evaluation of Tablets from Antidiabetic Alkaloid Glycosin. J Med Sci 15: 18-24.
- Ezuruike UF, Prieto JM (2014) The use of plants in the traditional management of diabetes in Nigeria: Pharmacological and toxicological considerations. J Ethnopharmacol 155: 857-924. [Crossref]
- Watson RR, Preedy VR (2012) Bioactive food as dietary interventions for diabetes, Academic Press.
- Bruderer SG, Bodmer M, Jick SS, Meier CR (2015) Poorly controlled type 2 diabetes mellitus is associated with a decreased risk of incident gout: a population-based case-control study. Ann Rheum Dis 74: 1651-1658. [Crossref]
- Wang L, Sawhney M, Zhao Y, Carpio GR, Fonseca V, et al. (2015) Association Between Colchicine and Risk of Diabetes Among the Veterans Affairs Population With Gout. Clin Ther 37: 1206-1215. [Crossref]
- U.D.O. Health, H. Services (2014) Reference card from the seventh report of the joint national committee on prevention, detection, evaluation, and treatment of high blood pressure.
- Tabish Rehman M, UKhan A (2015) Understanding the Interaction between Human Serum Albumin and Anti-Bacterial/Anti-Cancer Compounds. Curr Pharm Des 21: 1785-1799. [Crossref]
- Young DC (2009) Computational drug design: a guide for computational and medicinal chemists, John Wiley & Sons.
- Kushwaha RN, Srivastava R, Mishra A, Rawat AK, Srivastava AK, et al. (2015) Design, Synthesis, Biological Screening, and Molecular Docking Studies of Piperazine-Derived Constrained Inhibitors of DPP-IV for the Treatment of Type 2 Diabetes. Chem Biol Drug Des 85: 439-446. [Crossref]
- Jung HA, Cho YS, Oh SH, Lee S, Min BS, et al. (2013) Kinetics and molecular docking studies of pimarane-type diterpenes as protein tyrosine phosphatase (PTP1B) inhibitors from Aralia continentalis roots. Arch Pharm Res 36: 957-965. [Crossref]