Oral squamous cell carcinoma (OSCC) has high incidence worldwide and poor prognosis for the past few decades. The common diagnostic procedure is to perform a visual oral examination (VOE)followed by a biopsy examination; however, these procedures have limitations in effectively detecting lesions with diffuse patterns or without clear pathological phenotypes. Thus, effective biomarkers for accurate diagnostic assessments are urgently needed to ensure optimal clinical management. In this current study, 43 tumor tissues and 42 non-cancerous matched tissues (NCMT) were harvested to determine new biomarkers for this purpose. The methylation levels of ZNF582m and PAX1m were determined by quantitative methylation-specific PCR. Clinical information was masked until the completion of methylation tests. ZNF582 and PAX1were highly methylated in tumors of OSCC patients with a true positive rate of 88.4% (ZNF582) and 76.7% (PAX1). The high methylation levels of both genes in tumors were more commonly observed in poor prognosis patients compared to those with well prognoses. Also, a high positive rate in NCMT was observed in poor prognosis patients. In conclusion, high methylation levels of ZNF582 and PAX1 in tumors and NCMT can be potential biomarkers in predicting OSCC prognosis, and can lead to optimal clinical management for OSCC patients.
Oral Squamous Cell Carcinoma (OSCC), methylation, PAX1, ZNF582
Abbreviations
OSCC: Oral squamous cell carcinoma; VOE: Visual oral examination; NCMT: Non-cancerous matched tissue; HNSCC: Head and neck squamous cell carcinoma; ZNF582: Zinc finger protein 582; PAX1: Paired box protein 1; QMSP: Quantitative methylation-specific PCR; COL2A: The type II collagen gene; Cp: crossing point; TPR: True positive rate; TNR: True negative rate; AUC: Area under curve; OR: Odds ratio; PCR: Polymerase chain reaction
Head and neck cancers comprise a group of cancers that occur in the oral cavity, the oropharynx, the nasal cavity, paranasal sinuses, the nasopharynx, the hypopharynx, and the larynx. Most (90%) of these cancers have squamous cell carcinoma histology and are called head and neck squamous cell carcinoma (HNSCC). HNSCC is the seventh most common cancer worldwide, with around 600,000 new diagnoses each year [1-6]. Oral squamous cell carcinoma (OSCC) is listed as the top common type and has been listed as one of the top 10 cancers that lead to death. To combat this cancer, the government offers biennial visual oral examination (VOE) for people who are over 30 years old and exposed to oral cancer risk factors [7,8]. Although there were advances in the therapeutic strategies and the implementation of screening programs, the prognosis of OSCC/OSCC remained unchanged for the following reasons: (i) more than half of oral cancer patients are diagnosed at late stages (III or IV) [7,9] and (ii) OSCC/OSCC is subject to field cancerization, leading to having higher risk of developing local recurrences, second primary tumors, or distant metastases [10,11]. Most of the current preoperative methods for clinical diagnoses of OSCC are based on the imaging of the neck region through palpation, ultrasound examination, CT scan, MRI examination, and aspiration cytology. These techniques are suboptimal and can misdiagnose the presence or absence of cancer in many patients [12-15]. To ensure optimal management of patients with OSCC, an effective biomarker for accurate assessment is required. It is especially true for people with special risk habits, such as betel nut chewing, smoking, and alcohol drinking.
The affected sites of OSCC are usually able to be assessed by direct inspection or endoscopic examination followed by biopsy and pathologic checking. It is, however, a great challenge in the cases of clinical lesions manifested with diffuse patterns or those without strong pathologic evidence of malignancy after biopsy. Then, identifying and developing other biomarkers for optimal clinical management becomes critical. Carcinogenesis in OSCC is a complex process which involves aberrant genetic and epigenetic events. Previous studies have shown that aberrant DNA methylation of zinc finger protein 582 (ZNF582) and paired box protein 1(PAX1) is a hallmark of neoplastic disease. Also, mass studies of these two methylated genes in cervical cancer have shown great clinical potential. Since both genes were also found to be highly associated with squamous cell carcinoma, here we would like to explore the clinical utility of both genes in OSCC prognoses by using paired specimen, including cancerous and non-cancerous matched tissues (NCMTs).
Patients’ recruitment, specimen collection, and DNA preparation
This study was approved by the Institutional Review Board (IRB) of Taipei Veterans General Hospital (VGH, IRB No. 2015-06-009AC). We collected total of 43 tumor tissues and 42 non-cancerous matched tissues (NCMT) as training test to determine the optimum cut-off values of M-index for each gene. These tissues were harvested from OSCC patients in Taipei Veterans General Hospital who had received surgical ablations of their primary tumors. Using the same M-index values generated from the training set, another 65 patients as a validation set were analyzed. Among them, 46 cancer patients were recruited, and two swabs were collected (one from the oral cancer lesion and the other one from the adjacent lesion (visually normal oral lesion)), and 19 patients from the training test who regularly came back for follow up examination were also collected the swab from the operative site as the control group. The flow chart of patient enrollment for the tissue collection was illustrated (Figure 1).
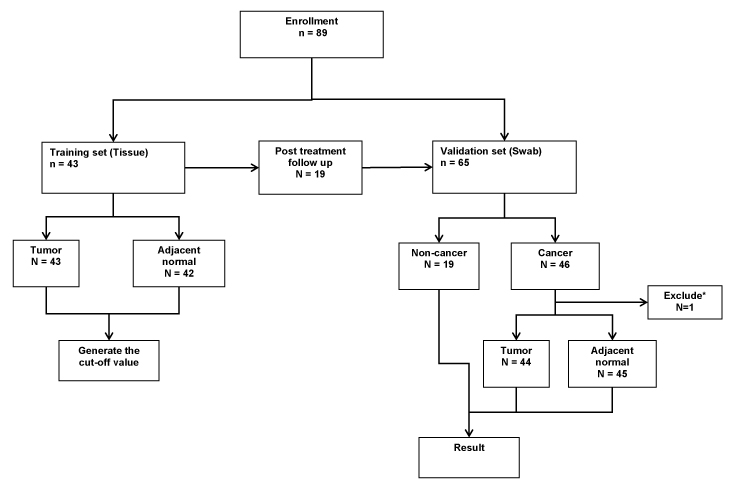
Figure 1. Flow chart of patient enrollment for the tissue collection.
43 pairs of tissues were harvested from OSCC patients for the training group. Another 65 patients as a validation including a new cohort of 46 oral SCC patients and 19 patients from the training test who regularly came back for follow-up were collected.
The tissue specimens were stored at -80°C until the molecular tests were performed. Tissues of size 2x2 mm were used for the gDNA extraction. The harvested oral swab cells by a sponge roll were preserved in a phosphate buffered saline solution at 4°C and were shipped to the laboratory for methylation tests in a week. Patients’ clinical information was masked until the completion of methylation tests and listed in Table 1.
Table 1. Characteristics and pathological classification of all specimen. *61 years old male, with T1N1M0 gingiva cancer.
Training set |
Numbers |
% |
Validation set |
Numbers |
% |
Specimen (N=85) |
|
|
Specimen (N=108) |
|
|
Tumor |
43* |
(50.6) |
Tumor |
44 |
(40.7) |
NCMT |
42 |
(49.4) |
NCMT |
45 |
(41.7) |
Age (N=43) |
53.60 ± 11.37 |
|
Normal |
19 |
(17.6) |
Age < 50 |
16 |
(37.2) |
Age (N=43) |
57.73 ± 10.73 |
|
Age ≥ 50 |
27 |
(62.8) |
Age < 50 |
16 |
(25.0) |
Gender |
|
|
Age ≥ 50 |
48 |
(75.0) |
Male |
34 |
(79.1) |
Gender |
|
|
Female |
9 |
(20.9) |
Male |
56 |
(87.5) |
Buccal |
15 |
(34.9) |
Female |
8 |
(12.5) |
Non-Buccal |
28 |
(65.1) |
Buccal |
13 |
(20.3) |
gingiva |
12 |
(42.9) |
Non-Buccal |
32 |
(50.0) |
Tongue |
12 |
(42.9) |
gingiva |
9 |
(28.1) |
Others |
4 |
(14.3) |
Tongue |
12 |
(37.5) |
T classification |
|
|
Others |
11 |
(34.4) |
T1 |
5 |
(11.6) |
T classification |
|
|
T2 |
12 |
(27.9) |
T1 |
11 |
(24.4) |
T3 |
1 |
(2.3) |
T2 |
18 |
(40.0) |
T4a |
20 |
(46.5) |
T3 |
3 |
(6.7) |
T4b |
5 |
(11.6) |
T4a |
9 |
(20.0) |
N classification |
|
|
T4b |
4 |
(8.9) |
Nx |
1 |
(2.3) |
N classification |
|
|
N0 |
27 |
(62.8) |
Nx |
9 |
(20.0) |
N1 |
6 |
(14.0) |
N0 |
31 |
(68.9) |
N2b |
8 |
(18.6) |
N1 |
1 |
(2.2) |
N2c |
1 |
(2.3) |
N2b |
2 |
(4.4) |
M classification |
|
|
N2c |
2 |
(4.4) |
Mx |
25 |
(58.1) |
M classification |
|
|
M0 |
18 |
(41.9) |
Mx |
24 |
(53.3) |
M1 |
0 |
(0) |
M0 |
21 |
(46.7) |
Stages |
|
|
M1 |
0 |
(0) |
Stage 1 |
5 |
(11.6) |
Stages |
|
|
Stage II/III |
13 |
(30.2) |
Stage 1 |
11 |
(24.4) |
Stage IV |
25 |
(58.1) |
Stage II/III |
15 |
(33.3) |
|
|
|
Stage IV |
19 |
(42.2) |
Bisulfite conversion and DNA methylation analysis
All the methylation tests were performed in an ISO17025-certified laboratory. Briefly, the tissues were ground, and the genomic DNA (gDNA) samples were extracted from the tissues/ swabs and bisulfite-converted using the Epigene™ Nucleic Acid Extraction Kit and Bisulfite Conversion Kit (iStat Biomedical Co., Ltd., New Taipei City, Taiwan), respectively. Quantitative methylation-specific PCR (QMSP) was performed to determine the methylation levels of ZNF582 and PAX1 (ZNF582m and PAX1m) by using TaqMan-based technologies with the Light Cycler LC480 system (Roche Applied Science, Penzberg, Germany). The type II Collagen gene (COL2A) was used as the internal reference and quality indicator. The PCR reactions consisted of an initial incubation at 95°C for 10 minutes, followed by 50 cycles of denaturation at 95°C for 10 seconds, and annealing and extension at 60°C for 40 seconds. Fluorescence data were collected during the annealing/extension step for determination of the crossing point (Cp). The rCp is the difference of crossing-point (Cp) values between the methylated genes and COL2A (rCp = CpGenem – CpCOL2A). The methylation levels were expressed as the M-Index with the formula of 10,000 X 2-rCp. When rCp is equal to ten (M-Index=9.77), there are about 0.1% of cancer cells in the specimen calibrated by cancer cell lines, and this defines positive methylation as seen in previous studies.
Statistical analysis
R Project ver. 3.3.1 was used for all statistical analyses. To evaluate the performance of DNA methylation in identifying the SCC lesion, Receiver operating characteristic (ROC) curve analysis was performed by plotting the true positive rate (TPR) and the true negative rate (TNR) at various M-indexes. In the training set, the Wilcoxon signed-rank tests were used to compare the methylation levels in paired tissues (NCMT and Tumor), for tumor location or prognosis analyses, Wilcoxon rank-sum tests were used. In the validation set, the correlation among methylation M-index and clinic-pathological parameters were analyzed by Student’s t-test or chi-square test, where appropriate. Statistical significance was declared at a p-value of less than 0.05.
Patient Characteristics
In this study, we collected 85 tissue specimens including 43 tumors and 42 NCMTs as training set and 108 swab specimens including 44 tumors, 45 NCMTs and 19 normal as validation set. The detailed clinical information was indicated in Table 1. 34 males and 9 females with an average age of 53.60 ± 11.37 were included in the training set. In the 43 tumor specimens, 15 were located at buccal and 28 at non-buccal locations. As for the tumor development stages, 5 patients were at stage I, 13 patients were at stage II/III, and 25 patients were at stage IV. 56 males and 8 females with an average age of 57.73 ± 10.73 were also included in the validation set. We also distinguished the patients according to the lesion site, 13were located at buccal and 32 at non-buccal locations. The tumor development stages were also shown in the table, 11 patients were at stage I, 15 patients were at stage II/III, and 19 patients were at stage IV.
DNA methylation in cancerous tissue and non-cancerous matched tissue (NCMT)
As mentioned, ROC methods were used to evaluate the performances of methylated genes in identifying the SCC lesions (Figure 2a). Both ZNF582m and PAX1 m had significantly high area under the curve (AUC)/odds ratio (OR) with values of 92.0%/39.1 and 83.9%/5.0,respectively (all p < 0.001). The methylation levels of the two genes at the tumor sites and NCMT were analyzed by box-and-whisker plots (Figure 2b). As expected, the methylation levels of both ZNF582m and PAX1mwere higher at the tumor site (median M-index: 1695.8 and 824.7, respectively) than those in NCMT (median M-index 0.53 and 0.01, respectively) with p values less than 0.001. At the methylation-positive cutoff (M-index=9.77), ZNF582m had 88.4% of TPR and 83.7% of TNR compared to those in PAX1m with rates of 76.7% TPR and 60.5%TNR, respectively.
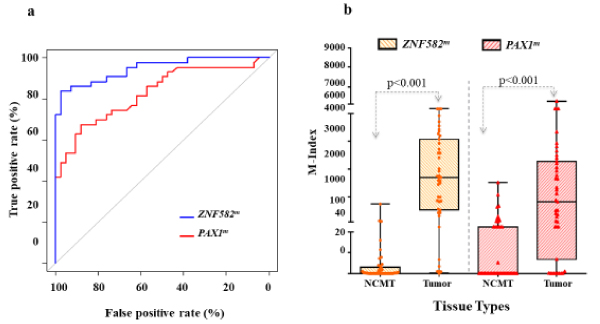
Figure 2. DNA methylation in Cancerous tissue and Non-Cancerous matched tissue (NCMT) in the training set.
(2a) Both ZNF582m and PAX1 m had significantly high area under the curve (AUC)/odds ratio (OR) with values of 92.0%/39.1 and 83.9%/5.0, respectively (all p < 0.001). (2b) By box-and-whisker plots, the methylation levels of both ZNF582m and PAX1m were higher at the tumor site (median M-index: 1695.8 and 824.7, respectively) than those in NCMT (median M-index 0.53 and 0.01, respectively) with p values less than 0.001. At the methylation-positive cutoff (M-index=9.77), ZNF582m had 88.4% of TPR and 83.7% of TNR compared to those in PAX1m with rates of 76.7% TPR and 60.5% TNR, respectively.
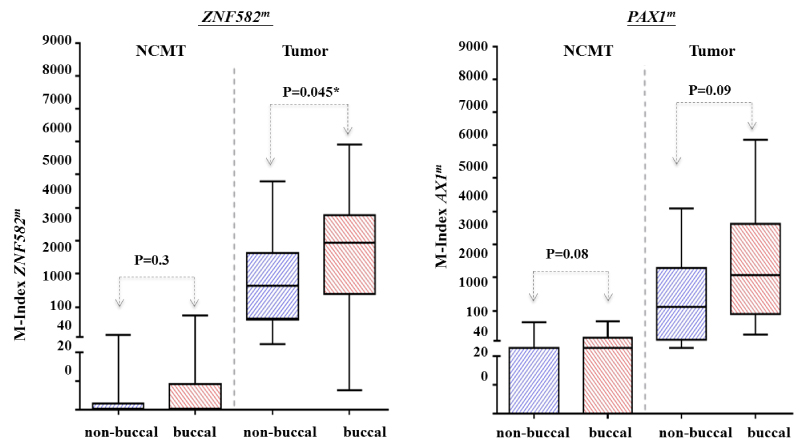
The anatomic location of OSCC, the buccal mucosa, has long been correlated to oral habits like chewing tobacco or betel quid. Thus, the association between cancer location and hypermethylation was investigated. Results showed that buccal tumors had significantly higher ZNF582mmethylation levels than tumors in non-buccal areas (median M-index: 2932 and 1644, respectively, p=0.045) (Supplement Figure S1). Similar methylation trends were observed in PAX1m: buccal tumors had higherPAX1m methylation levels than those tumors in non-buccal areas (median M-index: 2059 and 1199, respectively, p=0.09) (Supplement Figure S1). No significant differences in the methylation of both ZNF582m and PAX1 m were observed in either buccal or non-buccal areas in NCMT.
Validation of Clinical Cut-off value
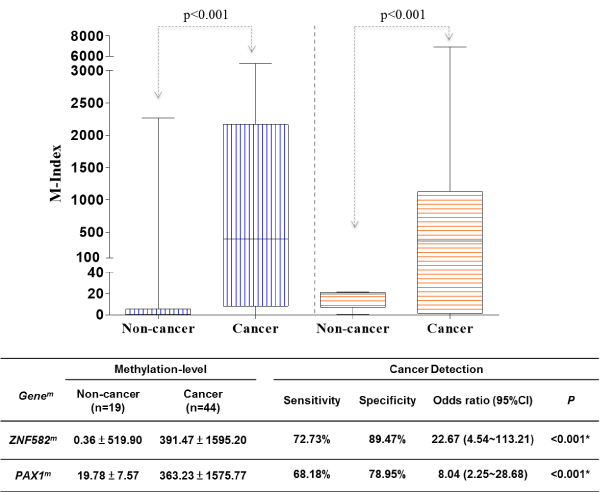
To validate the cut-off value generated from the training set, we recruited 65 patients as the validation set. Their tissues harvested by surgical excision were used for the methylation assay. As observed in the training set, the difference methylation level of ZNF582 and PAX1 between non-cancer and cancer group were analyzed. The methylation level of ZNF582mand PAX1min cancer groups were significantly higher (391.47 ± 1595 vs. 20/363.23 ± 1575.77) than those in non-cancer groups (0.36 ± 519 vs. 90/19.78 ± 7.57). The sensitivity, specificity and odds ratio were calculated for the detection of cancer. ZNF582mshowed a moderate sensitivity (72.73%) and high specificity (89.47%) and odds ratio (22.67), while PAX1m had lower sensitivity (68.18%), specificity (78.95%) and odds ratio (8.04) (Supplement Figure S2).
For clinical application as a non-invasive tool for OSCC discrimination, exofoliative cells collected by swabbing with sponge rolls were processed for methylation assays. In this validation set, both ZNF582m and PAX1m had the similar results to those in the training set. The box and whisker plots depict the significantly higher methylation levels of ZNF582m and PAX1m in tumor sites (median M-index: 1249.42 ± 1595.20 and 1006.44 ± 1575.77, respectively) than those in adjacent normal sites (median M-index: 501.06 ± 989.49 and 289.90 ± 780.52, respectively) (Figure 3).
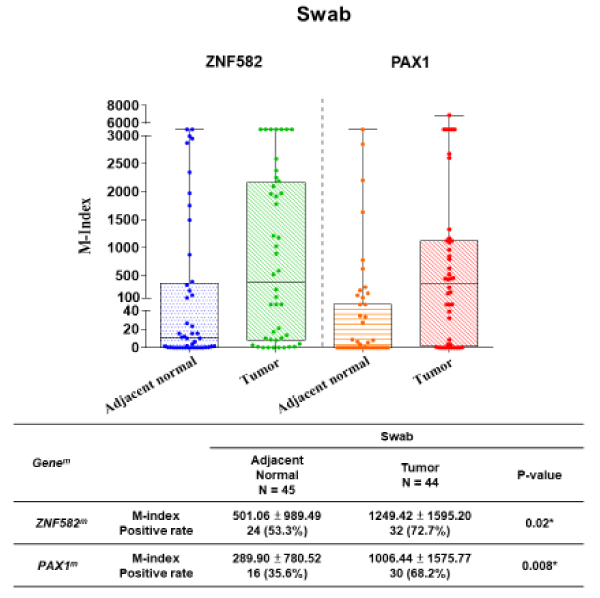
Figure 3. Difference M-index level between non-cancer & cancer group forZNF582 & PAX1 in the validation set on oral swab cells.
Both ZNF582m and PAX1m were analyzed by the box and whisker plots depict. Methylation levels of ZNF582m and PAX1m in tumor sites were significantly higher than those in adjacent normal sites.
In table 2, we further analyzed the difference methylation level of ZNF582m and PAX1m between adjacent normal and tumor in each group. We grouped those patients by age, gender, location, tumor size, lymph node metastasis and tumor histological differentiation. Both ZNF582m and PAX1m had significantly high methylation level of tumor in the male patients and with below 50 years of age. In the analysis of location, ZNF582m showed markedly difference methylation level in the buccal site, however,PAX1m had the significantly difference in the non-buccal site. We observed both ZNF582mand PAX1mhad distinct different methylation level between adjacent normal and tumor in the T4 group.
Table 2. The difference methylation level of ZNF582m and PAX1m between adjacent normal and tumor in each group of validation set.
Swab-N=44 |
N (%) |
|
ZNF582m |
PAX1m |
Age |
|
|
M-index (Mean ± std) |
P-value |
Positive rate |
P-value |
M-index (Mean ± std) |
P-value |
Positive rate |
P-value |
Age < 50 |
13 (29.5%) |
T |
1235.30 ± 1468.32 |
0.02* |
11 (84.6%) |
0.20 |
1381.75 ± 1640.95 |
0.02* |
10 (76.9%) |
0.02* |
N |
245.02 ± 517.40 |
7 (53.8%) |
85.46 ± 224.43 |
3 (23.1%) |
Age ≥ 50 |
31 (70.5%) |
T |
1255.34 ± 1668.79 |
0.10 |
21 (67.7%) |
0.30 |
849.06 ± 1547.68 |
0.18 |
20.(64.5%) |
0.13 |
N |
701.48 ± 1195 14 |
16 (51.6%) |
383.17 ± 907.39 |
13 (41.9%) |
Gender |
Male |
39 (88.6%) |
T |
1277.81 ± 1629.00 |
0.02* |
29 (74.4%) |
0.06 |
933.47 ± 1538.14 |
0.04* |
27 (69.2%) |
0.006* |
N |
593.55 ± 1091. 54 |
20 (51.3%) |
305.20 ± 821.10 |
14 (35.9%) |
Female |
5 (11.4%) |
T |
1575.59 ± 1939.14 |
0.22 |
3 (60.0%) |
1.00 |
1028.00 ± 1441.02 |
0.22 |
3 (60.0%) |
1.00 |
N |
356.55 ± 782.10 |
3 (60.0%) |
217.26 ± 340.07 |
|
2 (40.0%) |
Location |
Buccal |
13 (29.5%) |
T |
1172.34 ± 1636.61 |
0.048* |
11 (84.6%) |
0.10 |
906.81 ± 1304.68 |
0.92 |
10 (76.9%) |
0.67 |
N |
185.05 ± 447.70 |
6 (46.2%) |
852.16 ± 1338.49 |
8 (61.5%) |
Non-Buccal |
31 (70.5%) |
T |
1281.75 ± 1603.84 |
0.01* |
21 (67.7%) |
0.20 |
1048.22 ± 1694.72 |
0.06* |
20 (64.5%) |
0.02* |
N |
446.88 ± 912.29 |
15 (48.4%) |
341.40 ± 884.83 |
10 (32.3%) |
T |
T1 + T2 + T3 |
32 (72.7%) |
T |
1313.32 ± 1318.03 |
0.09 |
26 (81.3%) |
0.56 |
1259.65 ± 1769.95 |
0.03* |
23 (71.9%) |
0.02 |
N |
777.29 ± 1174.50 |
20 (62.5%) |
399.68 ± 894.89 |
13 (40.6%) |
T4 |
12 (27.3%) |
T |
1079.01 ± 1589.25 |
0.04* |
6 (50.0%) |
0.40 |
331.22 ± 440.45 |
0.03* |
7 (58.3%) |
0.21 |
N |
4.83 ± 8.44 |
3 (25.0%) |
16.63 ± 61.44 |
3 (25.0%) |
N |
N0 |
39 (88.6%) |
T |
1313.80 ± 1627.35 |
0.006* |
29 (74.4%) |
0.06 |
1045.41 ± 1596.79 |
0.02* |
27 (69.2%) |
0.01* |
N |
537.06 ± 1042.99 |
20 (51.3%) |
331.96 ± 821.63 |
15 (38.5%) |
N1 + N2 |
5 (11.4%) |
T |
747.33 ± 1356.84 |
0.96 |
3 (60.0%) |
1.00 |
702.53 ± 1529.77 |
0.37 |
3 (60.0%) |
0.52 |
N |
797.19 ± 1258.39 |
3 (60.0%) |
8.58 ± 14.16 |
1 (20.0%) |
Histology |
Well |
26 (59.1%) |
T |
1371.04 ± 1671.26 |
0.12 |
21 (80.8%) |
0.22 |
1401.33 ± 1836.77 |
0.04* |
19 (73.1%) |
0.048* |
N |
794.33 ± 1178.89 |
16 (61.5%) |
437.56 ± 978.97 |
11 (42.3%) |
Moderate |
16 (36.4%) |
T |
1175.11 ± 1571.30 |
0.04* |
10 (62.5%) |
0.48 |
488.55 ± 898.87 |
0.12 |
10 (62.5%) |
0.16 |
N |
267.00 ± 808.61 |
7 (43.8%) |
100.56 ± 238.35 |
5 (31.3%) |
Poorly |
2 (4.5%) |
T |
262.79 ± 371.61 |
0.51 |
1 (50.0%) |
1.00 |
15.98 ± 22.58 |
0.50 |
1 (50.0%) |
1.00 |
N |
3.31 ± 4.49 |
0(0%) |
1.80 ± 2.54 |
0(0%) |
The variation of methylation levels in well and poor prognostic conditions
To evaluate whether the methylation level of these two genes could be used as predictors for prognosis, scatter plots of ZNF582m and PAX1 m were used to analyze the prognoses of the training set in a 3-year follow-up (Figure 4). In the cohort of training set, 10 out of 43 patients had treatment failure (defined as poor prognosis), which included 3 with cancer recurrence, 3 with metastasis, and 4 with the development of second primary cancer.
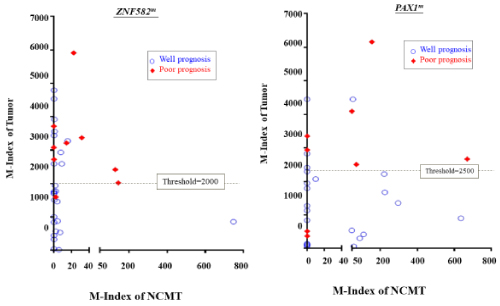
Figure 4. Scatter plot represented methylation level of PAX1m and ZNF582m for tumor and NCMT from the same patients.
In the training cohort, 10 out of 43 patients developed poor prognosis condition during the follow-up, included 3 with cancer recurrence, 3 with metastasis, and 4 developing second primary cancer. The methylation levels of ZNF582 or PAX1 in tumor and NCMT from the individual patient were represented in each dot on the diagram. Red dots were for patients were those with poor prognosis conditions. The M-indexes of ZNF582m and PAX1 min poor prognoses patients were 2.15 and 1.95-fold higher than in patients having well prognoses. The median M-index of ZNF582 m/PAX1 m was 1299/1582 for well prognoses, and 2797/3078 for poor prognoses, respectively. The threshold of M-index to distinguish between well and poor prognosis by ROC methods showed the prognosis threshold values of ZNF582m and PAX1m were 2000 and 2500, respectively.
Methylation levels in NCMTs and tumors are represented as X and Y-coordinates, respectively. Methylation levels of ZNF582 or PAX1 in tumor and NCMT from the individual patient were represented in each dot on the diagram. In particular, red dots represented patients with poor prognosis conditions, which were defined as patients developing tumor recurrence, metastasis, or second primary tumors after initial treatment. Results showed that ZNF582 m and PAX1 m were predominantly methylated in the tumor sites as compared to NCMTs (Figure 4). Methylation index was further analyzed in tumor sites in well and poor prognosis conditions.
Results showed that M-indexes of ZNF582m and PAX1 min poor prognoses patients were 2.15 and 1.95-fold higher than in patients having well prognoses. The median M-index of ZNF582 m/PAX1 m was 1299/1582 for well prognoses, and 2797/3078 for poor prognoses, respectively. The odds ratios were 17.8 forZNF582m and 22.0 for PAX1m (p=0.005 and 0.002, respectively). The threshold of M-index distinguishing well to poor prognosis was also determined by ROC methods, and the prognosis threshold values of ZNF582m and PAX1m were 2000 and 2500, respectively.
Oral squamous cell carcinoma is the most prevalent subtype of HNSCC. The average 5-year survival rates for OSCC have remained less than 50% of patients after the initial therapy. The survival rates for OSCC patients did not improve significantly over the past decades. Especially for patients with advanced stage III or IV diseases who received surgical treatment, the 5-year survival rate is as low as 15 to 25 percent. However, if diagnosed at an early stage (I or II), the survival rate can be improved up to 75 to 85 percent (1, 2, 4). Multiple lesions at different carcinogenic stages may simultaneously manifest over the carcinogen-exposed mucosa, a phenomenon called field cancerization. This clinical behavior is associated with tumor recurrence and poses a major clinical challenge for the initial treatment of OSCC. Therefore, development of easily applied biological markers for early detection, and rendering early treatment of OSCC to get a better therapeutic outcome is an urgent demand for OSCC patients. In addition, most of the causes of treatment failure have been attributed to local recurrence, development of second primary cancers, and distant metastasis. A strict follow-up schedule and active intervening management may improve survival rates if potential biological markers can be developed and applied to predict such conditions at the initial treatment [16-19]. Genetic markers from DNA or markers imposed on DNA possess high potential to be developed as stable, reliable, and sensitive biomarkers through polymerase chain reaction (PCR) related amplification. This exceeds the robustness of mRNA and protein during the laboratory retrieval procedures. Previously, genetic mutations in genes such as p53, PTEN and Ras, or the gain or loss of chromosomes have been well associated with OSCC occurrence. However, due to the diversity of these mutations, detecting mutations on such specific molecules for cancer screening is a qualitative, labor-intensive, and possibly insensitive procedure. DNA methylation has been recognized as one of the important research field in cancer epigenomics [20-27]. A previous case-control study using harvested oral epithelial cells from normal and cancerous patient cohorts using oral swabs has demonstrated that the high methylation of PAX1 was correlated with cancer status.
Our results using paired tissues for comparison showed the methylation levels of tumor tissues for these two genes were significantly higher than those in NCMTs (p value < 0.001). We collected 85 tissues including tumor tissues and adjacent normal tissues to determine the optimum cut-off values of the methylation genes. The cut-off value generated from the training set will be used to validate the clinical performance through the fresh swabs. For the clinical application of methylation genes detection, it would be more convenient, user-friendly, effective, and non-invasive method to collect the oral epithelial cells. Therefore, we chose the swabs in the validation set. Our results showed similar results of methylation level in both the training and validation set. It indicated that the performance of methylation genes would not varied by the different specimen collection method.
Fighting poor prognostic conditions, such as recurrence and distant metastasis after the initial treatment remains one of the most challenging tasks in the clinic. In order to gain deep insight and explore the potential use of these methylation markers in the clinic, we further correlated the methylation levels of these two genes during poor prognostic conditions. In our data, we observed that most patients had higher methylation levels of PAX1 and ZNF582 in poor prognoses than in well prognoses. It may indicate the correlation and potential application of gene methylation in predicting the clinical outcomes.
ZNF582m and PAX1m were more highly methylated in tumor sites; however, PAX1m methylation was also observed at their NCMT (Figure 2b). We observed high methylation levels of ZNF582 in NCMTs with the tendency of developing recurrent diseases, which may implicate a field cancerization phenomenon. The odds ratios were 1.4 for PAX1 and 16.25 for ZNF582, respectively (Data not shown). This result implies a more frequent follow-up schedule is necessary for OSCC patients with high methylation markers in the initial treatment for early identifying and managing the anticipated poor prognostic conditions. Among these 2 methylation markers, high methylation levels of ZNF582 may have greater potential to predict a poor treatment outcome in terms of recurrence, metastasis, and developing second primary lesions. It can be further verified by future studies using a larger cohort.
In conclusion, our data suggested that combinational use of high methylation statuses of ZNF582 and PAX1 can be developed as biomarkers for oral cancer screening in high-risk populations and for predictors of potential poor prognostic conditions.
This work was supported by grants from the Taipei Veterans General Hospital V104C-145 and grants from the Health and Welfare Surcharge of tobacco products from the Ministry of Health and Welfare for Excellence for Cancer Research MOHW104-TD-B-111-02. iStat Biomedical Co., Ltd. supported the testing kits used in the study.
All the authors declared no conflict of interest.
View supplementary data
- Argiris A, Karamouzis MV, Raben D, Ferris RL (2008) Head and neck cancer. Lancet 371: 1695-1709. [Crossref]
- Du Y, Peyser ND, Grandis JR (2014) Integration of molecular targeted therapy with radiation in head and neck cancer. Pharmacol Ther 142: 88-98. [Crossref]
- Ferlay J, Shin HR, Bray F, Forman D, Mathers C, et al. (2010) Estimates of worldwide burden of cancer in 2008: GLOBOCAN 2008. Int J Cancer 127: 2893-2917. [Crossref]
- Leemans CR, Braakhuis BJ, Brakenhoff RH (2011) The molecular biology of head and neck cancer. Nat Rev Cancer 11: 9-22. [Crossref]
- Miller KD, Siegel RL, Lin CC, Mariotto AB, Kramer JL, et al. (2016) Cancer treatment and survivorship statistics, 2016. CA Cancer J Clin 66: 271-289. [Crossref]
- Siegel RL, Miller KD, Jemal A (2016) Cancer statistics, 2016. CA Cancer J Clin 66: 7-30.
- Kao SY, Lim E (2015) An overview of detection and screening of oral cancer in Taiwan. Chin J Dent Res 18: 7-12. [Crossref]
- Warnakulasuriya S (2009) Global epidemiology of oral and oropharyngeal cancer. Oral Oncol 45: 309-316. [Crossref]
- Lo WL, Kao SY, Chi LY, Wong YK, Chang RC (2003) Outcomes of oral squamous cell carcinoma in Taiwan after surgical therapy: factors affecting survival. J Oral Maxillofac Surg 61: 751-758. [Crossref]
- Braakhuis BJ, Brakenhoff RH, Leemans CR (2005) Second field tumors: a new opportunity for cancer prevention? Oncologist 10: 493-500. [Crossref]
- Mohan M, Jagannathan N (2014) Oral field cancerization: an update on current concepts. Oncol Rev 8: 244. [Crossref]
- Carreras-Torras C, Gay-Escoda C (2015) Techniques for early diagnosis of oral squamous cell carcinoma: Systematic review. Med Oral Patol Oral Cir Bucal 20: e305-315. [Crossref]
- Licitra L, Felip E; ESMO Guidelines Working Group (2009) Squamous cell carcinoma of the head and neck: ESMO clinical recommendations for diagnosis, treatment and follow-up. Ann Oncol 20 Suppl 4: 121-122. [Crossref]
- Omar E (2015) Current concepts and future of noninvasive procedures for diagnosing oral squamous cell carcinoma--a systematic review. Head Face Med 11: 6. [Crossref]
- Stuckensen T, Kovács AF, Adams S, Baum RP (2000) Staging of the neck in patients with oral cavity squamous cell carcinomas: a prospective comparison of PET, ultrasound, CT and MRI. J Craniomaxillofac Surg 28: 319-324. [Crossref]
- Brennan JA, Mao L, Hruban RH, Boyle JO, Eby YJ, et al. (1995) Molecular assessment of histopathological staging in squamous-cell carcinoma of the head and neck. N Engl J Med 332: 429-435. [Crossref]
- Ganly I, Kaye SB (2000) Recurrent squamous-cell carcinoma of the head and neck: overview of current therapy and future prospects. Ann Oncol 11: 11-16. [Crossref]
- Rivera C, Venegas B (2014) Histological and molecular aspects of oral squamous cell carcinoma (Review). Oncol Lett 8: 7-11. [Crossref]
- Slootweg PJ, Hordijk GJ, Schade Y, van Es RJ, Koole R (2002) Treatment failure and margin status in head and neck cancer. A critical view on the potential value of molecular pathology. Oral Oncol 38: 500-503. [Crossref]
- Chao TK, Ke FY, Liao YP, Wang HC, Yu CP, et al. (2013) Triage of cervical cytological diagnoses of atypical squamous cells by DNA methylation of paired boxed gene 1 (PAX1). Diagn Cytopathol 41: 41-46.
- Huang YK, Peng BY, Wu CY, Su CT, Wang HC, et al. (2014) DNA methylation of PAX1 as a biomarker for oral squamous cell carcinoma. Clin Oral Investig 18: 801-808. [Crossref]
- Kan YY, Liou YL, Wang HJ, Chen CY, Sung LC, et al. (2014) PAX1 methylation as a potential biomarker for cervical cancer screening. Int J Gynecol Cancer 24: 928-934. [Crossref]
- Laird PW (2003) The power and the promise of DNA methylation markers. Nat Rev Cancer 3: 253-266. [Crossref]
- Lin H, Chen TC, Chang TC, Cheng YM, Chen CH, et al. (2014) Methylated ZNF582 gene as a marker for triage of women with Pap smear reporting low-grade squamous intraepithelial lesions - a Taiwanese Gynecologic Oncology Group (TGOG) study. Gynecol Oncol 135: 64-68.
- Liou YL, Zhang TL, Yan T, Yeh CT, Kang YN, et al. (2018) Combined clinical and genetic testing algorithm for cervical cancer diagnosis. Clin Epigenetics 8: 66.
- Liou YL, Zhang Y, Liu Y, Cao L, Qin CZ, et al. (2015) Comparison of HPV genotyping and methylated ZNF582 as triage for women with equivocal liquid-based cytology results. Clin Epigenetics 7: 50. [Crossref]
- Sharma S, Kelly TK, Jones PA (2010) Epigenetics in cancer. Carcinogenesis 31: 27-36. [Crossref]