Abstract
Thermography is a process where a thermal camera captures and generates an image by using infrared radiation, emitted from an object. Thermography has had limited use in dentistry, but with recent technological advances, thermography has been employed to produce digital images. An Android software application was developed, called the Dental Thermal App (DTA), to facilitate a simple, cost-effective, systematic and clinically-based workflow. The application functions on a mobile device and requires the use of a connected Flir camera, which has 19 200 pixels of thermal image resolution, measures temperatures between -20 to 120°C and can detect differences in heat as little as 0.01°C. Thermal imaging provides an alternative method for visualization for identification and assessment, with applications in patient records, documentation, infection control, education and laboratory clinical work. DTA has been developed, tested and launched and is a novel, low-cost, portable, non-invasive digital tool for dentistry. DTA provides an alternative mobile tool that provides improved accessibility for clinicians and patients.
Keywords
thermography, thermal imaging, digital image, dental thermal app, software, medical device, technology
Introduction
Thermography is a process where a (thermal) camera captures and generates an image by using infrared radiation, emitted from an object [1]. The image provides an opportunity to visibly record invisible (to the human eye) infrared energy or heat. Thermography is non-invasive, non-contact, user-friendly and a portable imaging method and has been used in various industrial fields, such as engineering and construction.
Thermography is now an evolving and expanding field in medicine [2] as a diagnostic tool, currently used to diagnose vascular malformations [3], thyroid nodules [4] and differentiating different intraocular tumors [5]. Specific to medicine, thermography is a field of science that analyzes and records the biothermal changes in various structures to assess health or disease [6]. Using infrared radiation, a pixel map, also known as thermogram, is generated to record biothermal change. Each temperature change is defined with a different color [7]. A thermogram with less colors due to less heat production may suggest areas of poor blood circulation, and vice versa [6].
Thermography has had limited use in dentistry [8], but with recent technological advances, thermography has been employed for the production of digital images [8,9] to assess changes in the temperature of (1) restorations, (2) inflamed periodontal tissues, (3) disease of the temporomandibular joints and (4) detecting intraosseous temperature changes during dental implant placement [10,11]. Thermography has recently been used to monitor inflammation after dental surgeries [10] and has shown promise as a tool to diagnose pathological conditions [10].
Digital dentistry technologies tend to have limited use, due to the high cost of equipment [12], software [13], and the challenging workflow [14]. Dental thermography has also faced these challenges. This report explores the development of a novel dental thermal imaging application that is simple, cost-effective and efficient.
Materials and methods
An Android software application was developed, called the Dental Thermal App (DTA), to facilitate a simple, cost-effective, systematic and clinically-based workflow. The application functions on a mobile device and requires the use of a connected Flir camera.
Functionality
The application is compatible with any Android-based mobile device. To acquire the app, turn on the Android device and select the Google Play icon. Type Dental Thermal App (DTA) and download the application (current version is 2.6). Alternatively, scanning the QR scan code (Figure 1) will bring up the app. Once downloaded, tap the DTA app to open the application (Figure 2). On the home screen, the menu icon in the top left corner provides all the administrative details (Figure 3), such as the version, settings and the contact information. All the images taken in DTA are also stored in My Gallery and in the Google Photos section.
Figure 1: QR code for DTA application.
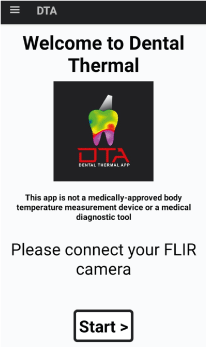
Figure 2: DTA application home screen.
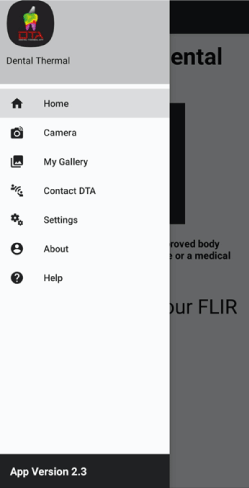
Figure 3: : DTA administrative information.
To begin, tap the Start button (Figure 2). Connect and turn on and the Flir camera (either One Pro or the One Pro LT) and allow DTA to access the camera (select OK). The DTA functions as an imaging app, similar to any smart phone camera. The image is based on heat and has a slight lag; therefore, it is recommended to move the phone slowly, allowing the image to process and then gently pressing the shutter release to take the thermal image. There are several selectable icons across the top of the screen (Figure 4), such as Visual, MSX, Thermal Palettes and Temperature.
The Visual feature (Figure 4) provides a standard non-thermal image, which is useful as a comparison or orientation image. Thermal images can be generated selecting the Thermal icon (Figure 5). There are several thermal palettes or filters to choose from, which drop down when the Palette icon is selected (Figure 6). Each palette will have a different colour representation of the heat energy of the object.
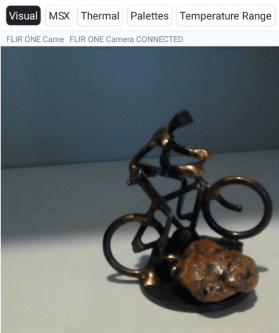
Figure 4: DTA icons sections.
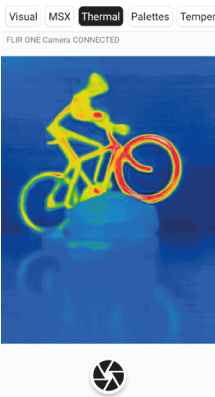
Figure 5: Thermal function.
The MSX (Multi-Spectral Dynamic) icon (Figure 6) provides improved delineation of objects in the thermal image mode. The Temperature icon (Figure 7) provides a minimum and maximum temperature range in the image. Either Celsius or Fahrenheit may be selected. The exact surface temperature of a specific object may be determined by touching the screen where the temperature value is desired. There is a zoom in feature, activated by pinching the image in the screen, similar to other smart phone cameras (Figure 8). The area that has been zoomed in is the ‘head’ of the cyclist, seen in (Figure 7).
This app also provides draw on and write on features (Figure 9). For drawing, select the brush, desired colour and opacity (Figure 10).
Labels can also be attached to images by selecting the Text icon (Figure 11), typing in the text and then simply sliding the label to the desired location. An eraser, other filters and emojis are also available, should the need arise. When the thermal image is ready to be saved, tap the download icon ↓ (Figure 11). A section for the Patient or Project name will drop down (Figure 12) with a section for Notes.
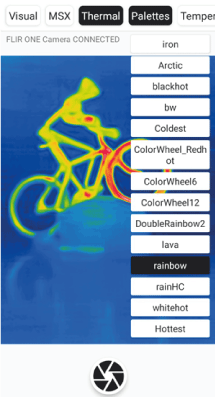
Figure 6: Thermal palette selections.
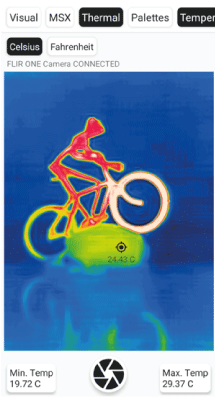
Figure 7: Temperature ranges.
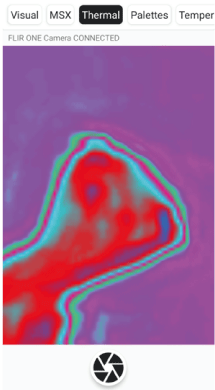
Figure 8: Zoom feature.

Figure 9: Draw/write features.
Type in the required information and then tap the Save button. The image, the name and notes and all relevant information will now be saved as a png file. The saved image can now be transfer or shared through any pathway for communication (text, email, etc.).
Image capture
Flir One Pro-Series cameras were developed as an extension of the smart devices through an adjustable 4 mm FLIR OneFIT TM connector attachment. This camera is a measurement tool that produces high thermal resolution images. Flir One Pro-Series includes the One Pro model and the One Pro LT model, which have similar functions. These models were equipped with FLIR VividIR and MSX® (Multi-Spectral Dynamic Imaging) that will enhance thermal images for better visualization. The Flir One Pro has 19 200 pixels of thermal image resolution, measures temperatures between -20 to 120°C and can detect differences in heat as little as 0.01°C [15].
Discussion
It is recognised in dentistry that proper visualization remains a key component to the examination [16]. Thermal imaging provides an alternative method for visualization, providing an unconventional method of identification and assessment. This permits the invisible to be visible, which presents several immediate fields of application.
The first application is patient records and documentation. In dentistry, it is essential to document certain aspects of the patient visit. Pre-screening, utilizing surface temperature, has been and still remains a common practice. DTA provides a simple, accurate and cost-effective method to determine the patient’s surface temperature [17] and provides the proper documentation, with the patient’s name and date, ideal for records and documentation (Figure 13).
The second application is infection control. Hard surface disinfection is critical to dentistry, but it can be difficult to confirm or recall if it was completed. (Figure 14) contains images of the same countertop at approximately the same time (Figure 14) (left) is a photo image, while (Figure 14) (right) is the thermal image. The thermal image depicts the energy from a recently placed hand, demonstrating that it just touched the countertop. In a dental setting, it would be prudent to disinfect that surface again. Properly fitted masks are also critical in dentistry, especially during the pandemic. The N95 fit test is quite subjective [18] and the DTA app could provide an alternative evaluation. (Figure 15) is an individual exhaling while wearing a KN95 mask. The area of darker greyness under the left eye illustrates heat and could be interpreted as a leaky seal. DTA could be explored for further evaluation.
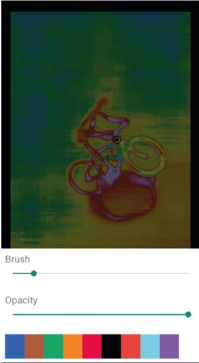
Figure 10: Colour and opacity selections.
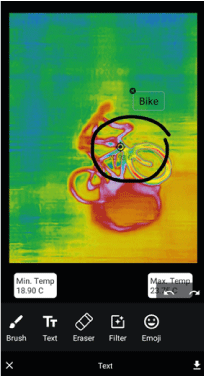
Figure 11: Text selection.
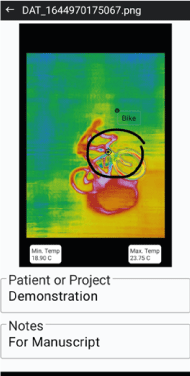
Figure 12: Patient or project information.
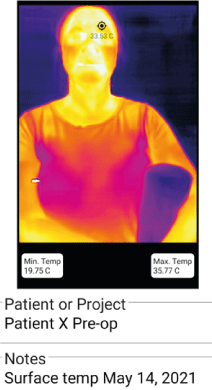
Figure 13: Patient’s surface temperature documentation.
Education is the third application. The training of dental students involves several peripherals and materials, to provide additional information for the diagnosis and treatment of disease [19]. Many peripherals and materials are sensitive and are influenced by how they are handled by the student/operator. Improper handling and use can result in inaccurate diagnoses. The DTA app provides guidance for instruction and confirmation of appropriate operator performance. For example, (Figure 16) is a thermal image of a drill performing a preparation on a model. The thermal image illustrates that substantial heat has been generated, which is detrimental to the health of the tooth [20]. DTA can be used to identify these situations and rectify the procedure before an iatrogenic problem occurs [21]. Similarly, testing a tooth’s vitality may require thermal testing (with cold). If performed improperly, the wrong diagnosis could be concluded. (Figure 17) illustrates this procedure and the thermal image demonstrates whether an adequate testing scenario has occurred.
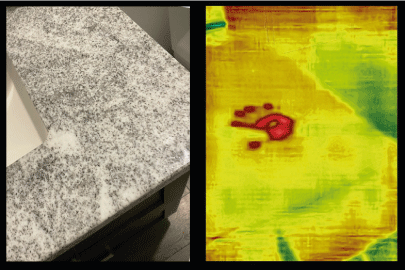
Figure 14: Hard surface disinfection.
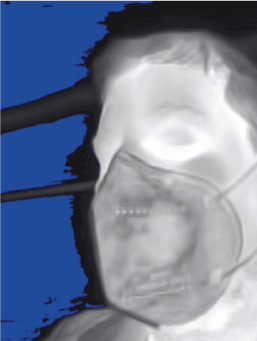
Figure 15: KN95 mask thermography.
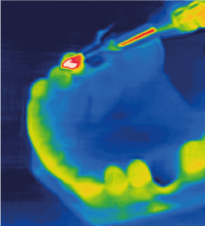
Figure 16: Drilling thermography.
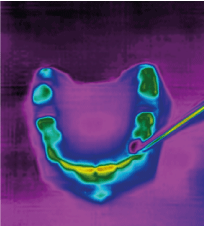
Figure 17: Cold test thermography.
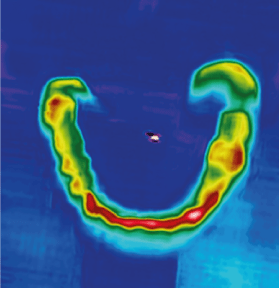
Figure 18: Thermography occlusion visualization.
A final application is laboratory clinical work. Prostheses must be properly evaluated before they are delivered to the patient. A specific evaluation is establishing a proper bite, which is typically performed with sprays and papers. (Figure 18) is a thermal image of a mandibular prosthesis. The image illustrates high temperatures at the lower front area. This was due to excessive heat caused by biting, or occluding, with the upper teeth. This energy seems concentrated in a localized area and should be equalized to the other teeth. DTA could be used as a novel visualization record to assess and document how the teeth come together prior to patient delivery.
DTA is a fluid and dynamic application. Further research is required to explore novel applications and develop research investigations. Although DTA has been developed as an application for clinicians, there is the possibility that it could be expanded as a tool for teledentistry and connected oral health.
Conclusions
A novel software application, called Dental Thermal App, has been developed, tested and launched onto Google Play. The application has been revised and approved by the Teledyne FLIR Developer Community is now available for download and use. DTA is a novel, low-cost, portable, non-invasive digital tool for dentistry. The software could provide limitless applications in imaging, assessment, identification and documentation. DTA provides an alternative mobile tool that provides improved accessibility for clinicians and patients.
Acknowledgments
A very special thank you to Lina Kalman (CDA II), for the countless hours of input and advice during development, and to Arti Saxena for assisting with the introduction component. Teledyne Flir kindly provided the SDK and invaluable guidance. This application was developed with our visionary partners at Techsaga. The project was made possible by funding from the Schulich Dentistry IRG and the International Congress of Oral Implantologists IDREF fund.
Conflict of interest
The author is the developer of the DTA app.
References
- Redaell V, Bergero D, Zucca E, Ferrucci F, Costa L, et al. (2014) Use of thermography techniques in equines: principles and applications. J Equine Vet Sci 34: 345-350.
- Casas-Alvarado A, Mota-Rojas D, Hernández-Ávalos I, Mora-Medina P, Olmos-Hernández A, et al. (2020) Advances in infrared thermography: Surgical aspects, vascular changes, and pain monitoring in veterinary medicine. J Therm Biol 92: 102664.
- Leñero-Bardallo JA, Serrano C, Acha B, Pérez-Carrasco JA, Bernabeu-Wittel J (2021) Thermography for the differential diagnosis of vascular malformations. Clin Exp Dermatol 46.
- Damião CP, Montero JRG, Moran MBH, de Oliveira Marçal E Silva Carvalho ME, de Farias CG, et al. (2021) Application of thermography in the diagnostic investigation of thyroid nodules. Endocr J 68: 573-581. [Crossref]
- Modrzejewska A, Cieszyñski Ł, Zaborski D, Parafiniuk M (2021) Thermography in clinical ophthalmic oncology. Arq Bras Oftalmol 84: 22-30. [Crossref]
- Law J, Martin E, editors. Concise medical dictionary. Oxford University Press; 2020.
- Mouli P, Kumar SM, Senthil B, Parthiban S, Malarvizhi AE, et al. (2012) Application of thermography in dentistry-A review. J Dent Med Sci 1.
- Biagioni PA, Longmore RB, McGimpsey JC, Lamey PJ (1996) Infrared thermography. Its role in dental research with particular reference to craniomandibular disorders. Dentomaxillofac Radiol 25: 119-124. [Crossref]
- Bhat S, Saidath K, Castelino R, Shetty S, Babu S (2016) Dental Applications of Thermography. Arch Med Rev J 25: 84-96.
- Kasprzyk-Kucewicz T, Cholewka A, Bałamut K, Kownacki P, Kaszuba N, et al. (2021) The applications of infrared thermography in surgical removal of retained teeth effects assessment. J Therm Anal Calorim 144.
- Harder S, Egert C, Freitag-Wolf S, Mehl C, Kern M (2018) Intraosseous Temperature Changes During Implant Site Preparation: In Vitro Comparison of Thermocouples and Infrared Thermography. Int J Oral Maxillofac Implants 33: 72-78. [Crossref]
- Nejatian T, Almassi S, Shamsabadi A, Vasudeva G, Hancox Z, et al. (2019) Digital dentistry. In Advanced Dental Biomaterials 507-540.
- Thind SK, Gupta S, Kaur R, Sachdeva S, Bakshi A (2018) Digital dentistry: The future is now. IP Int J Periodontol Implantol 3: 4-11.
- Jahangiri L, Akiva G, Lakhia S, Turkyilmaz I (2020) Understanding the complexities of digital dentistry integration in high-volume dental institutions. Br Dent J 229: 166-168. [Crossref]
- Teledyne Flir. FLIR ONE® Pro-Series Thermal Imaging Cameras for iOS® or AndroidTM Smartphones. [https://www.flir.com/flir-one/]
- Patel S, Dawood A, Ford TP, Whaites E (2007) The potential applications of cone beam computed tomography in the management of endodontic problems. Int Endod J 40: 818-830. [Crossref]
- Teledyne FLIR. What is the difference between 'elevated skin temperature' and a fever? 2020, Jul 24. [https://www.flir.ca/discover/public-safety/what-is-the-difference-between-elevated-skin-temperature-and-a-fever/]
- O’Kelly E, Arora A, Pirog S, Ward J, Clarkson PJ (2021) Comparing the fit of N95, KN95, surgical, and cloth face masks and assessing the accuracy of fit checking. PLoS One 16: e0245688. [Crossref]
- Johnson LA (1992) Tools for technology assisted learning: teaching problem-solving skills with patient simulations. In Dental Informatics 1992: 215-248.
- Soffin CB, Morse DR, Seltzer S, Lapayowker MS (1983) Thermography and oral inflammatory conditions. Oral Surg Oral Med Oral Pathol 56: 256-262. [Crossref]
- Meljon A, Geisendorf M, Kamber S, Florian Fuchs F, Irastorza-Landa A (2021) EAO‐353/PO‐CI‐003 | Evaluation of heat generated by a new site preparation using low‐speed tools without irrigation. Clin Oral Implants Res 32: 111-111.


