A capillary electrophoresis (CE) coupling with chemiluminescence (CL) detection method for determining naproxen was developed based on the enhanced CL intensity of the luminol and K3Fe(CN)6] in alkaline solution. The separation was conducted in 30 mmol L-1 borate buffer at pH 10.0. Calibration curves were linear in the range of 10 to 2000 μg L−1, and the limit of detection (LOD) and limit of quantitation (LOQ) were 2.7 μg L−1 and 8.8 μg L−1, respectively. The proposed method was applied to detect naproxen in human urine sample with satisfactory assay results
Capillary electrophoresis; Chemiluminescence; Luminol; K3Fe(CN)6]; Naproxen
Naproxen (6-methoxy-α-methyl-2-naphthalene acetic acid) is a non-steroidal anti-inflammatory drug (NSAID) and was widely used to moderate pain relief in the treatment of many diseases [1,2]. Thus, NSAIDs can cause ulcers in the stomach and promote bleeding after an injury or surgery. Moreover, they are associated with other serious side effects, i.e. kidney failure, and with a number of minor side effects, such as nausea vomiting, diarrhea, constipation, decreased appetite, rash, dizziness, headache and drowsiness [3-5]. In addition, they also interact with other drugs; in particular, they reduce the action of diuretics and antagonize used to treat hypertension [6]. The development of a simple and sensitive method for the determination of naproxen in pharmaceuticals and biological fluids could be very useful for toxicological purposes.
Different analytical techniques including flow-injection chemiluminescence (FL-CL) [7], differential pulse voltammetry (DPV) [8], gas chromatography mass spectrometry (GC-MS) [9], and high-performance liquid chromatography (HPLC) with varied detection [10,11] have been employed for naproxen testing. However, GC-MS will often require chemical derivatization to improve the detecting sensitivity for naproxen analysis, HPLC method suffers from complicated system operation and maintenance, high consumption of samples and expensive reagents. FL-CL and DPV method can’t be applied for the determination of naproxen in complex biological samples because of the lack of separation ability.
Capillary electrophoresis (CE) has many advantages such as high separation efficiency, short run time, instrumentation simplicity, minimum operation cost, and compatibility with small sample volumes. It has been proven to be one of the most powerful techniques for analysis of biological samples [12-14]. Chemiluminescence (CL) detection has become an attractive detection scheme in CE because of its high sensitivity, low cost, low-power demands, and high compatibility with micromachining technologies [15,16]. Few reports have been used capillary electrophoresis with chemiluminescence detection (CE-CL) for separation and quantitation of naproxen.
In this research, a method for the determination of naproxen was developed by CE-CL based on the reaction between luminol and potassium ferricyanide (K3Fe(CN)6]) in alkaline solution. A series of parameters affecting the detection sensitivity were optimized, validation of the methodology was also investigated systematically. Fortunately, the results obtained concerning linearity, recovery, precision, and sensitivity were satisfactory. This method could be applied to the determination of naproxen in urine samples.
Chemical and reagents
Naproxen was obtained from the Institute of Pharmaceutical and Biomaterial Authentication of China (Beijing, China). Luminol was purchased from Sigma (St. Louis, MO, USA). Analytical reagent grade K3Fe(CN)6], sodium borate, and NaOH were purchased from Tianjin General Chemical Reagent Factory (Tianjin, China). Borate buffer ionic strength calculations were performed using the HP 3D CE Buffer Calculator version 1.00 (Hewlett-Packard corp., USA). Aqueous solutions of carrier electrolytes and of standards were prepared by using 18.2 MΩ*cm water from a Milli-Q water purification system (Millipore, Bedford, MA, USA) and were filtered through a 0.22 μm membrane before use.
CE–CL apparatus
The CE–CL system consisted of a high-voltage power supply (Beijing Cailu Science Instrument, Beijing, China) and a laboratory-made CL detector (Figure 1 for the schematic diagram of the system). Briefly, the polyimide coating of 1cm in length at one end of the separation capillary (50cm×75 mm, Yongnian Optical Fiber, Hebei, China) was removed. The bare end was inserted into a 530 mm i.d.reaction capillary (Yongnian Optical Fiber) to a depth of 1.5cm, where a a 1 cm detection window was formed on the reaction capillary by burning of the polyimide coating. A four- way Plexiglas joint was employed to hold the separation capillary, the reaction capillary and the two CL solution-delivering capillaries in place. To connect the most intensive CL signals, the detection window was situated just in front of the photoncounting photomultiplier tube (PMT). The whole CL detection system was enclosed within a black box.
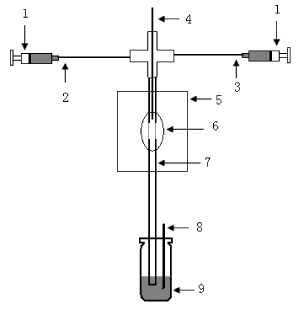
Figure 1. Schematic diagram of CL system: 1. pump; 2. luminol solution; 3. K3Fe(CN)6] solution; 4. separation capillary; 5. black box; 6. PMT; 7. reaction capillary; 8. grounding electrode; 9. waste vial.
Preparation of urine samples
Urine samples were collected from drug-free healthy volunteers. Aqueous standard solutions of naproxen were added into 2.0mL of urine samples and centrifuged at 4000 rpm for 10 min. The supernatant was transferred to a 2 ml vial for CE–CL analysis.
Analytical procedure
All new capillaries were rinsed sequentially with 0.1mol L-1 NaOH, 0.1mol L-1 HCl and water for 20min, and then equilibrated with the running buffer solution for 30 min. After each run, the separation capillary was treated with running buffer for 10 min. Electrokinetic injections were carried out at a voltage of 16 kV for 5 s, and a separation voltage of 16 kV was applied. Running buffer (30mmol L-1 borate buffer, pH10.0) was used. Reagent solutions of 0.2 mol L-1 NaOH containing 5×10⁻⁴ mol L-1 luminol as well as 0.2 mol L-1 NaOH containing 4×10⁻⁴ mol L-1 K3Fe(CN)6] were fed at a rate of 10 µL min−1 by a pump (LongerPump corp. Baoding, China) (Figure 1).
CL reaction between luminol and K3Fe(CN)6] in the presence of naproxen
It was found that naproxen could enhance the CL reaction between luminol and K3Fe(CN)6] (Figure 2). In order to optimize the reaction condition, some experimental factors, such as carrier flow, the flow rates, luminol concentration, and K3Fe(CN)6] concentration were investigated. In different experiment, a 100.0 µg L-1 of naproxen solution was injected into the CE–CL system, and the CL intensity of naproxen (peak area) was recorded.
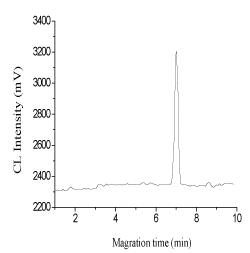
Figure 2. Electropherogram of a standard solution of FA naproxen at 100.0 μg L−1.
Because luminol reacts with K3Fe(CN)6] in alkaline condition producing CL, the effect of alkaline contained in the solution on the CL emission was initially examined. The CL emission intensity of 4×10⁻⁴ mol L-1 K3Fe(CN)6], 5×10⁻⁴-mol L-1 luminol system in the presence of NaOH, NaHCO3, Na2CO3 at the same concentration was detected. The results indicated that the strongest CL emission occurred in alkalinity medium containing NaOH, therefore a NaOH solution was selected as the reaction medium. Furthermore, the effect of NaOH concentration on the determination sensitivity of naproxen was studied by varying the concentration from 0.1 to 0.5 mol L-1. The results showed that CL intensity increased gradually with the increase of NaOH concentrations up to 0.2 M, where the maximum CL signal was reached. Further increasing of NaOH concentration resulted in a decrease in CL signal. Based on these results, a NaOH concentration of 0.2 mol L-1 was chosen for further studies.
The strongest CL response was obtained at flow rates of 10 µL min−1 for CL solutions. High-rate flow delivers more CL reagents to the reaction capillary and consequently promotes the luminescence reaction. But it boosts the undesired background that is responsible for the high baseline intensity, dilutes the sample and therefore reduces the CL signal of naproxen.
Keeping the K3Fe(CN)6] concentration at 4×10⁻⁴ mol L-1 and NaOH concentration at 0.2 mol L-1, the influence of luminol concentration on CL intensity was examined within the range of 1×10⁻⁴ -8×10⁻⁴ mol L-1 (shown in Figure 3). It is observed that the CL intensity was increased with increasing luminol concentration, and the CL intensity reached to the maximum at 5×10⁻⁴ mol L-1of luminol, when the concentration was greater than 5×10⁻⁴ mol L-1, the baseline became unstable and the signal to noise ratio decreased. Therefore, a 5×10⁻⁴ mol L-1 luminol solution was chosen as the optimum.
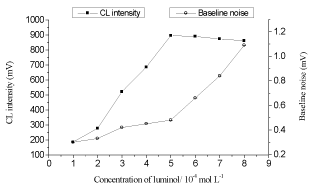
Figure 3. Relationships between luminol concentrations and CL responses.
obtained from a human urine sample (A) and the sample spiked with naproxen at 50.0 μg L−1 (B).
The effect of K3Fe(CN)6] concentration on CL signal was also investigated keeping the luminol concentration at 5×10⁻⁴ mol L-1 and NaOH concentration at 0.2 mol L-1. It was found that when the concentrations of K3Fe(CN)6] vary from 1×10⁻⁴-6×10⁻⁴ mol L-1, the CL signal is slightly increased; moreover, the curve of CL intensity became a flat above 4×10⁻⁴ mol L-1 K3Fe(CN)6] (Figure 4). Thus, a 4×10⁻⁴ mol L-1 K3Fe(CN)6] was selected for the following experiments.
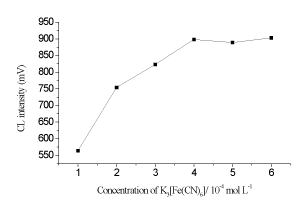
Figure 4. Relationships between K3Fe(CN)6] concentrations and CL responses.
Optimization of separation conditions
The background electrolyte concentration has a significant effect on the separation performance because it can influence the Joule heating, electro-osmotic flow, ionic strength, and the current produced in the capillary. The effect of borate buffer concentration in the range 10–50m mol L-1 at pH 10.0 was investigated. The results illustrated that the peak height was the biggest when the borate concentration was 30 mmol L-1, and migration time was increased with the increase of borate concentration. Thus, borate concentration was selected as 30 mmol L-1 for subsequent studies.
The pH value of buffer was one of the most important parameters affecting CE separation since it would change naproxen and interfering substances charge and mobilities. Therefore, the pH in borate buffer was investigated from pH 7.0 to 11.0 by experiment. The results showed migration time and peak height were increased with the increase of pH varing from 7.0 to 10.0 mmol L-1. When the pH was above 10.0, the peak height was decreased, and the migration time was prolonged, the baseline noise was increased as well. Consequently, pH 10.0 was chosen for the further optimization of buffer parameters.
The influence of the separation voltage on the migration time and the resolution of the naproxen was investigated by performing the electrophoresis with the applied voltages in the range 10–20 kV. As separation voltage increased, migration time was shortened, and peak height was increased, but the resolution was decreased. Into consideration, the separation voltage of 16 kV was selected for the experiment.
Method performance
The linearity was investigated by evaluation of the regression line and produced by the correlation coefficient. The curves were prepared by adding varying the concentrations of naproxen to human urine. The experimental results show that under the optimum conditions noted above, the peak areas were linear to the concentrations of naproxen in the range of 10 -2000 μg L−1. The correlation coefficient was 0.9994. The limit of detection (LOD, based on signal-to-noise ratio of 3, S/N = 3) and limit of quantitation (LOQ, S/N = 10) of the urine were 2.7 μg L−1 and 8.8 μg L−1, respectively.
Sample analysis
Following the procedure described above, the proposed method was applied to the analysis of naproxen in human urine. Different spiked concentrations in the urine (20.0, 50.0, 100.0 μg L−1) were adopted to examine the recovery and precision of the method (Table 1). The intra-day precision (%, RSD) in urine for naproxen at the low concentration level was 3.8%, at medium and high concentration levels were ≤2.8%. The average recoveries of different concentrations ranged from 96.0% to 103.4%. The inter-day recovery and precision were determined at the same three concentration levels over a period of 3 days (n=6). The inter-day precision (%, RSD) at the low concentration level was 5.5 %, at medium and high concentration levels ≤3.8%. The assay accuracy ranged from 94.0% to 97.8%. The results showed the method had good precision even at the low concentrations. Typical electropherograms obtained from naproxen-free and spiked human urine samples were shown in Figure 5.
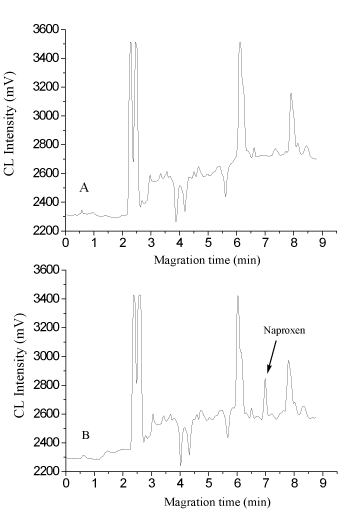
Figure 5. Electropherograms obtained from a human urine sample (A) and the sample spiked with naproxen at 50.0 μg L−1 (B).
Table 1. Determination of naproxen in human urine.
|
Added (μg L−1) |
Found (μg L−1) |
Recovery (%) |
RSD (%) |
Intra-day
(n = 6) |
20.0 |
19.2±0.7 |
96.0 |
3.8 |
50.0 |
48.3±1.2 |
96.6 |
2.5 |
100.0 |
103.4±2.9 |
103.4 |
2.8 |
Inter-day
(n = 6) |
20.0 |
18.8±1.0 |
94.0 |
5.5 |
50.0 |
48.9±1.7 |
97.8 |
3.4 |
100.0 |
95.3±3.6 |
95.3 |
3.8 |
In this paper, a CE–CL detection method was developed for the determination of naproxen. The high-separation efficiency of the CE technique and the high selectivity of the CL system towards the analytes enable the method to assay naproxen in real complex matrix. Method assessment for determination of naproxen in human urine showed good linearity, precision and accuracy. The developed CE–CL technique was less expensive, simple, and rapid, and did not require complex sample-pretreatment and generated minimal organic waste.
We acknowledge financial support from the Natural Science Foundation of Hebei Province (Nos. H2018206122).
- Hautaniemi T, Petrenko N, Skorinkin A, Giniatullin R (2012) The inhibitory action of the antimigraine nonsteroidal anti-inflammatory drug naproxen on P2X3 receptor-mediated responses in rat trigeminal neurons. Neuroscience 209: 32-38. [Crossref]
- Ortiz MI, González-García MP, Ponce-Monter HA, Castañeda-Hernández G, Aguilar-Robles P (2010) Synergistic effect of the interaction between naproxen and citral on inflammation in rats. Phytomedicine 18: 74-79. [Crossref]
- Goldstein JL, Huang B, Amer F, Christopoulos NG (2004) Ulcer recurrence in high-risk patients receiving nonsteroidalanti-inflammatory drugs plus low-dose aspirin: results of a post HOC subanalysis. Clin Ther 26: 1637-1643. [Crossref]
- Woessner KM, Castells M (2013) NSAID Single-Drug–Induced Reactions. Immunol Allergy Clin North Am 33: 237-249. [Crossref]
- Yokobori S, Yokota H, Yamamoto Y (2006) Pediatric Posterior Reversible Leukoencephalopathy Syndrome and NSAID-Induced Acute Tubular Interstitial Nephritis. Pediatr Neurol 34: 245-247. [Crossref]
- Sarafidis PA, Bakris GL (2008) Resistant Hypertension: An Overview of Evaluation and Treatment. J Am Coll Cardiol 52: 1749-1757. [Crossref]
- Wang LJ, Tang YH, Liu YH (2011) Flow injection chemiluminescence determination of loxoprofen and naproxen with the acidic permanganate-sulfite system. J Pharm Anal 1: 51-56. [Crossref]
- Adhoum N, Monser L, Toumi M, Boujlel K (2003) Determination of naproxen in pharmaceuticals by differential pulse voltammetry at a platinum electrode. Analytica Chimica Acta 495: 69-75.
- Sebők Á, Vasanits-Zsigrai A, Palkó G, Záray G, Molnár-Perl I (2008) Identification and quantification of ibuprofen, naproxen, ketoprofen and diclofenac present in waste-waters, as their trimethylsilyl derivatives, by gas chromatography mass spectrometry. Talanta 76: 642-650. [Crossref]
- Aresta A, Carbonara T, Palmisano F, Zambonin CG (2006) Profiling urinary metabolites of naproxen by liquid chromatography–electrospray mass spectrometry. J Pharm Biomed Anal 41: 1312-1316. [Crossref]
- Sun Y, Zhang Z, Xi Z, Shi Z (2009) Determination of naproxen in human urine by high-performance liquid chromatography with direct electrogenerated chemiluminescence detection. Talanta 79: 676-680. [Crossref]
- Wang Y, Wu Q, Cheng M, Cai C (2011) Determination of β-blockers in pharmaceutical and human urine by capillary electrophoresis with electrochemiluminescence detection and studies on the pharmacokinetics. J Chromatogr B Analyt Technol Biomed Life Sci 879: 871-877. [Crossref]
- De Rossi A, Desiderio C (2006) High sensitivity analysis of oxprenolol in urine by capillary electrophoresis with C18 packed on-line preconcentrator. J Chromatogr B Analyt Technol Biomed Life Sci 839: 6-11. [Crossref]
- Chankvetadze B (2018) Contemporary theory of enantioseparations in capillary electrophoresis. J Chromatogr A 1567: 2-25. [Crossref]
- Li T, Wang Z, Xie H, Fu Z (2012) Highly sensitive trivalent copper chelate-luminol chemiluminescence system for capillary electrophoresis detection of epinephrine in the urine of smoker. J Chromatogr B Analyt Technol Biomed Life Sci 911: 1-5. [Crossref]
- Jorgensen AM, Mogensen KB, Kutter JP, Geschke O (2003) A biochemical microdevice with an integrated chemiluminescence detector. Sensors and Actuators B: Chemical 90: 15-21.


