Objective: In this study, we demonstrate the derivation of a de-identified research database from the electronic health records (EHR) and then use it in determining the prognostic value of biomarkers lactate, C-reactive protein (CRP), and procalcitonin in hospitalized patients.
Methods: The database was created through a series of data export, transform, load, and visualization. A database glossary was completed, including 650 data elements per patient encounter without personal identifiers. Data visualization and statistical analysis tools were provided to those utilizing the database.
Results: From July 2012 to August 2019, the database contained 240,759 distinct hospital encounters, with 2,682 patients meeting criteria for analysis, age 54.5±18.6 years, lactate 1.9±1.7 mmol/L, CRP 10.7±10.0 µg/mL, procalcitonin 4.0±17.5 ng/mL, and mortality 8.7%. ROC area under the curve for lactate, CRP, and procalcitonin was 0.670, 0.553, and 0.672, respectively. Lactate, CRP, and procalcitonin had odds ratio for mortality of 1.111 (1.037-1.190), 1.015 (0.991-1.031), and 0.999 (0.991-1.007), respectively.
Conclusions: Our efforts provide a framework for creating EHR-derived de-identified patient data for clinical research. Our analysis of the prognostic value of lactate, CRP, and procalcitonin showed these biomarkers to be less accurate than expected, highlighting the challenges of using existing data.
clinical research database, electronic health records, lactate, c-reactive protein, procalcitonin
Data collection for clinical research purposes has often been an arduous, time-consuming and expensive process. Randomized controlled trials (RCT) have long been viewed as the gold-standard of research and often provided us with valuable information in the practice of evidence-based medicine [1]. While their utility cannot be understated, the cost of performing an RCT is often prohibitive for all but those with large sources of funding, either private or public. A previous systematic review estimated that the average cost of a randomized controlled trial ranged from $43 to $103,254 per patient [2]. While this definitive research paradigm continues to be upheld, the advancement of our medical knowledge could be vastly improved by exploring existing data available from routine patient care.
In the United States, electronic health records (EHR) have become almost universal since the Health Information Technology for Economic and Clinical Health Act (HITECH)was passed to promote adoption of EHR and their meaningful use [3,4]. As of 2015, an estimated 81% of hospitals have adopted EHR since HITECH was passed in 2009 and that number has likely increased [5]. EHR are used in the delivery of virtually every aspect of patient care and have improved outcomes in multiple clinical domains, such as diabetes and cancer treatments [6,7]. Given the ubiquity and amount of information available through EHR, there is treasure trove of data available for research purposes if we can gather and analyze this information in a systematic manner.
In recent years, there have been efforts to extract data through EHR systems, such as EPIC (Epic Systems Corporation, Verona, WI), which are estimated to contain over 32,000 discrete data elements per patient [8,9]. Most recently, Epic announced plans for Cosmos (Epic Systems Corporation, Verona, WI), a large-scale collaborative research database pooling EPIC EHR data from multiple institutions [10]. The timeframe for the widespread availability of Cosmos for clinical research and data mining is to be determined. However, more than 200 million patient records from healthcare organizations nationwide could eventually comprise the database, taking big data research to new heights.
Our organization at Loma Linda University Health (LLUH) began adopting EPIC since July 2012. At present, our EHR consists of nearly 2 million unique patient records. Thus, we saw a great opportunity to capture this data for clinical research, while awaiting larger multicenter databases such as Cosmos. In this study, we present our experience in deriving a patient de-identified database from our single-center EPIC EHR for the sole purpose of clinical research. After database creation, we then completed statistical analyses to compare the prognostic value of three common biomarkers in predicting mortality in hospitalized patients: lactate, C-reactive protein (CRP), and procalcitonin. These biomarkers have been shown in numerous studies to be useful in prognosticating outcome in critically ill patients [11-17]. Using our derived database, our objective was to examine the accuracy of these biomarkers applied to our own patient population. In doing so, we explored the successes and challenges of using existing data to answer relevant clinical questions, and to provide a framework for performing future research on EHR-derived data.
Challenges in clinical research and rationale for a self-service database
The EHR-derived database was created out of the need to efficiently perform clinical research from our own readily available patient data. Investigators and researchers at our institution had experienced challenges obtaining de-identified data from our EHR (LLEAP - Loma Linda Electronic Access Portal, which is our institution’s implementation of the EPIC EHR) in a timely fashion for preparatory research analysis, grant applications, and other funding opportunities. While reporting tools available in the EPIC system, such as Reporting Workbench and Slicer Dicer, are useful for obtaining clinical data from the EHR, we found that they did not provide the flexibility or desired dataset researchers required. When these self-service tools did not yield the required data, the investigators had to submit a data request through our Information Technology Service Desk. In addition, they had to specify the data elements from single datasets without the ability to cross reference across multiple datasets. Data extraction became cumbersome as service requests could take several months depending on the request and institution-wide demands. These challenges ultimately led to missed opportunities for grant funding, failure of numerous projects, and discouraged clinical research endeavors amongst investigators.
Pilot dataset
Our goal was to have the EHR-derived database embraced as an institution-wide solution for clinical research examining existing patient data at LLUH. The initial effort for a pilot dataset creation came from a multi-center data project with Duke University known as the “Pediatric Trials Network Database”. The Network Database was funded by The Eunice Kennedy Shriver National Institute of Child Health and Human Development (NICHD) with Duke University Medical Center serving as the coordinating center [18,19]. This initial project resulted in a limited dataset rather than a completely de-identified database. Thus, ethics approval by the Institutional Review Board (IRB) was required to obtain the required data elements from patient encounters at our Children’s Hospital.
Gaining institution support
Based on our experience with the limited dataset we contributed to the Pediatric Trials Network, we obtained institutional approval to develop a completely de-identified database. It would be available to any investigator in our organization for the purpose of clinical research. A taskforce was created, led by the Director for the Clinical Trials Center (LD, co-author of this manuscript), and included physician champions, data analytics expertise, technical support staff, and the Chief Medical Information Officer (FC, co-author of this manuscript). Meetings were held regularly to define the database content, tools used to extract and analyze data, and potential research ideas to serve as initial projects.
Accessing the database for clinical research
Any investigator at our institution can access the database for the purpose of clinical research, with “Exempt” status from IRB review. This activity was determined by the IRB as not meeting the criteria for human research, since the data were de-identified. We chose Tableau (Tableau Software, Seattle, WA) and Statistical Package for Social Sciences (SPSS) version 25.0 (IBM, Armonk, NY) as the user-interfaces to the database for data visualization and statistical analysis, respectively. To facilitate access to these tools by our investigators, we developed a user’s guide with specific instructions on how 1) to install the tools on their desktop computer and 2) to connect to the database. Online courses were referenced for users to independently learn Tableau and SPSS as needed, https://www.udemy.com/course/tableau10-advanced/ and https://www.udemy.com/course/spss-statistics-foundation-course-from-scratch-to-advanced/. The database glossary (or data dictionary) was also provided in the user’s guide.
Database analysis of biomarkers in hospitalized patients
For the purpose of determining the prognostic value of lactate, CRP and procalcitonin in hospitalized patients derived from the database, we used SPSS as the primary statistical analysis tool. Unique hospital encounters with at least one lactate, CRP and procalcitonin measured in patients 18 years or older were included in the analysis. Data collected included patient demographics, vital signs, laboratories (including lactate, CRP, and procalcitonin), vasopressor use, ventilator use, and hospital length of stay.
Univariate analysis of variance was used to compare survivors and non-survivors. Binomial logistic regression was used to model the effects of relevant clinical variables on the mortality outcome. Receiver operating characteristics (ROC) curves were generated to compare the accuracy of lactate, CRP and procalcitonin in predicting mortality. Statistical significance was determined with p-value < 0.05.
EHR-derived de-identified database
The de-identified database was a large subset of data extracted from our LLEAP application (Figure 1). The data was transferred from the LLEAP Chronicles clinical data store (i.e. the EHR) to Clarity, a Microsoft SQL Server database (Microsoft Corporation, Redmond, WA) comprised of over 18,000 data tables, through a process called ETL (Export, Transform, and Load). From there the data was imported into a data warehouse known as Caboodle, which was also a Microsoft SQL Server database comprised of approximately 5,000 data tables. The final step involved de-identifying the data through a tool called Tibco® Data Virtualization (TIBCO Software Inc., Palo Alto, CA), after which the data was cached to SAP HANA® (SAP SE, Walldorf, Baden-Württemberg, Germany) in-memory database to enable fast data profiling and retrieval. The final de-identified database was updated weekly through this process.
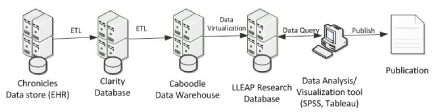
Figure 1. Creation of electronic health record derived de-identified database for clinical research
A database glossary was created describing the data elements available for analysis (Table 1). Each patient was identified with a unique patient identifier (ID), and each patient’s presentation to our institution was identified through a unique encounter ID. There are 650 data elements per patient encounter. However, no patient information in the database could be linked to personal identifiers: name, addresses, dates (except year) directly related to the patient, ages over 89, telephone numbers, fax numbers, electronic mail addresses, social security number, medical record numbers, health plan policy numbers, account numbers, certificate/license numbers, vehicle identifiers and license plate numbers, device identifiers and serial numbers, web addresses (URLs), internet IP addresses, biometric identifiers including finger and voice prints, full face photographic images and any comparable images, and any other unique identifying number, characteristic or code.
Table 1. Database glossary of data elements. ICD – International Classification of Diseases; ECG – Electrocardiogram; CT – Computed Tomography; ID – Identifier; CPT – Currrent Procedural Terminology; BMI – Body Mass Index
Category |
Data Element |
Allergies |
allergen name, allergen type, severity and reaction for individual patients and encounters |
Billing Diagnosis and Procedure Codes |
billing procedure name, procedure code, anesthesia type, code quantity, risk of mortality and severity of illness prior to procedure for individual patients and encounters |
Chief Complaint and Diagnoses |
chief complaint and diagnoses, billing diagnosis name and ICD-9/10 codes, prior medical history ICD-9/10 codes, and hospital problem list with ICD-9/10 codes for individual patients and encounters |
Emergency Department Visit |
time of arrival, time of departure, ECG data, need for trauma activation, need for thrombolytics, need for sedation, need for CT scan, need for psych consult, need for isolation, level of care, level of acuity, encounter ID for hospital admission if needed |
Hospital Stay Aggregate Data |
inpatient admission time, patient severity of illness, risk of mortality, inpatient length of stay, mortality during admission, insurance coverage, principal hospital diagnosis, discharge diagnosis |
Hospital Labs |
all labs obtained at the time of admission as well as throughout the duration of the hospital stay linked to a unique hospital encounter ID |
Immunization Information |
immunization name and time of administration linked to a unique patient ID |
Medication Order and Administration Times |
medicine therapeutic and pharmaceutic class, generic product identifier, medication dose, time of order, time of administration, order source |
Patient Demographics |
age, sex, religion, smoking status, financial class, ethnicity (if available), and highest level of education (if available) |
Procedure/Surgery Order |
procedure order, procedure name, CPT code, order date linked to patient ID and encounter ID |
Outpatient Visit |
encounter type based on billing code, appointment length, minutes to rooming, vital signs (blood pressure, pulse, respirations, weight, BMI |
Vital Sign Data |
vital sign data for some hospital encounters (incomplete dataset not available for all encounters) |
Prognostic value of lactate, CRP and procalcitonin
From July 2012 to August 2019, the database contained 240,759 distinct hospital encounters (admissions). For our analysis determining the prognostic value of biomarkers, 2,682 patient encounters met the inclusion criteria with age 54.5 ± 18.6 years (Figure 2). Patient characteristics of the study population are further illustrated in Table 2 with lactate 1.9 ± 1.7 mmol/L, CRP 10.7 ± 10.0 µg/mL, procalcitonin 4.0 ± 17.5 ng/mL, and in-hospital mortality of 8.7%. Univariate comparisons showed statistically significant differences between survivors and non-survivors in age, gender, lactate, CRP, procalcitonin, white blood cell count, platelet, international normalized ratio, creatinine, total bilirubin, albumin, bicarbonate, glucose, ventilator use, vasopressor use, and hospital length of stay. The most common diagnoses by International Classification of Diseases (ICD)-10 code for hospital admission were: unspecified osteomyelitis (M86.9) accounting for 0.9% of total admissions, necrotizing fasciitis (M72.6) accounting for 0.7%, and bacteremia (R78.81) accounting for 0.7%.
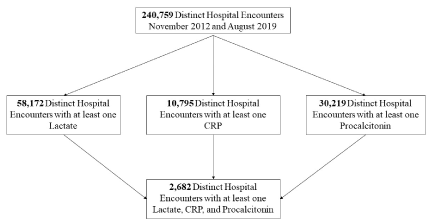
Figure 2. Analysis flow diagram. CRP – C-reactive protein
Table 2. Patient Characteristics. INR – International normalized ratio. Data are presented as either count (%) or mean ± standard deviation. *n denotes the number of cases of survivors/non-survivors available in the database when data are incomplete
|
All Patients
N=2,682 |
Survivors
N=2,450 |
Non-Survivors
N=232 |
p-value |
Age (years) |
54.5 ± 18.6 |
53.8 ± 18.5 |
62.6 ± 17.6 |
<0.001 |
Female/Male, no (%) |
1237 (46.1)/1445 (53.9) |
1118 (45.6)/1332 (54.4) |
119 (51.3)/113 (48.7) |
<0.001 |
Initial Vital Signs |
|
|
|
|
Temperature, oF
(n=197/4)* |
98.3 ± 0.7 |
98.2 ± 0.7 |
98.7 ± 0.6 |
0.185 |
Heart rate, per min
(n=197/4)* |
87 ± 15 |
87 ± 15 |
80 ± 8 |
0.155 |
Respirations, per min
(n=197/4)* |
19 ± 4 |
19 ± 4 |
19± 6 |
0.909 |
Oxygen saturation, %
(n=197/4)* |
97 ± 2 |
97 ± 2 |
98 ± 4 |
0.852 |
Initial Laboratories |
|
|
|
|
Lactate, mmol/L |
1.9 ± 1.7 |
1.8 ± 1.5 |
3.1 ± 3.0 |
<0.001 |
C-reactive protein, μg/mL |
10.7 ± 10.0 |
10.6 ± 9.9 |
12.2 ± 10.9 |
0.015 |
Procalcitonin, ng/mL |
4.0 ± 17.5 |
3.6 ± 16.4 |
8.4 ± 26.3 |
<0.001 |
White blood cell, per mm3
(n=2449/232)* |
13.3 ±13.9 |
12.9 ± 12.1 |
17.2 ± 25.8 |
<0.001 |
Platelet, per mm3
(n=2445/231)* |
267 ± 147 |
271± 147 |
218 ± 130 |
<0.001 |
INR
(n=1836/216)* |
1.3 ± 0.6 |
1.2 ± 0.6 |
1.5 ± 1.1 |
<0.001 |
Creatinine, mg/dL
(n=2443/231)* |
1.7 ± 2.0 |
1.7 ± 2.0 |
1.9 ± 1.9 |
0.069 |
Total bilirubin, mg/dL
(n=2391/231)* |
1.0 ± 2.8 |
0.9 ± 2.4 |
1.8 ± 5.3 |
<0.001 |
Albumin, g/dL
(n=2397/231)* |
3.2 ± 0.7 |
3.3 ± 0.7 |
2.8 ± 0.8 |
<0.001 |
Bicarbonate, mEq/L
(n=1197/224)* |
21.2 ± 5.5 |
22.1 ± 5.4 |
20.5 ± 5.9 |
<0.001 |
Glucose, mg/dL
(n=2134/210)* |
148 ± 88 |
150 ± 90 |
135 ± 64 |
0.002 |
Ventilator Use, no (%) |
695 (25.9) |
510 (20.8) |
185 (79.7) |
<0.001 |
Vasopressor Use (no, %) |
483 (18.0) |
311 (12.7) |
172 (74.1) |
<0.001 |
Hospital Length of Stay (days) (n=2358/232)* |
13.8 ± 20.1 |
13.6 ± 21.1 |
16.5 ± 15.1 |
0.007 |
Receiver operating characteristics analysis showed area under the curve (AUC) of 0.670, 0.553, 0.672; and inflection points of 1.7 mmol/L, 8.0 mg/L, and 0.3 ng/mL for lactate, CRP, and procalcitonin, respectively (Figure 3). The time of biomarker measurement varied significantly. From a random sample of 100 patients, lactate, CRP, and procalcitonin were measured at 86±90, 113±199, and 199±221 hours after hospital presentation (Figure 4).
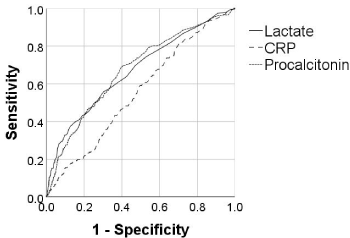
Figure 3. Receiver operating characteristics curves with lactate, C-reactive protein (CRP), and procalcitonin vs. mortality. Area under the curve was 0.670, 0.553, and 0.672, respectively. The inflection point (cutoff value with the highest accuracy for predicting mortality) was 1.7 mmol/L, 8.0 mg/L, and 0.3 ng/mL, respectively
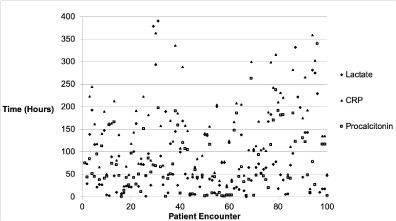
Figure 4. Lactate, C-reactive protein (CRP), and procalcitonin initial measurement time from hospital presentation for 100 randomly selected patient encounters. Measurement time was 86 ± 90, 113 ± 199, and 199 ± 221 hours, respectively
Binomial logistic regression modeling was performed to determine predictors of in-hospital mortality (Table 3). Lactate, CRP, and procalcitonin had odds ratio for mortality of 1.111 (1.037-1.190), 1.015 (0.991-1.031), and 0.999 (0.991-1.007), respectively.
Table 3. Binomial logistic regression models for mortality including patients with lactate, C-reactive protein (CRP), and procalcitonin measurements. INR – International normalized ratio. 95% confidence interval with lower and upper limits for odds ratio are denoted
Variable |
Odds Ratio
N=2,682 |
Age |
1.034 (1.024-1.044) |
Gender (Male) |
0.730 (0.526-1.013) |
Lactate |
1.111 (1.037-1.190) |
C-reactive protein |
1.015 (0.991-1.031) |
Procalcitonin |
0.999 (0.991-1.007) |
White blood cell |
1.009 (1.002-1.009) |
Platelet |
0.998 (0.997-1.000) |
INR |
1.157 (0.940-1.423) |
Creatinine |
1.002 (0.919-1.092) |
Total bilirubin |
1.014 (0.979-1.054) |
Albumin |
0.685 (0.547-0.857) |
Bicarbonate |
0.979 (0.947-1.012) |
Glucose |
0.998 (0.995-1.000) |
Ventilator use |
4.597 (3.018-7.004) |
Vasopressor use |
6.049 (4.066-8.999) |
In this study we have shown thsat deriving a patient de-identified database for the purpose of clinical research is feasible with institutional-wide support. We completed a first analysis of the database to determine the accuracy of several common biomarkers in predicting mortality in hospitalized patients.
In the logistic regression model, we confirmed a significant association between lactate and mortality with odds ratio and 95% confidence interval greater than 1.0. The ROC curve for lactate showed an inflection point of 1.7 mmol/L correlating with values in previous studies that reported normal values below 1.4 and 2.3 mmol/L [12,14,18-20]. Above such a lactate cutoff value, mortality increases. The odds ratios for mortality for CRP and procalcitonin were not significant, with 95% confidence interval including 1.0. While associated with mortality in certain settings, CRP is often elevated in those with heart disease or inflammatory disease making it nonspecific as a prognostic marker [13]. Procalcitonin has been shown to be useful in guiding antibiotic therapy in sepsis with high negative predictive value for procalcitonin <0.2 ng/mL [21-23]. The non-specificity of CRP in predicting mortality and the more specific use procalcitonin for predicting efficacy of antibiotic use likely explain the lack of significant odds ratios for these markers.
The ability to use EHR-derived data at our institution represents a paradigm shift in performing clinical research. The traditional process of submitting a data request to our Information Technology Service Desk, waiting for results to perform preparatory analysis such as sample size calculation, submitting a proposal to the IRB, and waiting for approval to perform complete data abstraction from the medical records is eliminated. The availability of the patient de-identified database would result in a time saving of several months to a year or more. In an academic setting that includes trainees (i.e. medical students, residents, and fellows), such resource will result in a sea change of research productivity. Projects can now be completed timely within 1-2 years of a trainee’s education. Analyses from the database may then serve as hypothesis generating research for further testing by more senior investigators.
There has been a growing amount of data repositories within individual healthcare systems since the adoption of EHR in the United States due to financial incentives from HITECH [24]. These databases have been created and used in disciplines like pharmacology and genomics [9,25]. Big data is also being used in other areas of healthcare especially in electronic healthcare system improvement and preventative health [26]. In our study, we have shown that implementation of a dataset based on the existing local institutional EHR may tremendously facilitate clinical research.
Creation of an EHR-derived database does require an initial investment of time and resources. A robust data analytics department is required to extract data, convert it to a useable format, and maintain the database with regular update of prospective data. Physician champions knowledgeable in clinical research are engaged to provide input on the contents of the database. The end-user investigators including trainees are encouraged to learn and perform their own statistical analyses of the database instead of navigating the IRB approval process. Once created, anyone within our institution including non-clinicians can have access to the database.
Analyzing existing data is not without limitations. A previous study examined 348,367 emergency department patient visits in the National Hospital Ambulatory Medical Care Survey (NHAMCS) database over 10 years that resulted in intubation. Out of 875 patients having intubation performed, 27% was inaccurately recorded as being discharged home or admitted to a non-critical care unit [27]. While we do not know the accuracy of data recorded in the EHR, we intuitively accept that such retrospective data may not be entirely accurate. Second, controlling the timing of laboratory measurements for the purpose of clinical diagnosis or prognosis is not possible when analyzing existing data. In our study, lactate, CRP and procalcitonin should be ideally measured at the earliest time point after patient presentation to the hospital. However, there were significant variations in the time-to-lab-draw of these biomarkers, from hours to days, which inevitably affected their prognostic accuracy for mortality. As a result, the ROC AUC’s in our study were much lower than those reported in previous studies [28-30]. Finally, the use of International Classification of Diseases (ICD) codes to identify patients in any existing dataset poses a challenge when determining the most common presenting diagnoses. As such our top three most frequent ICD-10 codes accounted for less than 3% of the total study population.
In summary, our project provides a framework for creating EHR-derived de-identified patient data and using it to perform clinical research, but also highlights the challenges of using this data with a high degree of reliability. The large amount of data includes missing values and is difficult to sift through individually for inaccuracies or inconsistencies.
EHR systems have become widespread use in the majority of the acute care hospitals [5]. Efforts are underway to standardize the collection and warehousing of clinical data through HIMSS (Healthcare Information and Management Systems Society) as organizations continue to improve the functionality of their EHR systems [31]. As the EHR continues to evolve, we hope that the process described in this study will allow for easy data extraction and analysis, translating real-world data to answer relevant clinical questions.
- Hariton E, Locascio JJ (2018) Randomised controlled trials - the gold standard for effectiveness research: Study design: randomised controlled trials. BJOG 25: 1716. [Crossref]
- Speich B, Von Niederhausern B, Schur N (2018) Systematic review on costs and resource use of randomized clinical trials shows a lack of transparent and comprehensive data. J Clin Epidemiol 96: 1-11.
- Adler-Milstein J, DesRoches CM, Kralovec P (2015) Electronic health record adoption in us hospitals: progress continues, but challenges persist. Health Aff (Millwood) 34: 2174-2180. [Crossref]
- Blumenthal D (2010) Launching HITECH. N Engl J Med 362: 382-385.
- Adler-Milstein J, Holmgren AJ, Kralovec P, Worzala C, Searcy T, et al. (2017) (Electronic health record adoption in US hospitals: the emergence of a digital "advanced use" divide. J Am Med Inform Assoc 24: 1142-1148.
- Jensen RE, Snyder CF, Abernethy AP (2014) Review of electronic patient-reported outcomes systems used in cancer clinical care. J Oncol Pract 10: e215-22.
- Reed M, Huang J, Graetz I (2012) Outpatient electronic health records and the clinical care and outcomes of patients with diabetes mellitus. Ann Intern Med 157: 482-489. [Crossref]
- Milinovich A, Kattan MW (2018) Extracting and utilizing electronic health data from Epic for research. Ann Transl Med 6: 42.
- Wei WQ, Denny JC (2015) Extracting research-quality phenotypes from electronic health records to support precision medicine. Genome Med 7: 41.
- Drees J (2019) Epic unveils patient data research initiative, new software. Becker's Health IT & CIO Report, August 29, 2019.
- Bou Chebl R, El Khuri C, Shami A (2017) Serum lactate is an independent predictor of hospital mortality in critically ill patients in the emergency department: a retrospective study. Scand J Trauma Resusc Emerg Med 25: 69.
- Dundar ZD, Kocak S, Girisgin AS (2019) Lactate and NEWS-L are fair predictors of mortality in critically ill geriatric emergency department patients. Am J Emerg Med. 2019. [Crossref]
- Marsik C, Kazemi-Shirazi L, Schickbauer T (2008) C-reactive protein and all-cause mortality in a large hospital-based cohort. Clin Chem 54: 343-549.
- Nichol AD, Egi M, Pettila V (2010) Relative hyperlactatemia and hospital mortality in critically ill patients: a retrospective multi-centre study. Crit Care 14: R25.
- Schuetz P, Birkhahn R, Sherwin R (2017) Serial procalcitonin predicts mortality in severe sepsis patients: results from the multicenter procalcitonin monitoring sepsis (MOSES) study. Crit Care Med 45: 781-789. [Crossref]
- Schuetz P, Wirz Y, Sager R (2018) Effect of procalcitonin-guided antibiotic treatment on mortality in acute respiratory infections: a patient level meta-analysis. Lancet Infect Dis18: 95-107.
- Zacho J, Tybjaerg-Hansen A, Nordestgaard BG (2010) C-reactive protein and all-cause mortality--the Copenhagen City Heart Study. Eur Heart J 31: 1624-1632.
- Pediatric Trials Network. National Institute of Child Health and Human Development (NICHD). National Institute of Child Health and Human Development (NICHD).
- Hornik CP, Atz AM, Bendel C (2019) Creation of a Multicenter Pediatric Inpatient Data Repository Derived from Electronic Health Records. Appl Clin Inform 10: 307-315.
- Wacharasint P, Nakada TA, Boyd JH, Russell JA, Walley KR, et al. (2012) Normal-range blood lactate concentration in septic shock is prognostic and predictive. Shock 38: 4-10. [Crossref]
- Castelli GP, Pognani C, Meisner M, Stuani A, Bellomi D, et al. (2004) Procalcitonin and C-reactive protein during systemic inflammatory response syndrome, sepsis and organ dysfunction. Crit Care. 8: R234-R242.
- Clec'h C, Ferriere F, Karoubi P (2004) Diagnostic and prognostic value of procalcitonin in patients with septic shock. Crit Care Med 32: 1166-1169.
- Meisner M (2014) Update on procalcitonin measurements. Ann Lab Med 34: 263-273.
- Marcotte L, Seidman J, Trudel K (2012) Achieving meaningful use of health information technology: a guide for physicians to the EHR incentive programs. Arch Intern Med 172: 731-736.
- Tate AR, Beloff N, Al-Radwan B (2014) Exploiting the potential of large databases of electronic health records for research using rapid search algorithms and an intuitive query interface. J Am Med Inform Assoc 21: 292-298.
- El Aboudi N, Benhlima L (2018) Big Data Management for Healthcare Systems: Architecture, Requirements, and Implementation. Adv Bioinformatics 2018: 4059018.
- Green SM (2013) Congruence of disposition after emergency department intubation in the National Hospital Ambulatory Medical Care Survey. Ann Emerg Med 61: 423-6e8. [Crossref]
- Filho RR, Rocha LL, Correa TD, Pessoa CM, Colombo G, et al. (2016) Blood Lactate Levels Cutoff and Mortality Prediction in Sepsis-Time for a Reappraisal? a Retrospective Cohort Study. Shock 46: 480-485.
- Povoa P, Coelho L, Almeida E (2005) C-reactive protein as a marker of infection in critically ill patients. Clin Microbiol Infect 11: 101-108.
- Sager R, Wirz Y, Amin D (2017) Are admission procalcitonin levels universal mortality predictors across different medical emergency patient populations? Results from the multi-national, prospective, observational TRIAGE study. Clin Chem Lab Med 55: 1873-1880. [Crossref]
- EMRAM: A strategic roadmap for effective EMR adoption and maturity. Healthcare Information and Management Systems Society.