Abstract
Keeping in view the growing concern regarding polymer degradation, the present study was undertaken with the view to study the effect of UV irradiation on degradation of used polystyrene. Polystyrene was collected from TV and computer packing. It was peeled into pieces and dissolved in toluene. The viscosity measurement was made according to the well reported standard method. The polystyrene sample was irradiated with UV irradiations having wavelength range of 365 nm. The irradiated polystyrene samples were accordingly dissolved in toluene. The viscosity measurements were made to calculate molecular weight. The number of chain sessions per polymer was also calculated. It was observed from the compiled results that UV irradiation has profound effect on the reduction of molecular weight of polystyrene samples. The reduction in the molecular weight indicated the degradation of polystyrene macro molecules by irradiating with UV radiations. It was also observed that the number of chain sessions per polymer was increased by increasing irradiation time. The study will be very helpful for degradation of polymeric materials being dumped into the environment particularly in landfills.
Key words
reduced viscosity, degradation, used polystyrene, UV irradiation, chain sessions
Introduction
Three kinds of universal plastics are used widely in our daily life including Polystyrene (PS), poly-(vinyl chloride) (PVC) and polyethylene (PE). Each year, a huge amount of waste plastics is discarded, which causes serious environmental problems. The recycling of such waste plastics may not be economically viable [1]. In Western Europe, 6-10% of municipal solid waste is composed of plastics. More than 72% of these waste plastics are disposed of by landfill, whereas the remaining part is incinerated or recycled in different ways [2]. The incineration of these plastics produces strong volatile carcinogenic dioxins into the atmosphere, which is present in most dust particulates and municipal refuse, causing an environmental issue of major concern [3,4]. In the vicinity of such small municipal facilities, ground contamination and air pollution have become an environmental issue that should be addressed properly.
Serious negative impacts have been reported due to polystyrene on workers producing it. A study was conducted by the Foundation for Advancements in Science and Education, where styrene, a monomer of polystyrene was found to leaches into food using polystyrene food wares. Styrene has been found in human tissue samples and also human nursing milk samples tested. Styrene has been found to be a proven carcinogenic and neurotoxin, and it has also been linked to reproductive problems [5]. Long term styrene exposure can cause damage to the central nervous system, chromosomal damage, liver damage, effects on kidney function, occupational asthma, impaired hearing, altered color vision, and reproductive effects [6]. According to Kolstad et al. [7] more than 3000 deaths were reported and more than 1000 newly diagnosed cases with solid cancer have been found in workers working in the Danish reinforced plastic industry.
Many researchers conducted relative studies on thermal degradation of polystyrene [8-11]. But for the disposal of such waste plastics, the photo-catalytic degradative method seems to be more feasible because it doesn’t generate any dioxins and the technique operates at ambient temperature with multiple economic advantages. However, its technological application on large industrial scale seems limited by several factors including the need for an ultraviolet (UV) excitation source. Only about 3-5% of the solar beam is in the UV range that can reach the earth. For developing the future generation of the photo degradation of plastics , the efficient use of solar light, or other light from the visible region of the continuous spectrum, can be an appealing challenge [12].
A polymer can be characterized by a number of techniques prior to processing, like viscometery, light scattering, osmometery, diffusion and sedimentation etc, but the former two methods are mostly used due to their simplicity and absolute measurements respectively.
Viscometery is rather simpler and faster method for determining molecular weight of polymer. It also furnishes valuable information about the size, shape and unperturbed dimension as well as the quality of solvent for a particular polymer solvent system. Therefore, for particular polymer system the intrinsic viscosity appears to be a unique function of molecular weight at given temperature, expressed in the form a simple power function known as Mark-Houwink (MH) equation [13].
[η] = k Mα
The equation contains two empirical constants, “k” and “α”, which depend on the properties of solute and solvent molecules and also on their mutual interaction.
The viscosity measurement of polystyrene in a wide variety under different condition were conducted by a number of scientists, and observed the intrinsic viscosity of a series of polymer sample increases with molecular weight giving straight line for the Mark-Houwink equation [14]. This behavior is also followed even by the polystyrene samples of very high molecular weight observed by Einaga et al. for polystyrene in benzene up to 6 × 10⁷ and by Meyerhoof and Appelt for polystyrene in toluene up to 4 × 10⁷ g/mol. The exponent of MH equation for various polystyrene good solvent systems lies between 0.62 to 0.788. The average molecular weight can be evaluated from viscosity measurements, if the MH parameters are already known for particular polymer-solvent system at specified temperature. These parameters have been determined for various polystyrene systems at 298 and 303 k [15].
Experimental
Sample preparation
In this study used polystyrene, obtained from TV and computer packaging, was used. The sample, in the form of clear granular solid was used without further treatment.
Solvent
Toluene was used as a solvent, obtained from E. Merck of Germany. The solvent was of analytical grade and was used without further purification.
Solution
Dilute solutions with concentrations 0.1, 0.2, 0.3, 0.4, and 0.5 g/dL were prepared by adding solvent to the pre-weighed polymer sample in a volumetric flask at room temperature with occasional gentle swirling.
Temperature
The temperature of polymer solution was kept at 25 ± 1ºC in thermostatic bath, which was maintained at 25ºC.
Viscosity Measurements
Viscometer
Ostwald‟s viscometer was used for viscosity measurement of dilute solutions of polystyrene in toluene. Extensive care was taken for adjustment of the capillary position along vertical direction and proper temperature control of the system.
Viscosity of Dilute Solution
The viscosity of dilute solution systems having 0.1, 0.2, 0.3, 0.4, and 0.5 % concentration was measured using calibrated Ostwald viscometer. Flow time of pure solvent as well as polymer solution systems were noted at 25ºC temperature, flow time was noted at triplicate and average of these three readings was taken as the flow time of the solution at a particular temperature and concentration.
Calculations
Solution viscosity is usually determined by comparing the efflux time “t” required for a specified volume of a polymer solution to flow through a capillary tube of the viscometer with corresponding efflux time “to” for the solvent. The following parameters were calculated from the flow time of the solvent and solution at 25ºC temperature. The calculations have been made for each parameter separately using specific formulae [16].
Relative viscosity or Viscosity ratio (ηrel)
Since relative viscosity is the ratio of the flow time of solution and solvent, hence it is a dimensionless quantity.
 (1)
(1)
Where “ts” and “to” are the flow time of the polymer solution and solvent respectively.
Specific viscosity (ηsp)
It is the relative increase in viscosity of the solution over that of solvent.
 (2)
(2)
Reduced viscosity (ηred)
It is the ratio of specific viscosity and corresponding concentrations.
 (3)
(3)
The concentration of polymer solutions are in g/dl, therefore the unit of reduced viscosity is also g/dL.
Intrinsic viscosity or Limiting viscosity number ([η])
It is the measure of the volume occupied by a polymer molecule at infinite solution and
can be obtained by extrapolating reduced viscosity as well as logarithmic inherent viscosity to zero concentration according to Huggins and Kramer’s equations respectively.
 (4)
(4)
Since “ηsp” is dimensionless quantity, therefore [η] has a unit of reciprocal concentration.
 (5)
(5)
This is a well-known Huggins equation, the reduced viscosity is plotted against concentration, the intercept gives the intrinsic viscosity while from the slope, and the Huggins constant was calculated.
 (6)
(6)
In the alternate plot of the Kraemer equation, similarly the intrinsic viscosity was obtained from the intercept and Kremer constant from the slope of the plot.
Number of session per polymer chain [S]
It is the ratio of molecular weight of non-radiated polymer to that of molecular weight of irradiated polymer.
 (7)
(7)
Where “Mvo” is the molecular weight of virgin (non-radiated polymer) and” Mvt” is the molecular weight of irradiated polymer at time “t”.
Molecular weight determination
Intrinsic viscosity is related with molecular weight of the polymer by a very important Mark-Kuhn-Houwink empirical equation. Which was used for calculation of molecular weight from viscosity measurements as well as the values of the constant ‘k’ and ‘α’ for different temperatures were noted from the literature.
 (8)
(8)
Where ‘k’ and ‘α’ are constants for a particular polymer, solvent and temperature system.
Sample irradiation
The used polystyrene sample was converted to granules and was placed in a UV box containing a UV tube with the wavelength range of 365 nm for specified time duration for its irradiation.
Results and discussion
Dilute solution viscometry is commonly appreciated as a tool because of its simplicity and ease. It is not important only for the molecular weight, but also for the estimation of chain configuration and in certain cases, the comparison of solvation power of solvents.
In order to avoid the environmental pollution associated with polystyrene, the present study was under taken to view the effect of UV radiations on the disintegration of the material under study. The intrinsic viscosity of virgin (non-radiated) polystyrene sample is represented in Figure 1, which can be obtained by extrapolation to zero concentration, which was 0.490.
Table 1 shows the calculations for different viscosities for the determination of intrinsic viscosity of virgin as well as for UV irradiated polystyrene samples. First the flow time of the polystyrene sample solutions was recorded and from these readings of flow time, different viscosities were calculated like relative, specific and until reduced viscosity. This reduced viscosity is when plotted against the different concentrations of the polystyrene, and when extrapolated to zero concentration, it gives intrinsic viscosity. Thus, by putting the value of intrinsic viscosity in Mark-Houwink equation, the molecular weight of the polystyrene sample was calculated.
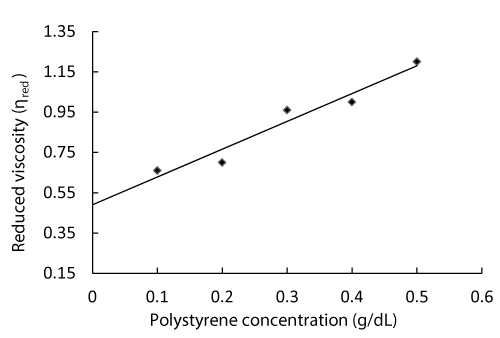
Figure 1: Determination of Intrinsic viscosity of non-radiated Polystyrene.
Table 1. Viscosity data of used Polystyrene before and after UV irradiation.
UV-Irradiation Time (Minutes) |
Concentration of polymer solution (g/dL) |
Average flow time “ts” |
Relative viscosity |
Specific viscosity |
Reduced viscosity |
ηrel= ts/to |
ηsp=ηrel-1 |
ηred=(ηrel-1)/C |
0 (Virgin) |
0.1 |
3.36 |
1.066 |
0.066 |
0.66 |
0.2 |
3.59 |
1.14 |
0.14 |
0.7 |
0.3 |
4.07 |
1.29 |
0.29 |
0.96 |
0.4 |
4.42 |
1.4 |
0.4 |
1 |
0.5 |
5.07 |
1.6 |
0.6 |
1.2 |
10 |
0.1 |
3.35 |
1.06 |
0.06 |
0.63 |
0.2 |
3.57 |
1.13 |
0.13 |
0.66 |
0.3 |
4.05 |
1.28 |
0.28 |
0.952 |
0.4 |
4.38 |
1.39 |
0.39 |
0.976 |
0.5 |
5.01 |
1.59 |
0.59 |
1.18 |
20 |
0.1 |
3.33 |
1.05 |
0.05 |
0.57 |
0.2 |
3.54 |
1.12 |
0.12 |
0.61 |
0.3 |
4.04 |
1.28 |
0.28 |
0.94 |
0.4 |
4.2 |
1.33 |
0.33 |
0.83 |
0.5 |
4.47 |
1.41 |
0.41 |
0.83 |
30 |
0.1 |
3.32 |
1.05 |
0.05 |
0.53 |
0.2 |
3.52 |
1.11 |
0.11 |
0.58 |
0.3 |
4.03 |
1.27 |
0.27 |
0.93 |
0.4 |
4.18 |
1.32 |
0.32 |
0.81 |
0.5 |
4.4 |
1.39 |
0.39 |
0.79 |
40 |
0.1 |
3.32 |
1.05 |
0.05 |
0.53 |
0.2 |
3.46 |
1.09 |
0.09 |
0.49 |
0.3 |
4.03 |
1.27 |
0.27 |
0.93 |
0.4 |
4.17 |
1.32 |
0.32 |
0.8 |
0.5 |
4.38 |
1.38 |
0.39 |
0.78 |
50 |
0.1 |
3.31 |
1.05 |
0.05 |
0.5 |
0.2 |
3.45 |
1.09 |
0.09 |
0.47 |
0.3 |
4.02 |
1.27 |
0.27 |
0.92 |
0.4 |
4.16 |
1.32 |
0.32 |
0.8 |
0.5 |
4.33 |
1.33 |
0.37 |
0.74 |
60 (1 hour) |
0.1 |
3.3 |
1.04 |
0.04 |
0.47 |
0.2 |
3.45 |
1.09 |
0.09 |
0.47 |
0.3 |
4.02 |
1.27 |
0.27 |
0.92 |
0.4 |
4.15 |
1.31 |
0.31 |
0.79 |
0.5 |
4.3 |
1.36 |
0.36 |
0.73 |
The reduced viscosity for non-irradiated (virgin) polystyrene sample was calculated for its dilute solutions, the results are shown in the Table 1 and the molecular weight calculated by using Mark-Houwink equation was 108473 for virgin polystyrene sample (Table 2).
Table 2. Compiled data for intrinsic viscosity, molecular weights, UV irradiation time and number of sessions per polymer chain of polystyrene.
S No. |
Intrinsic viscosity [η] |
Molecular weight of polystyrene sample. |
UV irradiation time (minutes) |
Number of sessions per polymer chain [S] |
1 |
0.490 |
108473 |
0 |
0 |
2 |
0.457 |
96964 |
10 |
0.118 |
3 |
0.432 |
88531 |
20 |
0.225 |
4 |
0.410 |
81373 |
30 |
0.333 |
5 |
0.402 |
78824 |
40 |
0.376 |
6 |
0.391 |
75380 |
50 |
0.439 |
7 |
0.379 |
71694 |
60 |
0.512 |
(Temperature of thermostat bath = 25ºC, Solvent = Toluene, Value for “k” in Toluene at 25ºC = 3.7 × 10⁻⁴, Value for “α” in Toluene at 25ºC = 0.62, Volume of solution used for each measurement = 20 ml).
The calculations of reduced viscosity for the polystyrene sample irradiated for 10 minutes with UV-radiations is shown in Table 1. The intrinsic viscosity calculated was 0.457 as demonstrated in Figure 2a and the molecular weight calculated was 96964 as shown in the Table 2. The number of chain sessions obtained for polystyrene sample irradiated with UV for 10 minutes was 0.118, which can be obtained by using the following relation.

Where “Mvo” is the molecular weight of virgin (non-radiated polymer) and” Mvt” is the molecular weight of irradiated polymer at time “t”.
The reduced viscosity versus the concentration of polystyrene sample, which was irradiated for 20 minutes, is shown in Figure 2b, the intrinsic viscosity obtained was 0.432. Table 1 shows the calculations of its reduced viscosity for different concentrations. The molecular weight determined was 88531 and the number of chain sessions calculated for polystyrene sample irradiated with UV for 20 minutes was 0.225 (Table 2).
The reduced viscosity was calculated for the polystyrene sample irradiated for 30 minutes with UV radiations is shown in Table 1 and its intrinsic viscosity was determined by plotting the reduced viscosity against different concentrations of polystyrene solutions which gave the value 0.410 (Figure 2c). The molecular weight calculated was 81373 and the number of chain sessions per polymer chain was 0.333 as shown in the Table 2.
Figure 2d represents the reduced viscosity of polystyrene sample versus its concentration, which was irradiated for 40 minutes, the values for the reduced viscosity calculated is given in the Table 1. The intrinsic viscosity determined was 0.402 and the molecular weight calculated was 78824. The number of chain sessions obtained for polystyrene irradiated with UV for 40 minutes was 0.376 (Table 2).
The values for reduced viscosity of polystyrene sample irradiated for 50 minutes is given in the Table 1 and these values are plotted against the concentration of polystyrene sample, which is shown in the Figure 2e. The molecular weight determined was 75380 and the intrinsic viscosity obtained was 0.391. The number of chain sessions calculated for polystyrene sample irradiated with UV for 40 minutes was 0.439 as presented in Table 2.

Figure 2. Determination of Intrinsic viscosity for UV irradiated polystyrene samples. (a) 10 min., (b) 20 min., (c) 30 min., (d) 40 min., (e) 50 min., and (f) 60 min. (1 hour).
Figure 2f represents the reduced viscosity against the concentration of polystyrene sample, which was irradiated with UV for 60 minutes (1 hour). The intrinsic viscosity obtained was 0.379 and the molecular weight determined was 71694. The number of chain sessions calculated for polystyrene sample irradiated with UV for 60 minutes (1 hour) was 0.512 as shown in Table 2.
The effect of UV irradiation time on the molecular weight of polystyrene is shown in Figure 3, which shows a gradual decrease in the molecular weight of polystyrene with the irradiation time. This means that UV radiations have a marked effect on the degradation of polystyrene [17,18].
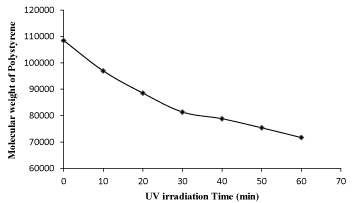
Figure 3. Effect of UV irradiation time on molecular weight of polystyrene.
The number of chain session for polystyrene was plotted versus irradiation time, shown in Figure 4, which gives almost a straight line, which describes that the number of chain session increases due to increase in irradiation time.
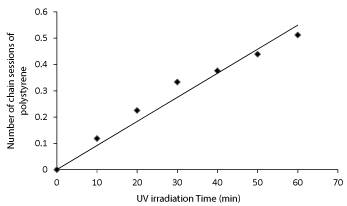
Figure 4. Effect of UV irradiation time on the number of chain sessions of polystyrene.
Comparing the results of virgin (non-radiated) polystyrene sample with that of UV irradiated polystyrene sample for 60 minutes (1 hour), it is clear that the intrinsic viscosity was reduced from 0.490 to 0.379, the molecular weight was reduced from 108473 to 71694, and the number of session per polymer chain was increased to 0.513 respectively as shown in the Table 2, Which clearly confirms the degradation of polystyrene up on exposure to UV radiations [17-19].
Polystyrene degrades very slowly in nature and the expanded polystyrene is not easily recyclable because of its lightweight and low scrap value. It is generally not accepted in curbside programs. Expanded polystyrene foam takes 900 years to decompose in the environment and has been documented to cause starvation in birds and other marine wildlife.
Before dumping to land-fills or disposing it off, the used polystyrene may be irradiated with UV, due to which the degradation of giant polystyrene macromolecules will occur. This will not only reduce its life time in the environment but also reduce a number of environmental problems associated with it.
Conclusion
It can be concluded from the current study that:
- The UV-irradiation has profound effect on the reduction of molecular weight of polystyrene the reduction in the molecular weight indicates the degradation of polystyrene macromolecules by irradiation.
- The increase in number of chain sessions per polymer with the increase irradiation time indicates in the increase in rate of degradation of polystyrene with irradiation time.
- The current study will be helpful for the degradation of polymeric materials being dumped in the environment particularly in landfills and will also reduce their half-life in the environment and consequently, will reduce the environmental problems associated with it.
References
- Serrano DP, Aguado J, Escola JM (2000) Catalytic conversion of polystyrene over HMCM-41, HZSM-5 and amorphous SiO2-Al2O3: comparison with thermal cracking. Appl Catal B: Environ 25: 181-189.
- Zevenhoven R, Karlsson M, Frankenhaeuser M, Hupa M (1995) Laboratory scale characterization of plastic-derived fuels, Borealis Polymer, Report 95/3, Borga, Finland.
- Serrano DP, Aguado J, Escola JM, Garagorri J (2001) Conversion of low density polyethylene into petrochemical feedstock using a continuous screw kiln reactor. Anal Appl Pyrolysis 58: 789-801.
- Takasuga T, Makino T, Tsubota K, Takeda N (2000) Formation of dioxins (PCDDs/PCDFs) by dioxin-free fly ash as a catalyst and relation with several chlorine-sources. Chemosphere 40: 1003-1007. [Crossref]
- Reproductive Effects of Environmental Chemical Exposure (1992) FASE Reports, Foundation for Advancements in Science and Education, Los Angeles, CA, Spring.
- Re:sources" Environmental Action Magazine, Environmental Action, Takoma Park, MD July/August: 19th (1988).
- Kolstad HA, Juel K, Olsen J, Lynge E (1995) Exposure to styrene and chronic health effects: mortality and incidence of solid cancers in the Danish reinforced plastics industry. Occup Environ Med 52: 320-327. [Crossref]
- Carniti P, Beltrame PL, Armada M, Gervasini A, Audisio G (1991) Polystyrene thermodegradation. 2. Kinetics of formation of volatile products. Industrial and Engineering Chemistry Research 30: 1624-1629.
- McNeill IC (1997) Thermal degradation of polystyrene in different environments. Die Angewandte Makromolekulare Chemie 247: 179.
- Nyden MR, Coley TR, Mumby S (1997) Applications of Molecular Dynamics to the Study of Thermal Degradation in Aromatic Polymers. I: Polystyrene. Polym Engin Sci 37: 1496-1500.
- Kruse TM, Woo OS, Broadbelt LJ (2001) Detailed mechanistic modeling of polymer degradation: application to polystyrene. Chem Engin Sci 56: 971-979.
- Anpo M, Takeuchi M (2003) The design and development of highly reactive titanium oxide photocatalysts operating under visible light irradiation. J Catal 216: 505-516.
- Zhu KJ, Hendren RW, Jensen K, Pitt CG (1991) Synthesis, properties, and biodegradation of poly(1,3-trimethylene carbonate. Macromolecule 24: 1736-1740.
- Fujita H (1988) Some unsolved problems on dilute polymer solutions. Macromolecules 21: 179-185.
- SpyChaj T, Lath D, Berek D (1979) Thermodynamic and hydrodynamic properties of polymer tetrahydrofuran water systems: 2. Gel chromatography of polystyrene. Polym 20: 1108-1114.
- Pamies R, Hernández JG, López Martínez MC, Torre JG (2008) Determination of intrinsic viscosities of macromolecules and nanoparticles. Comparison of single-point and dilution procedures. Colloid Polym Sci 286: 1223-1231.
- Hyun JJ, Mal NK (2014) Degradation of linear low-density polyethylene (LLDPE) exposed to UV-irradiation. Eur Polym J 52: 146-153.
- Yuzawa T, Watanabe C, Nemoto N, Ohtani H (2013) Rapid evaluation of photo, thermal and oxidative degradation of high impact polystyrene by a xenon lamp-based online ultraviolet irradiation-pyrolysis-GC/MS system. Chem Engin J. 98: 671- 676.
- Ling Z, Songlin W, Wenjun F, Yanhe H, Lihong T, et al. (2006) Solid-phase photocatalytic degradation of polystyrene with modified nano-TiO2 catalyst. Polym. 47: 8155-8162.