The present study examined correlations between state of free amino acids and hematological or plasma biochemistry, using blood samples acquired from Japanese-black calves within 24 hours after birth. All of free amino acids demonstrated negative correlations with red blood cell counts, hemoglobins and hematocrits. The most significant positive correlation was recorded between γ-glutamyl transpeptidase and glutamic acid, with a linear regression of y=0.025 x+39.99, where x corresponds to γ-glutamyl transpeptidase and y corresponds to glutamic acid (r=0.88, p<0.001). This suggests glutamic acid concentration may relate to the degree of colostrum intake in Japanese-black newborn calves.
glutamic acid, γ-glutamyl transpeptidase, Japanese-black calves, 24 hours after birth
RBC: Red blood cell count; Hb: Hemoglobin; Ht: Hematocrit; ALB: Albumin; TP: Total protein; AST: Aspartate aminotransferases; GGT: γ-glutamyl transpeptidase; AA: Amino acid; Thr: Threonine; Val: Valine; Met: Methionine; Ile: Isoleucine; Leu: Leucine; Phe: Phenylalanine; Lys: Lysine; His: Histidine; Trp: Tryptophan; Arg: Arginine; EAA: Essential AAs; Asp: Aspartic acid; Ser: Serine; Asn: Asparagine; Glu: Glutamic acid; Gln: Glutamine; Gly: Glycine; Ala: Alanine; Tyr: Tyrosine; Pro: Proline,; Cit: Citrulline; Orn: Ornithine; NEAA: Nonessential AAs; TAA: Total AAs
Amino acids (AA) are the fundamental substrates as well as the regulators in metabolic pathways [1]. Bovine colostrum, secreted in the first few days following birth, is a rich source of the AAs presenting in one of two forms; either a protein-binding form (glutamine, glutamic acid, asparagine, serine, lysine, valine and leucine) or a free form (taurine, alanine, proline and glycine) [2,3]. In newborn calves, at 12 to 24 hours after birth, nutrients in colostrums are well-absorbed via the mucous membranes of the intestine [4]. The state of γ-glutamyl transpeptidase (GGT) in serum, is a recognized indicator of the colostrum intake in the calf [3,5]. For newborn calves, hyper-efficient absorption of the AAs in the gut occurs from 2 hours after nursing [3]. Both serum biochemistry and free AA concentrations have each been independently used as quantitative indicators for the intake of colostrums in newborn calves [4]. However, any correlations between these two indicators have not been sufficiently evaluated. The aim of this study was to investigate correlations between states of AAs and hematology or plasma biochemistry in newborn calves within 24 hours after birth.
Sampling and examination
Heparinized blood samples were collected from each calf via the jugular vein within 24 hours after birth. The red blood cell count (RBC), hemoglobin (Hb), hematocrit (Ht), albumin (ALB), total protein (TP), aspartate aminotransferases (AST) and GGT were measured immediately following collection. Plasma was acquired by centrifugation at 3000 ´ g for 10 min and stored at -80°C until measurement of free AAs. Before analysis of free AAs, a solution of 3% salicylic acid was added to samples to facilitate removal of proteins. Free AAs, urea and ammonia (NH3) were measured using an auto amino acid analyzer (JLC-500/V2, AminoTac, JEOL Ltd., Tokyo, Japan). Threonine (Thr), valine (Val), methionine (Met), isoleucine (Ile), leucine (Leu), phenylalanine (Phe), lysine (Lys), histidine (His), tryptophan (Trp) and arginine (Arg) were all classified as essential AAs (EAA). Aspartic acid (Asp), serine (Ser), asparagine (Asn), glutamic acid (Glu), glutamine (Gln), glycine (Gly), alanine (Ala), tyrosine (Tyr), proline (Pro), citrulline (Cit) and ornithine (Orn) were all classified as nonessential AAs (NEAA).
Statistical analysis
The Pearson correlation coefficient and p value were used to determine statistically significant relationships between the hematological or plasma biochemistry and each individual AA, EAA, NEAA, and the total AAs (TAA). SPSS statistics 17.0 was used for statistical analyses. In relation to blood states and amino acid concentrations, statistical correlations were determined at three levels of significance, p<0.05, 0.01 and 0.001.
Hematological values differed greatly among individual calves; for RBC, the mean±SD was 869.2±181.1 ×10⁴ cells/µl (range, 494–1250 ×104 cells/µl); Ht was 37.0±7.8% (19–51%); Hb was 11.4±2.4 g/dl (5.3–14.9 g/dl) (Table 1). Biochemical plasma values also differed greatly among individual calves, except for ALB and TP; AST was 71.0±62.0 U/l (21–352 U/l); GGT was 2362.8±2476.4 U/l (13–8753 U/l); urea was 1621.6±557.3 pmol/l (724.5–3253.3 pmol/l); ammonia was 141.2±55.6 pmol/l (29.5–248.7 pmol/l). The concentrations of free AAs in calf blood, in descending order of concentration, were Ala (270.8±140.6 nmol/ml), Gly (242.0±78.9 nmol/ml), Gln (221.9±119.5 nmol/ml), Pro (145.1±111.2 nmol/ml), and Val (138.8±57.8 nmol/ml), respectively.
Table 1. Hematological, biochemical states and serum concentrations of amino acids in 28 newborn calves
|
Blood examination
|
Mean±SD
|
[minimum-maximum]
|
Blood examination
|
Mean±SD
|
[minimum-maximum]
|
|
RBC (×104cells/µl)
|
869.2±181.1
|
[494-1250]
|
AST (U/l)
|
71.0±62.0
|
[21-352]
|
|
Hb (g/dl)
|
11.4±2.4
|
[5.3-14.9]
|
GGT (U/l)
|
2362.8±2476.4
|
[13-8753]
|
|
Ht (%)
|
37.0±7.8
|
[19-51]
|
Ammonia (µmol/l)
|
141.2±55.6
|
[29.5-248.7]
|
|
TP (g/dl)
|
5.4±0.9
|
[4.0-7.1]
|
Urea (µmol/l)
|
1636.9±562.5
|
[724.5-3253.3]
|
|
ALB (g/dl)
|
2.5±0.2
|
[2.3-3.1]
|
|
|
|
|
Amino Acids (nmol/ml)
|
|
Thr
|
48.4±31.5
|
[12.8-167.3]
|
Asp
|
6.7±1.9
|
[1.5-10.3]
|
|
Val
|
138.8±57.8
|
[18.2-315.2]
|
Ser
|
64.2±27.8
|
[23.8-147.9]
|
|
Met
|
18.1±12.5
|
[3.8-58.4]
|
Asn
|
28.4±11.3
|
[13.0-64.7]
|
|
Ile
|
44.0±18.3
|
[19.7-108.2]
|
Glu
|
99.5±70.4
|
[15.2-228.6]
|
|
Leu
|
81.1±33.4
|
[18.4-166.9]
|
Gln
|
221.9±119.5
|
[36.5-592.6]
|
|
Phe
|
39.4±16.2
|
[1.9-89.0]
|
Gly
|
242.0±78.8
|
[110.8-389.3]
|
|
Lys
|
43.4±21.5
|
[6.8-115.6]
|
Ala
|
270.8±140.6
|
[91.3-667.9]
|
|
His
|
63.0±30.1
|
[21.8-168.4]
|
Tyr
|
48.6±28.0
|
[11.0-137.7]
|
|
Trp
|
22.9±10.8
|
[8.1-55.1]
|
Pro
|
145.1±111.2
|
[26.0-527.2]
|
|
Arg
|
46.1±20.6
|
[11.1-101.8]
|
Cit
|
40.7±11.6
|
[25.5-75.2]
|
|
EAA
|
545.2±213.1
|
[176.2-1242.4]
|
Orn
|
23.7±14.2
|
[10.1-82.8]
|
|
TAA
|
1735.9±618.7
|
[604.5-3733.4]
|
NEAA
|
1190.7±443.5
|
[428.4-2491.0]
|
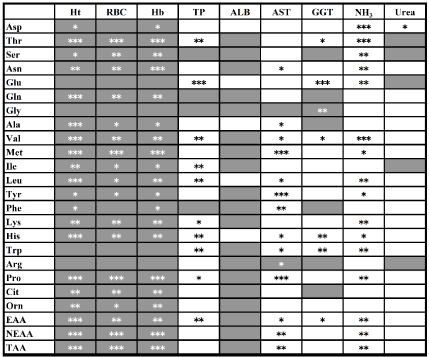
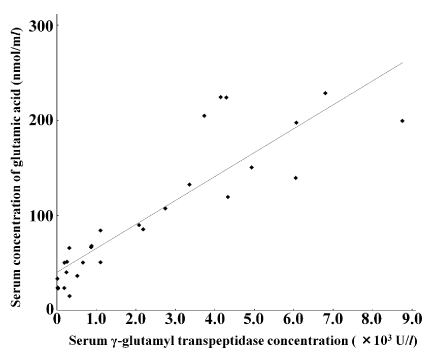
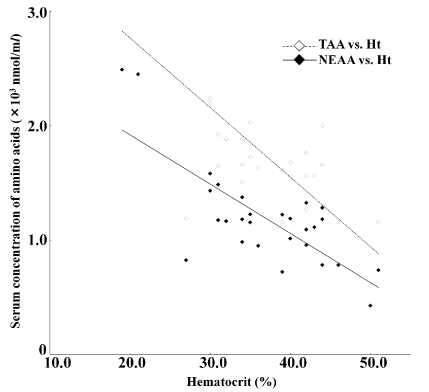
Negative correlations were observed between all of the free AA concentrations and RBC (r=–0.12 to –0.74), Hb (r=–0.08 to –0.75), and Ht (r=–0.19 to –0.77) (Figure 1). With the exception of Glu, Gly, Trp, and Arg, the observed negative correlations with Ht and Hb were significant (p<0.05). Positive correlation coefficients were recorded for the free AA and ammonia, ranging from 0.10 to 0.62. Correlations were significant (p<0.05) for all AA, except Gln, Gly, Ala, Ile, Phe, Cit, and Org. None of the free AA demonstrated significant correlation with urea (p<0.05; r=–0.20 to 0.39). The correlation coefficients between free AAs and GGT ranged from –0.50 to 0.88. Specifically, significant correlations (p<0.01) with GGT were observed for Glu (r=0.88), Trp (r=0.56), and His (r=0.54). Overall, the strongest correlation coefficients were in order as follows: the relationship between GGT and Glu, y=0.025 x+39.99, where x refers to GGT and y refers to Glu, r=0.88 (Figure 2); the relationship between Ht and TAA, y=–60.70 x+3981.20, where x refers to Ht and y refers to TAA, r=–0.77 (Figure 3); the relationship between Ht and NEAA, y=–43.00 x+2780.10, where x refers to Ht and y refers to NEAA, r=–0.76 (Figure 3).

Figure 1. The Pearson correlation coefficients (r) between the hematological or biochemical states and serum concentrations of each amino acid, essential amino acid, non-essential amino acid or total amino acid. Gray-colored and white-colored boxes show negative and positive Pearson correlation coefficients, respectively. Statistical correlations were determined as three levels of significance: *p<0.05, ** p<0.01 and *** p<0.001

Figure 2. Relationship between blood γ-glutamyl transpeptidase (GGT) states and serum concentrations of glutamic acid. The linear regression equation describes the higher correlation between colostrum-intakes based on GGT values and amounts of glutamic acid (Glu) in bloods of newborn calves (P<0.001). Regression equation: y=0.025 x+39.99, where x refers to GGT and y refers to Glu, r=0.88 (p<0.001)

Figure 3. Relationships between hematocrit (Ht) states and plasma concentrations of total AA (TAA, showing as gray diamonds) and non-essential AA (NEAA, showing as black diamonds). Regression equations: y=-60.70 x + 3981.20, where x refers to Ht and y refers to TAA, r=-0.77 (p<0.001); y=-43.00 x+2780.10, where x refers to Ht and y refers to NEAA, r=-0.76 (p<0.001)
Blood states in 28 Japanese-black beef calves within the first day of life correspond with previous reports on hematological and blood biochemistry values [3,6,7], although the urea concentrations were lower than previously reported values by approximately 3 mmol/l [4]. In the present study, negative correlations were recorded between all free AA concentrations and the erythrocytes states. Within the blood, the red blood cells serve as AA carriers [2]. During the initial period following birth, the dominance of erythrocyte-binding AAs in the blood may influence the negative correlation between hematological values and total AA concentrations.
All of free AAs demonstrated positive correlations with ammonia, but no significant correlation with urea. Many AAs can be metabolized to ammonia, and ammonia is almost immediately converted to urea in the liver urea cycle [1]. The activity of the urea cycle in the liver increases after approximately 2 weeks of age [8], with elevated urea levels dependent on growth rates in calves [9]. During the period following birth, transportation of free AA from colostrums may cause retention of ammonia in the blood, due to the undeveloped urea cycle in the liver.
Glu recorded the highest correlation (r=0.88) with GGT. This indicates that the serum state of Glu is significantly influenced by colostrum intake immediately after birth [10]. Serum levels of Glu already increased 2.5 to 4 times in the 2 hours after birth [3]. This change is also dependent on the rate of Gln metabolism by glutaminase within the intestinal membranes [11]. Colostrum intake is thought to be a metabolic trigger to convert Gln to Glu [11]. Gln is one of the major AA transferred from the mother’s blood in utero [10]. Gln reportedly showed a distinct decrease with colostrum intake on the first day of life, despite being the major free AA within cow colostrums [3,10]. Serum GGT levels greater than 200 U/l were suggested to relate to sufficient IgG1 levels above 1000 mg/dl [12]. According to our linear regression for the relationship between GGT and Glu, serum concentrations of Glu should be greater than 30.1 mmol/l in healthy calves suckling sufficient colostrums. Glu is an essential metabolite for the newborn calves and may be central to muscle development and structure [13]. Additionally, Glu may play support roles for the activation of immunological systems [1]. Our data supports that supplements of Glu for newborn calves with insufficient suckling of colostrum are beneficial.
- Brosnan JT (2003) Interorgan amino acid transport and its regulation. J Nutr 133: 2068S-2072S.
- Filho JC, Hazel SJ, Anderstam B, Bergström J, Lewitt M, et al. (1999) Effect of protein intake on plasma and erythrocyte free amino acids and serum IGF-I and IGFBP-1 levels in rats. Am J Physiol 277: E693-701. [Crossref]
- Zanker IA, Hammon HM, Blum JW (2000) Plasma amino acid pattern during the first month of life in calves fed the first colostrum at 0-2 h or at 24-25 h after birth. J Vet Med A Physiol Pathol Clin Med 47: 107-121. [Crossref]
- Hadorn U, Hammon H, Bruckmaier RM, Blum JW (1997) Delaying colostrum intake by one day has important effects on metabolic traits and on gastrointestinal and metabolic hormones in neonatal calves. J Nutr 127: 2011-2023.
- Braun JP, Tainturier D, Laugier C, Bénard P, Thouvenot JP, et al. (1982) Early variations of blood plasma gamma-glutamyl transferase in newborn calves - a test of colostrum intake. J Dairy Sci 65: 2178-2181. [Crossref]
- Kurz MM, Willett LB (1991) Carbohydrate, enzyme, and hematology dynamics in newborn calves. J Dairy Sci 74: 2109-2118. [Crossref]
- Rauprich AB, Hammon HM, Blum JW (2000) Influence of feeding different amounts of first colostrums on metabolic, endocrine, and health status and on growth performance in neonatal calves. J Anim Sci 78: 896-908. [Crossref]
- Takagi M, Yonezawa T, Haga S, Shingu H, Kobayashi Y, et al. (2008) Changes of activity and mRNA expression of urea cycle enzymes in the liver of developing Holstein calves. J Anim Sci 86: 1526-1532. [Crossref]
- Shingu H, Hayashi H, Touno E, Oshibe A, Kushibiki S, et al. (2007) Characteristics of developmental changes in the kinetics of glucose and urea in Japanese Black calves: Comparison with Holstein calves. J Anim Sci 85: 2910-2915. [Crossref]
- Demigné C, Remésy C (1979) Fetal and postnatal metabolism in the calf. Ann Biol Anim Biochem Physiol 19: 159-165.
- Hammon HM, Blum JW (1999) Free amino acids in plasma of neonatal calves are influenced by feeding colostrums for different durations or by feeding only milk replacer. J Anim Physiol Anim Nutr 82: 193-204.
- Parish SM, Tyler JW, Besser TE, Gay CC, Krytenberg D (1997) Prediction of serum IgG1 concentration in Holstein calves using serum gamma glutamyltransferase activity. J Vet Intern Med 11: 344-347. [Crossref]
- Holló G, Nuernberg K, Holló I, Csapó J, Seregi J, et al. (2007) Effect of feeding on the composition of longissmus muscle of Hungarian grey and holstein friesian bulls. III. Amino acid composition and mineral content. Archiv für Tierzucht Dummerstorf 50: 575-586.


