This research investigates the computational analysis of airflow during inspiration and the tracking of particles in the human respiratory system from the nasal cavity to the third generation of the lungs. Also, the effect of geometric features of nasal cavities on their airflow is evaluated in this study. The actual geometry of the respiratory tract was extracted from CT-Scan medical images of a healthy person using image processing software. The flow is evaluated in laminar and steady states. The airflow rate at nasal entrances was assumed to be 20 L/min, which is related to sitting and resting situations. The movement and deposition of particles with a diameter of 1-30 micrometers in different parts of the human respiratory system have also been evaluated. The fluid field and movements of solid particles were evaluated by Eulerian and Lagrangian methods, respectively. Based on the obtained results, the greater the diameter of the particles, the more particles will be deposited in the nasal cavity.
human respiratory system, nasal cavity, lungs, computational analysis, airflow, particle deposition
The nose is the first passageway through which air can pass towards our lungs. The nasal cavity connects the ambient environment and the pharyngeal portion of the upper airway, providing humans with warm and humidified air, protecting them from pathogens and particulate matters from the inspired air, and enabling them with olfaction. All of these are associated with the airflow in the nasal cavity, which is significantly determined by nasal morphology and flow rate.
In the past several decades, experimental and numerical studies of flow dynamics and particle deposition in the nasal cavity have been investigated by many researchers. As for experimental studies, Schreck et al. [1] investigated the airflow through human nasal passages. Hahn et al. [2] evaluated the airflow in a nasal cavity replica model and found that the airflow was laminar up to a breathing rate of 24 L/min. By producing models that replicate the nasal anatomy, Kim and Chung [3] also showed the relation between geometric variations of the middle turbinate and the airflow patterns in the nose. Hopkins et al. [4], Kelly et al. [5], Taylor et al. [6] and Doorly et al. [7] have also performed a series of experimental investigations of the airflow in the nasal cavity.
Recently, with the advantage of computational fluid dynamics (CFD), numerous computational simulations of airflow and particle deposition patterns in the nasal cavity have been reported. These simulations are reconstructed by models from computed tomography (CT) and Magnetic Resonance Imaging (MRI) scans. Computational simulations have become a new reliable trend for nasal airflow exploration and demand fewer resources. The work of Liu et al. [8,9], Shanley et al. [10], Shi et al. [11], Xi and Longest [12], Kimbell [13], Wang et al. [14], Moghadas et al. [15] and Abouali et al. [16] are a few examples of researchers that have employed the CFD approach.
The research of Zachow et al. [17] and Wen et al. [18] are examples of some recent numerical studies of the airflow. Moreover, Zamankhan et al. [19], Xi and Longest [12], Wang et al. [14] and Se et al. [20] investigated the mechanics of airflow in human nasal airways in detail. The numerical analysis of the respiratory flow pattern in the upper airway of a human being was presented by Wang et al. [21]. The airway model in their work consisted of the nasal cavity, pharynx, larynx, and trachea that was built based on the CT images of a healthy person. Developing an anatomically accurate human upper airway model based on multiple MRI axial scans. Mylavarapu et al. [22] conducted detailed CFD simulations during expiration to investigate the fluid flow in the airway regions where obstruction could occur.
Additionally, it is important to make sure that particle deposition occurs at some targeted areas for therapeutic inhalation drug delivery and that drugs with sub-micrometer particles are used in order to efficiently deliver them to the lungs [23,24]. Thus, understanding the regional particle deposition in the human upper airway and the fraction of particles entering the lungs would be of major importance for using aerosol inhalation in controlled pulmonary drug delivery as well as establishing proper links between certain lung diseases and exposure to hazardous airborne particulate matter.
Up to now, many experimental and numerical studies on particle transport and deposition through human nasal passages have been performed. Strong and Swift [25], Cheng et al. [26] and Swift et al. [27] measured the capture of ultrafine particles in the human nasal passage. Cheng et al. [28,29] and Cheng [30] have evaluated the deposition efficiency in the human nasal passage. Swift and Strong [31] presented an empirical relation for deposition efficiency in the human nasal passage for nano-sized particles by evaluating three persons. Measuring the particle deposition in different models that replicated the nasal airway, Kelly et al. [32] concluded that for nano-sized particles, the surface quality of the nasal pathway does not significantly affect the nasal deposition. However, micro-particle deposition efficiency is strongly related to the condition of the nasal pathway. Recently Xi et al. [33] evaluated the transport and deposition of particles from the nasal cavity to the larynx based on a model extracted from MRI head images of a 5-year old boy. As for numerical studies, computer simulations of particle deposition in the nasal cavity were reported by Zamankhan et al. [19], Shi et al. [11], Liu et al. [8] and Wang et al. [21].
Borgstrom et al. [34] performed a literature survey on aerosol deposition in humans and concluded that lung deposition is largely determined by throat deposition as a major determinant for variability. By using direct numerical simulation (DNS), Lin et al. [35] compared two different airway models, one of which was from the mouth up to generation 6 and the other started from the trachea. They concluded that the second model that lacked upper airway could not provide a realistic airflow field in the lung. Thus, to reliably estimate the amount of deposition of particles inhaled in the lungs, one should not ignore the upper airway.
Kesavanathan et al. [36] evaluated the deposition of micro-particles in the respiratory tract in 40 people. They observed that the rate of deposition in these people is completely different, but in all cases, the number of particles that have been deposited is directly related to the Impaction Parameter (IP). This parameter shows the number of particles that have been deposited. For spherical particles, IP is defined as:
 (1)
(1)
where d is the diameter of particles and Q is the airflow rate.
In this study, first, the air flow was numerically evaluated in a realistic model of the human upper respiratory system during inspiration. Then, the effect of differences in the geometric features of the left and right nasal cavity on the airflow was investigated. The proposed model was also used to estimate the micro-particle deposition in an airway model consisting of the nasal cavity extended to the third generation of the lungs. Fluid field and solid particles’ movements were simulated using the Eulerian and the Lagrangian methods, respectively.
Airway Model
In this work, the airflow characteristics were investigated by passing the airway through the nasal cavity (vestibule, nasal valve, and the main airway), pharynx, larynx, and trachea to the third generation of the lungs. The CT-scans of an 18-year-old healthy male (80 kg mass, 185 cm height) which were provided by the Milad hospital in Isfahan, Iran, were used to construct the airway model (Figure 1). The cross sections were 1 mm apart and the images possessed a resolution of 512×512 pixels. The images have been verified by an otolaryngologist as well as a radiologist separately and both confirmed the respiratory system of the person to be healthy.
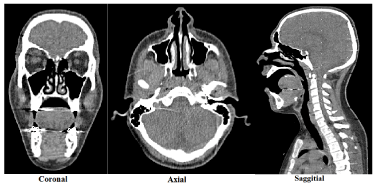
Figure 1. CT-scan images of an 18-year-old male from coronal, axial and sagittal directions.
A CT-scan is a noninvasive medical procedure that uses specialized X-ray equipment to produce cross-sectional images of the body. Although this device enables physicians to visualize the body from various angles, images are usually taken from three different angles including coronel, sagittal and axial (as illustrated in Figure 1). Data extracted from the images were sent to a computer to reconstruct all of the individual "snapshots" into one or multiple cross-sectional images of the internal organs and tissues. In a CT-scan, various densities of tissue can be easily distinguished. Areas with high density, for example bone tissues, were lighter than the darkly colored areas, such as air cavities where densities are lower. As one may notice from Figure 1, the oral cavity and sinuses were also seen in black. In fact, distinguishing between the oral and nasal cavities, as well as determining the small airways in the lungs, was among the factors that make the image processing phase more difficult. Comprehensive knowledge of the nasal airway anatomy was crucial in this process. So, the images have been viewed by a consultant physician in order to distinguish the areas more precisely.
The challenges of the reconstruction process have been pointed out by many researchers [37,19]. Different methods were utilized to generate an accurate 3-D model from the 2-D coronal cross-sections. In the present study, the 3-D geometry of the human respiratory tract was reconstructed as follows. First, CT-scan images with DICOM formatting were taken from the subject. Next, the CT-scan images were processed by image processing software and the coordinates of the airway boundaries were indicated. Finally, the 3-D model of the human airway was created and then exported to meshing software to become ready for CFD analysis.
By considering the nose as the entrance for air and also defining eight different surfaces in the third generation of the lungs for the outlet of air, a realistic geometric model of the human respiratory system was developed. As it can be seen in Figure 2, different parts of the respiratory system have been shown with distinct colors.
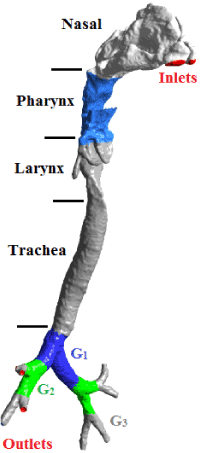
Figure 2. The realistic model of the human respiratory system from the nose to the third generation of the lungs.
Mesh generation and nasal geometry
By using ANSYS/ICEM, the 3-D model with a smooth surface and the non-uniform mesh were created. Because the behavior of the particles near the walls was significant for deposition study, four boundary layers with 1.2 growing ratios were generated near the walls. Previous studies showed that a refined mesh with y+w<2 near the walls, makes the particle deposition results independent from the grid sizes [38]. In order to achieve grid independence of the flow field and particle deposition fractions, five different meshes (3.35, 4.24, 5.32, 7.84, 10.5 million elements) have been generated. The mean air velocity at the entrance of the lungs has been compared in these five meshes. As shown in Figure 3a, the change in the air velocity for meshes with 7.84 and 10.5 million elements was insignificant. For 7.84 million elements, the y+ is less than two near the walls, thus, this mesh was suitable for computational analysis and was used in the present study. Figure 3b indicates the refined meshes inside the nasal cavity and near the walls.
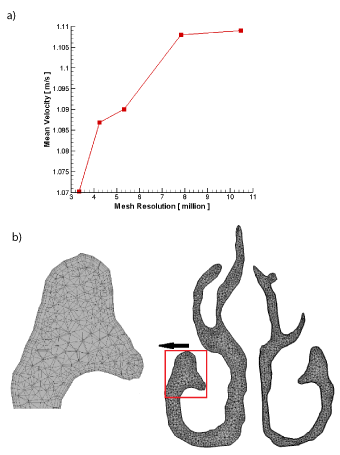
Figure 3. Grid study based on mean velocity in the entrance of the lungs and b) the refine mesh inside the nasal cavity.
To better understand the measurements of the right and left nasal pathways, several cross sections have been created for the region extending from the nostril to the entrance of the pharynx (Figure 4A). Figure 4B demonstrates the shape of the airway in the nasal cavity for each cross section. Also, Figure 5 displays a 2D plot of the variation in the cross-sectional area, CSA (cm2), within centroid distance, Y (cm), for both nasal pathways.
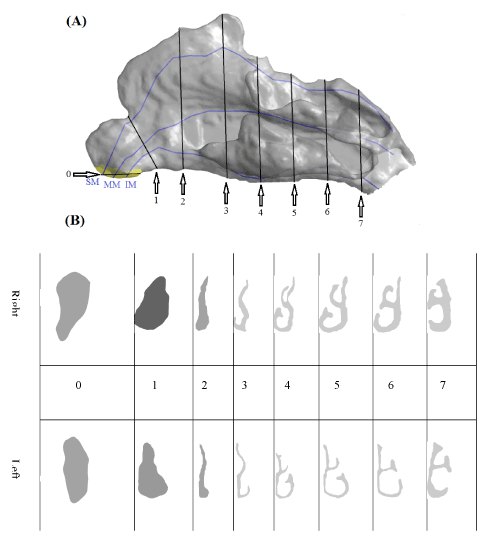
Figure 4. Various cross sections in the right and the left nasal pathways.
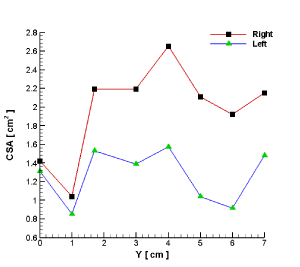
Figure 5. Comparison of the CSA in the left and the right nasal cavities.
The nose consists of the right and left cavities separated by the nasal septum. Air enters each nasal cavity uniformly through the nostril (section 0). The area extending from the nostril to the nasal valve is a funnel-shaped region called the vestibule. The narrow end of the vestibule leads to a nasal valve (section 1). Beyond the nasal valve, the main nasal passages begin (section 2). The CSA of the airway increases in the main nasal passage. There are three wing-like tissue projections in the main nasal passage: the inferior, the middle, and the superior turbinates. Three separate airways or meatus are located below each turbinate that is named correspondingly (e.g. the inferior, the middle, and the superior meatuses). As depicted in Figure 4A, there are three separate lines passing through these triple meatuses with the respective labels of SM, MM, and IM. The inferior and middle meatuses are larger than the superior meatus. The olfactory region is located above the middle meatus where the surface is covered with olfactory epithelium [39]. The main nasal passage is connected to the nasopharynx (after section 7), which leads to the pharynx.
The difference in the caliber between the left and right nasal pathways was reflected by the fact that the left pathway had a passage volume much smaller than that of the right one. The effects of geometrical discrepancies between pathways on the passing airflow will be evaluated later on in this study. Figure 5 shows that the maximum CSA in both the right and the left nasal pathways belonged to section 4. Starting from the nostril, the CSA of the right nasal cavity was approximately 10 percent larger in comparison to that of the left cavity. This difference in the areas of the left and the right nasal cavities increased in a way that by reaching section 6, the area of the right nasal cavity was approximately two times as much as the left one.
Governing equation
Airflow
In the present study, it was assumed that the airflow in the nasal cavity was a steady and laminar flow with constant fluid properties.
The momentum equation for this airflow was as follows:
 (2)
(2)
In this equation  is the velocity vector, P is the fluid pressure,
  is the fluid density, and
  is the kinematical viscosity applied to the momentum equation. By neglecting temperature effects and density variations, the continuity equation reduced to:
 (3)
(3)
Micro-Particle transport
As mentioned earlier, the micro-particle transport and deposition calculation were performed by a Lagrangian approach. This model tracked individual particles within the flow field. The primary advantage of this method was that the effect of various forces such as gravity, lift and the Brownian diffusivity, as well as particle inertia, can be included in the analysis.
The Lagrangian approach is most practical when the inertia has a noticeable effect for micro-particles. By ignoring the lift and Brownian effects, the particle's equation of motion is given as:
 (4)
(4)
In Eq. (4), is the particle velocity vector, dp is the particle diameter,
  is the particle density, μ is the fluid viscosity, g is the acceleration gravity, and
  is the particle Reynolds number. Here C D
 (5)
(5)
which is the particle drag coefficient, and
 (6)
(6)
is the Cunningham slip correction factor. In Eq. (6) λ is the mean air free path.
For solving these equations, the ANSYS-Fluent 6.3 software was used.
For the Lagrangian model, the deposition fraction was computed based on the number of deposited particles. The deposition fraction (DF) of microparticles for the region can be written as:
 (7)
(7)
Airflow structure
Based on the literature, the flow should be in laminar condition for a flow rate of less than 12 L/min in a single nasal passage [2]. Although Doorly et al. [7] reported a relatively undisturbed laminar flow within much of the cavity, they also observed some instability in the flow for this flow rate for an inspiratory jet entering the nasal cavity. The assumption of laminar flow for a flow rate of less than 12 L/min seemed reasonable for the steady flows. In the present work, for moderate activities, it was assumed that the airflow in the nasal cavity was laminar and steady, and the flow rate of 10 L/min per nostril was used in the simulations. The inlet velocity for the left and the right nasal pathways was 1.43 and 1.39 m/s, respectively. These values were calculated based on the area of the inlet planes of the right and the left nostrils. Also, constant pressure was defined for the outlet boundary conditions.
In Figure 6, velocities of the air flowing on three different lines of IM, SM and MM (see Figure 4(A)) in the right and the left nasal pathways were depicted. Due to the funnel-shaped region of the vestibules, the air flow velocity increased from the nostrils to the nasal valve. After the nasal valve, with increases in the area of the nasal pathways, the velocity decreased. As showed in Figure 6, in all regions of the nasal pathway, the middle meatus had the highest air velocity. The peak velocity occurred in the nasal valve region (Y=1-2 cm) in the right nasal cavity and around the main nasal passage (Y=5-6 cm) for the left cavity. The least amount of velocity occurred in the olfactory region on the SM line in both cavities.
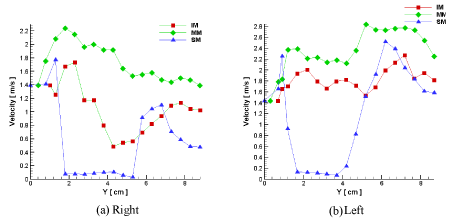
Figure 6. Air flow velocities in (a) the right and (b) the left nasal pathway.
In Figures 7 to 9, the air flow velocity of these three sections has been compared separately in the left and the right nasal pathway. These figures clearly showed that the velocity distribution in the different sections of the nasal cavity was significantly influenced by the geometry of the nasal cavity. Although the inlet flow rate for both cavities has been equally assumed, the left nasal pathway that was narrower, had a higher airflow velocity in comparison to that of the right nasal pathway. So, the left nasal pathway had a higher tendency to become turbulent in some parts of this pathway.
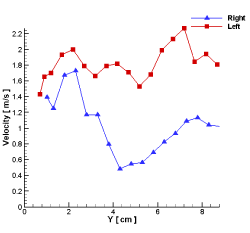
Figure 7. Air velocity in the right and the left nasal pathway on the IM line.

Figure 8. Air velocity on the left and the right nasal pathway on the MM line.
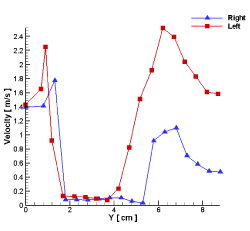
Figure 9. Air velocity in the right and the left nasal pathway on the SM line.
Figure 10 shows the pressure changes across the left and the right nasal pathways. This figure helps to better understand the effect of differences in the pathways’ geometry on the airflow. It was seen that the pressure drops for the narrower pathway (15 Pa) was higher than that of the right pathway (5 Pa). The pressure drop in the left nasal pathway was approximately 67 percent more than the corresponding one for the right pathway.
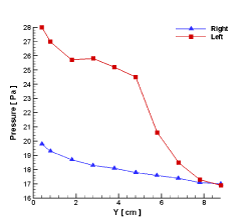
Figure 10. Air pressure in the left and the right nasal cavity.
Figure 11 illustrates the velocity contours of the left and right nasal cavities near the septum. Airflow entered from the nostril into the vestibule region and then experienced almost a 90-degree diversion toward the main airway of the nasal cavity. Because of the centrifugal force effect in this region, airflow wanted to pass through the upper parts of the nasal cavity. But due to the small area of this section of the nasal passage, air flowed mainly through the middle and inferior meatus (IM & MM).
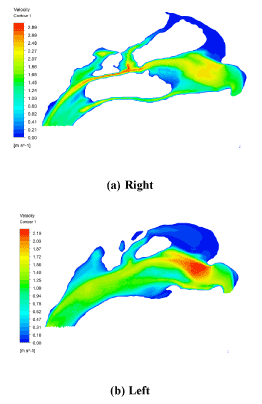
Figure 11. Velocity contours of the (a) right and (b) left nasal cavity near the septum wall.
In most normal nasal cavities, the nasal valve has the least surface area. This causes the peak velocity to occur in the nasal valve region. In the present study, this result was repeated for the right pathway which had a maximum airflow velocity of 2.19 m/s at the nasal valve (Figure 11). While the left pathway had a maximum airflow velocity of 2.89 m/s at the middle meatus (MM) of sections 5-6 (Figures 5 and 11). It should be noted that the CSA of sections 5-6 and the nasal valve (Section 1) were approximately equal in the left pathway. However, since the airflow entering the sections 5-6 had a higher velocity than the inlet flow velocity that entering the nasal valve, the peak velocity of the left nasal pathway occurred in the middle of it. Seven cross sections had been created for the region extending from the nostril up to the end of the nasopharynx. The corresponding velocity contours at cross-sections 1-7 are shown in Figure 12. These contours depicted the velocity distribution throughout the nasal cavity and illustrated that most of the airflow passed through the middle meatus area. The least quantity of air passed through the olfactory region that is located in the superior meatus. This air flow with low velocity permits air to enter the olfactory region and prevents the olfactory system from being damaged by the air flow. The results incorporated in the contours were in agreement with the velocity diagrams, which have been mentioned before.
To better understand and evaluate the air flow in the pharynx, larynx, and trachea, five cross sections have been created throughout these regions (Figure 15). Diagrams of the velocity (Figure 13) and pressure (Figure 14) changes from the pharynx to the entrance of the lungs have been drawn. In the larynx (around section B-B’ in Figure 15), due to a decrease in the cross-section area that reached its minimum, the airflow velocity reached its maximum (approximately 4.3 m/s). After passing this region, with an increase in the cross-sectional areas, airflow developed, and the velocity decreased (Figure 13). Pressure dropped rapidly as flow transited the larynx. As 80 percent of the total pressure drop in these regions (oropharynx, larynx, and trachea) occurred at the end of the larynx and only 20 percent of the pressure drop occurred after larynx (Figure 14).
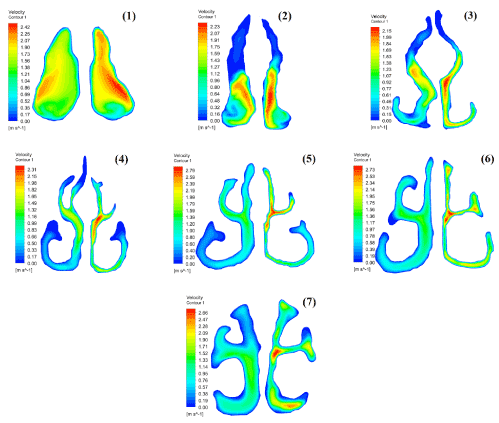
Figure 12. Velocity contours of different cross-sectional areas in the nasal cavities.
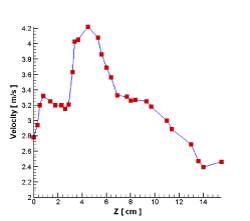
Figure 13. Air velocity in the pharynx, larynx, and trachea.
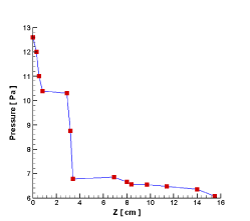
Figure 14. Air pressure in the pharynx, larynx, and trachea.
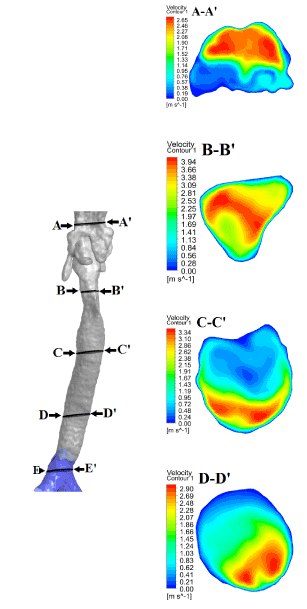
Figure 15. Velocity contours of cross sections in the pharynx, larynx, and trachea.
Particle deposition
Knowing the deposition rate of particles of a certain size and also the region of deposition in the human respiratory system, researchers and pharmacists can design better drugs for the treatment of respiratory diseases.
After evaluating the airflow in the nasal cavity, the transport and deposition of particles with a diameter of 1–30 micrometers were evaluated. Eq. 7 was utilized to calculate the deposition fraction. The deposition of different particles in the respiratory system has been studied in several works. In this study, the respiratory system has been divided into two major regions as the researcher has done in the previous study [40]. These regions consist of the extrathoracic (ET) and the tracheobronchial (TB) tree. The ET starts from the nostrils and goes to the larynx region. In this study, the TB stared from the trachea and went to the end of the third generation of the branching airways. Dividing the respiratory system into two segments helped to create a deposition fraction diagram to compare the deposition of particles with regard to their diameter in different regions of the respiratory system.
In much research [36,30,40,7], the deposition fraction of micrometer particles was illustrated in diagrams based on the impaction parameter (IP) mentioned earlier. Using this parameter, the deposition fraction has been illustrated in Figure 16. This diagram shows that the deposition fraction for particles with the diameter of 1-8 micrometers was approximately 5 percent in the TB region. For lower generations of the lungs, the deposition fraction decreased from 90 percent for one-micrometer particles to 20 percent for eight-micrometer particles. As for particles within a larger scale, the deposition in the lungs decreased to almost zero.
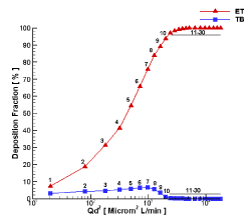
Figure 16. Deposition fraction of particles in the human airway.
In the upper part of the respiratory system (ET), the deposition rate started at around seven percent and increased as the diameter of the particles increased. This increase occurred in a way that the deposition rate for particles larger than 10 micrometers reached 97 percent in the ET region and prevented most particles from reaching the lungs. Therefore, in order to deliver the micrometer-sized drugs of pulmonary-related diseases from the nasal cavity, the particles of drugs might have a diameter of smaller than 8 micrometers. Thus, medications with a size larger than 8 micrometers that are inhaled into the respiratory system from the nose could be used for the treatment of diseases associated with the nasal cavity. These could include nasal polyps, local allergies, and influenza vaccines.
Validation
Validation of our results was achieved by comparing the numerical results of particle deposition in the nasal cavity of the present model to different experimental data sets. Cheng [30] compared particle deposition in the nasal cavity reported by various researchers including himself. Evaluating particle deposition in the nasal cavity of different individuals, researchers have found that the trend of particle deposition data in the nasal cavity fits an exponential function as seen in Eq. 8. In this equation, only the constant ‘a’ have been changed in different studies.
 (8)
(8)
By comparing particle deposition in the nasal cavity reported by a number of researchers, Cheng [30] concluded that the constant ‘a’ varies from 0.00128 [41]–0.00839 [42] and has a mean of 0:00309 [30]. In this study, particle deposition in the nasal cavity was compared to the results mentioned above and the experimental data summarized in Cheng’s study as depicted in Figure 17.
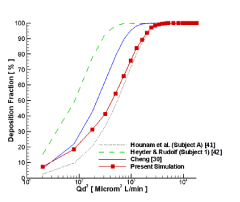
Figure 17. Comparison of the deposition fraction of particles in the ET part with experimental results of some other researchers.
After evaluating the deposition fraction of particles in the nasal cavity, the constant “a” in this study was achieved and was equaled to 0.00153. Eq. 9 had the best fit to the present numerical results.
 (9)
(9)
In the present study, the flow of the air through the passages in inspiration was examined. Also, the tracking of particles in the human respiratory system was investigated using a CFD approach. The effect of differences in the geometric features of the left and right nasal cavity on airflow in these cavities was investigated. Based on the results, the following conclusions can be drawn.
- Although the inlet flow rates for both nostrils have been assumed to be equal, the left nasal pathway that is narrower had a higher airflow velocity than that of the right nasal pathway and had a higher tendency to become turbulent in some parts. The pressure drop for the narrower pathway was higher than the one for the right pathway.
- In all regions of the nasal pathway, the middle meatus had the highest velocity of airflow. The least quantity of airflow passed through the olfactory region that is located in the superior meatus. This air flow with a low velocity could permit air to enter the olfactory region.
- The nasal valve has the least area in the nasal cavity. This causes the peak velocity to occur in this region. This was true for the right pathway but for the left cavity, the peak velocity occurred around the middle of the main nasal passage. The CSA of this area and the nasal valve were approximately equal in the left pathway. But because the airflow that entering this region had a higher velocity in comparison to that of the inlet flow entering the nasal valve, the peak velocity of the left nasal pathway occurred in this section.
- In the larynx, due to a decrease in the cross-sectional area that reached its minimum, the airflow velocity experienced its maximum value. After passing this region, there was an increase in the cross-sectional areas, the airflow developed, and the velocity decreased. Pressure fell rapidly as flow transited the larynx, with 80% of the total pressure drop in these regions (oropharynx, larynx, and trachea).
- During inspiration, half of the pressure drop occurred in the nasal cavity, while the other half occurred through the pharynx, larynx, trachea and three generations of the lungs.
- The deposition fraction for particles with a diameter of 1-8 micrometers was approximately 5 percent in the TB region. For lower generations of the lungs, the deposition fraction decreased from 90 percent for one-micrometer particles to 20 percent for eight-micrometer particles. As for particles within a larger scale, the deposition in the lungs decreased to zero.
- In the upper part of the respiratory system (ET), the deposition rate started at around 7 percent and increased as the diameter of the particles raised. This increase occurred in a way that the deposition rate for particles larger than 10 micrometers reached 97 percent in the ET region and prevented most particles from reaching the lungs.
- Therefore, for delivery of micrometer-sized drugs of pulmonary-related diseases from the nasal cavity, the particles of drugs might have a diameter smaller than 8 micrometers. Thus, medications with a size larger than 8 micrometers that are inhaled into the respiratory system from the nose could be used for the treatment of diseases associated with the nasal cavity, such as nasal polyps, local allergies, and influenza vaccines
- With evaluating the deposition fraction of particles in the nasal cavity, Eq. (9) has the best fit to the present numerical results.
- Schreck S, Sullivan KJ, Ho CM, Chang HK (1993) Correlations between flow resistance and geometry in a model of the human nose. J Appl Physiol (1985) 75: 1767-1775. [Crossref]
- Hahn I, Scherer PW, Mozell MM (1993) Velocity profiles measured for airflow through a large-scale model of the human nasal cavity. J Appl Physiol (1985) 75:2273-2287. [Crossref]
- Kim SK, Chung SK (2003) An investigation on airflow in disordered nasal cavity and its corrected models by tomographic PIV, Meas. Sci and Tech 15:1090-1096.
- Hopkins LM, Kelly JT, Wexler AS, Prasad AK (2000) Particle image velocimetry measurements in complex geometries. Exp Fluids 29:91–95.
- Kelly JT, Prasad AK, Wexler AS (2000) Detailed flow patterns in the nasal cavity. J Appl Physiol (1985) 89: 323-337. [Crossref]
- Taylor DJ, Franke VE, Doorly DJ, Schroter RC (2005) Airflow in the human nasal cavity. New York: ASME SBC05 Summer Bioengineering Meeting; 2005. p. 22–26.
- Doorly D, Taylor DJ, Franke P, Schroter RC (2008) Experimental investigation of nasal airflow. Proc Inst Mech Eng H 222: 439-453. [Crossref]
- Liu Y, Matida EA, Gu J, Johnson MR (2007) Numerical simulation of aerosol deposition in a 3-D human nasal cavity using RANS, RANS/EIM, and LES. J Aerosol Sci 38:683–700.
- Liu Y, Matida EA, Johnson MR (2010) Experimental measurements and computational modeling of aerosol deposition in the carleton-civic standardized human nasal cavity. J Aerosol Sci 41:569–586.
- Shanley KT, Zamankhan P, Ahmadi G, Hopke PK, Cheng YS (2008) Numerical simulations investigating the regional and overall deposition efficiency of the human nasal cavity. Inhalation Toxicology. 20:1093–1100. [Crossref]
- Shi H, Kleinstreuer C, Zhang Z (2007) Modeling of inertial particle transport and deposition in human nasal cavities with wall roughness. Aerosol Sci 38:398-419.
- Xi J, Longest PW (2008) Numerical predictions of submicrometer aerosol deposition in the nasal cavity using a novel drift flux approach. Int J Heat Mass Transf 51:5562-577.
- Kimbell JS (2006) Nasal dosimetry of inhaled gases and particles: where do inhaled agents go in the nose? Toxicol Pathol 34: 270-273. [Crossref]
- Wang SM, Inthavong K, Wen J, Tu JY, Xue CL (2009) Comparison of micron and nano particle deposition patterns in a realistic human nasal cavity. Respir Physiol Neurobiol 166:142–151. [Crossref]
- Moghadas H, Abouali O, Faramarzi A, Ahmadi G (2011) Numerical investigation of septal deviation effect on deposition of nano/microparticles in human nasal passage. Respir Physiol Neurobiol 177:9-18. [Crossref]
- Abouali O, Keshavarzian E, Ghalati PF, Faramarzi A, Ahmadi G, et al. (2012) Micro and nanoparticle deposition in human nasal passage pre and post virtual maxillary sinus endoscopic surgery. Respir Physiol Neurobiol 181: 335-345. [Crossref]
- Zachow S, Steinmann A, Hildebrandt T, et al. (2006) CFD simulation of nasal airflow: towards treatment planning for functional rhinosurgery. Int Congr Ser 165–167.
- Wen J, Inthavong K, Tu JY, Wang S (2008) Numerical simulations for detailed airflow dynamics in a human nasal cavity. Respir Physiol Neurobiol 161:125–135. [Crossref]
- Zamankhan P, Ahmadi G, Wang Z (2006) Airflow and deposition of nano-particles in a human nasal cavity. Aerosol Sci and Tech 40:463-476.
- Se CM, Inthavong K, Tu J (2010) Inhalability of micron particles through the nose and mouth. Inhal Toxicol 22: 287-300. [Crossref]
- Wang Y, Liu Y, Sun X (2009) Numerical analysis of respiratory flow patterns within human upper airway. Acta Mech Sin. 25:737–746.
- Mylavarapu G, Murugappan S, Mihaescu M, Kalra M, Khosla S, et al. (2009) Validation of computational fluid dynamics methodology used for human upper airway flow simulations. J Biomech 42: 1553-1559. [Crossref]
- Suman JD, Laube BL, Dalby R (2006) Validity of in vitro tests on aqueous spray pumps as surrogates for nasal deposition, absorption, and biologic response. J Aerosol Med 19:510–521. [Crossref]
- Longest PW, Hindle M (2010) CFD simulations of enhanced condensational growth (ECG) applied to respiratory drug delivery with comparisons to in vitro data. J Aerosol Sci 41:805–820. [Crossref]
- Strong JC, Swift DL Deposition of ultrafine particles in a human nasal cast. Loughborogh: Proceedings of the First Conference of Aerosol Society. p. 109–112.
- Cheng YS, Yamada Y, Yeh HC, Swift DL (1988) Diffusional deposition of ultrafine aerosols in a human nasal cast. J Aerosol Sci Technol 19:741–751.
- Swift DL, Montassier N, Hopke PH, Karpen-Hayes K, Cheng YS, et al. (1992) Inspiratory deposition of ultrafine particles in human nasal replicate cast. J Aerosol Sci 23:65–72.
- Cheng YS, Su YF, Yeh HC, Swift DL (1993) Deposition of Thoron progeny in human head airways. J Aerosol Sci Technol. 18:359–375.
- Cheng K, Cheng Y, Yeh H, Guilmette RA, Simpson SQ, et al. (1996) In vivo measurments of nasal airway dimensions and ultrafine aerosol deposition in the human nasal and oral airways. Aerosol Sci 27:785-801.
- Cheng YS (2003) Aerosol Deposition in the Extrathoracic Region. Aerosol Sci Technol 37: 659-671. [Crossref]
- Swift DL, Strong JC (1996) Nasal Deposition of Ultrafine Aerosols in Human Subjects. J Aerosol Sci 27:1125-1132.
- Kelly JT, Asgharian B, Kimbell JS, Wong BA (2004) Particle Deposition in Human Nasal Airway Replicas Manufactured by Different Methods. Part II: Inertial regime Particles, Aerosol Sci Technol 38:1063-1071.
- Xi J, Si X, WonKim J (2011) Simulation of airflow and aerosol deposition in the nasal cavity of a 5-year-old child. J Aerosol Sci 42:156–173.
- Borgström L, Olsson B, Thorsson L (2006) Degree of throat deposition can explain the variability in lung deposition of inhaled drugs. J Aerosol Med 19: 473-483. [Crossref]
- Lin CL, Tawhai MH, McLennan G, Hoffman EA (2007) Characteristics of the turbulent laryngeal jet and its effect on airflow in the human intra-thoracic airways. Respir Physiol Neurobiol 157:295–309. [Crossref]
- Kesavanathan J, Bascom R, Swift D (1998) The effect of nasal passage characteristics on particle deposition. J Aerosol Sci 11:27-39.
- Kimbell Js (2001) Computational fluid dynamics of the extrathoracic airways. In: Martonen, T.B. (Ed.), Medical Applications of Computer Modelling: The Respiratory System. Southampton, UK: WIT Press; 2001.
- Parker S, Foat T (2008) Preston S.Towards quantitative prediction of aerosol deposition from turbulent flows. J Aerosol Sci 39: 99–112.
- Shi H, Kleinstreuer C, Zhang Z (2008) Dilute suspension flow with nanoparticle deposition in a representative nasal airway model. Am Insti of Phys 013301:1-23.
- Cheng Y (2014) Mechanisms of pharmaceutical aerosol deposition in the respiratory tract. Am Assoc Pharmaceu Scientists 15:205-21.
- Hounam RF, Black A, Walsh M (1971) Deposition of Aerosol Particles in the Nasopharyngeal Region of the Human Respiratory Tract. J Aerosol Sci 2:341–352.
- Heyder J, Rudolf, G (1977) Deposition of aerosol in the human nose. Inhaled Particle IV. Oxford: Pergamon Press, p. 107–125.


