Abstract
Various skin pretreatments for body surface biopotential measurement need a quantitative comparison. In this paper, 6 representative skin pretreatments, namely: no pretreatment, cleaning skin with alcohol, spreading saline on skin, rubbing skin with sandpaper, cleaning skin with alcohol and spreading saline, rubbing skin with sandpaper and spreading saline, are selected to be investigated. Two methods are particularly designed to test and compare the 6 pretreatments. Method one relies on comparing their skin-electrode impedances. The lower skin-electrode impedance means better electrical contact between skin and electrode. Practically, the measured skin-electrode impedance always includes internal human body impedance and skin-electrode contact impedance; when subject’s physical state and detecting points remain almost constant, it can indicate the relative value of skin-electrode contact impedance. In method two, two electrodes are placed close enough to each other on the skin under the premise of no contact, and the voltage value between the two electrodes, which is exactly the interference and noise signal caused by the skin-electrode contact impedance, is directly measured with NI PCI4461. Amplitudes of the measured voltages are also used to evaluate different skin pretreatment methods. Through performing experiments on ten subjects in these two methods and evaluating the results of these two methods, obvious differences in effect between 6 different skin pretreatments have been shown, and their performance ranking has been given.
Key words
biopotential, measurement, skin pretreatment, comparison
Introduction
Body surface biopotential measurements, such as ECG, EEG, EMG, etc., are becoming more and more widely used in our lives. Actually, there are a variety of seen skin pretreatments for measurements. From hospital we learn that, as for measuring ECG, some people directly place electrodes on bodies without doing any skin treatments for convenience; some people, with a bit more particular cares, clean the skin of the measuring position with 75% alcohol before arranging electrodes; there are also some more careful testers, who always abrade the skin with fine sandpaper or abrasion paste to remove the stratum cornea and then place electrodes. The representative skin pretreatment methods used in the actual clinical measurements and experimental researches are shown in Table 1.
Table 1. Representative skin pre-treatment methods
|
(1)
|
No pretreatment
|
|
(2)
|
Cleaning skin with alcohol
|
|
(3)
|
Spreading saline on skin
|
|
(4)
|
Rubbing skin with sandpaper
|
|
(5)
|
Cleaning skin with alcohol and spreading saline
|
|
(6)
|
Rubbing skin with sandpaper and spreading saline
|
Are various skin surface pretreatments really necessary to biopotential measurements, and what are the differences in effect between these skin treatment methods? These questions need the answers from experimental test and quantitative comparison. YH Chen invented a kind of polymer-based dry electrodes for high user comfort and tested its use, finding that skin pretreatment with abrasive rubbing and gel swabbing can reduce the impedance obviously [1]. To find out if ECG electrodes with appropriate skin pretreatments can substitute for EEG electrodes, Literature [2,3] tested the impedances under two different skin pretreatments: (1) alcohol skin cleaning, (2) alcohol skin cleaning and abrasive rubbing. The result is that the latter pretreatment is better, with which ECG electrodes can be used for EEG measurement. However, to our best knowledge, profound comprehensive test and comparison of representative skin pretreatments have never been done yet.
This paper designed two methods to test and compare the 6 representative skin pretreatment methods quantificationally. The second part of this article introduces the first method, measuring human body output impedances [4-9] under 6 pretreatments and indirectly illustrating their magnitudes of contact impedances between skin and electrode. Section 3 describes another method, placing two electrodes on the skin ensuring one close enough to the other under the premise of no contact, and directly measuring their voltage value by a biopotential acquisition system to evaluate the different skin pretreatment methods. Section 4 is the conclusion.
Method one
Principle
Different skin pretreatment results in different skin-electrode impedance or different electrical contact between skin and electrode. The lower skin-electrode impedance, the better quality of the detected bio-electricity signal [2]. Theoretically, we can test and compare the 6 skin pretreatments by comparing their skin-electrode impedances. The problem is that it is difficult to test skin-electrode impedance directly.
However, as we know, the recorded human body impedance always includes two parts, internal human body impedance and skin-electrode impedance [10-15]. Since the internal human body impedance is changeless under certain condition, the distinctions of measured human body impedances must demonstrate the distinctions of skin-electrode impedances for different skin pretreatments.
For a biopotential acquisition system, the internal human body impedance and skin-electrode impedance might as well be collectively referred to as human body output impedance (HBOI). HBOI changes with the frequency of excitation signal. Considering that the energy of most physiological signals is centralized in low frequency band, this study mainly explores HBOIs in frequency range of 0.1 Hz-1000 Hz.
Experiment
No matter what HBOI to be measured is inductive or capacitive, we regard it as a black box temporarily, marked as R+jX, shown as Figure 1. In Figure 1, the human body, a resistance R0 with the standard value of 10 kΩ, and the excitation signal complete a series circuit. Compared to the excitation signal, our body’s internal biopotential is so weak that it is ignored. Polarization voltage, which is near direct, is also left out of account because what we measured here is AC HBOI.
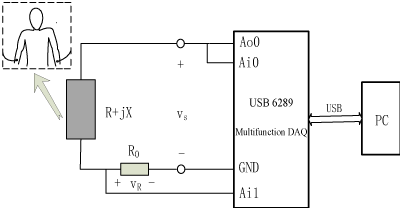
Figure 1. Schematic of human body output impedance measuring
The HBOI measuring system is composed of a multifunction DAQ device 6289 [16] produced by National Instruments and a personal computer. The DAQ device 6289 which acts as excitation source and data acquisition module simultaneously, communicates with the PC machine via a dedicated USB cable. Equipped with the LabVIEW program on PC, the analog output Ao0 of 6289 provides a sinusoidal voltage excitation with the amplitude of 1V (secure enough to human body), while, from analog input port Ai0 and Ai1, it is performed the synchronous acquisition of voltage excitation and resistance voltage with the same sampling rate of 10kHz. It is easy for us to accurately calculate and record the amplitude, frequency and phase information of the two sine signals from Ai0 ( ) and Ai1 ( ). The PC machine also can automatically change the frequency of excitation signal .
Suppose that with an excitation sine wave of frequency f Hz, the amplitudes and phases of the measured voltage signal and are . This means that we will have the resistance voltage for the excitation signal . According to the principle of voltage divider, we also have equation (1). Furthermore, the calculation formula of HBOI is finally obtained, shown as (2):
In equation (2), is the phase difference between excitation signal and resistance voltage , i.e., .
In order to investigate the effects of different kinds of skin surface pretreatment methods on HBOI, hundreds of experiments were carried out on 10 healthy adults. We used three types of emblematic electrodes [17]: Nihon Kohden’s standard limb clamp-electrode (with the model number of SF450), silicone ball-electrode (pz26) and MEDITRACE adhesive electrode (200) produced by American Kendall. Six skin surface pretreatments mentioned above were adopted on each kind of electrodes [18] conditions of experiments were made up with these three kinds of electrodes and six skin pretreatments. The forearms of test subjects were selected due to operating convenience.
The experimental procedure using clamp-electrode, for example, can be described as: (1) Seat the test subject by the experimental desk with her/his inner forearm upward on the desktop and then connect the circuit according to Figure 1; (2) Clamp one electrode holder on each arm, keeping its metal side close to the skin surface, then start the LabVIEW software and record and calculate the information of voltage and ,repeat 10 times for each frequency; (3) At the same position of step 2, wipe the skin with alcohol-soaked swab for a clean thumb-sized area, then place the clamp-electrode there in the same way after alcohol is evaporated and then record 10 sets of data for each frequency; (4) Spread normal saline on skin surface of a new test site near the position in step 3, then place the clamp-electrode and record 10 sets of data; (5) Gently rube skin with water-soaked 5000 sandpaper at a new location in a small area, then place the clamp-electrode and record 10 sets of data; (6)Spread normal saline at the position of step 3, then place the clamp-electrode and record 10 sets of data; (7) Spread normal saline at the position of step 5,then place the clamp-electrode and record 10 sets of data.
In order to avoid cross interaction, the electrodes used in the experiments of alcohol should not be used in the experiments of saline any more during the course of the experiment and vice versa; Rubbing with alcohol or sandpaper can remove cuticle to different levels, so we should better not perform these two experiments at one point on the premise that conditions of different skin surface in small scale are comparable so that it does not affect the results of experiment.
Results
As mentioned above, for each subject’s each experiment condition we recorded 10 sets of data, and for each set of data, HBOI at every frequency point was figured out according to equation 2 with the solved amplitude and phase of the corresponding and . Then, we performed statistical analysis to all obtained HBOI values-calculating the average and range of the 10 sets of impedances under each experiment condition. One subject’s average and range change curves of measured HBOIsfor different pretreatments with clamp-electrode are plotted in Figure 2.
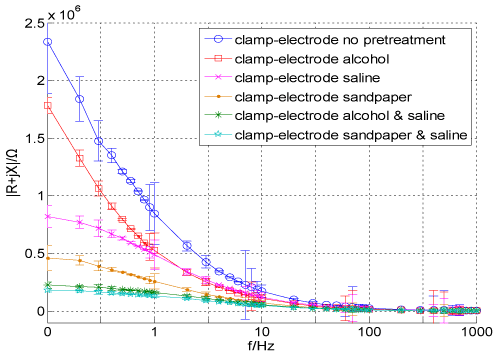
Figure 2. HBOI change curves for6 skin pre-treatments using clamp-electrode
In order to illustrate all subjects’ differences of HBOIs between six skin pretreatment methods, we calculated the average value of HBOI amplitudes of 0.1 Hz-1000 Hz in each pretreatment condition, shown as Table 2. For the sake of contrastive analysis, line charts of data in Table 2 were also drawn in Figure 3.
Table 2. Average HBOI Amplitudes (Ω)
(Ω)
|
Skin Pre-treatment
|
Subject Number
|
|
I
|
II
|
III
|
IV
|
V
|
VI
|
VII
|
VIII
|
IX
|
X
|
|
Clamp-electrode
|
(1)
|
573k
|
339k
|
335k
|
569k
|
267k
|
358k
|
736k
|
429k
|
439k
|
384k
|
|
(2)
|
275k
|
318k
|
219k
|
240k
|
118k
|
260k
|
485k
|
273k
|
293k
|
219k
|
|
(3)
|
187k
|
281k
|
107k
|
173k
|
77k
|
133k
|
406k
|
176k
|
227k
|
153k
|
|
(4)
|
109k
|
97k
|
85k
|
77k
|
59k
|
109k
|
188k
|
130k
|
125k
|
66k
|
|
(5)
|
41k
|
73k
|
27k
|
48k
|
56k
|
31k
|
183k
|
108k
|
76k
|
19k
|
|
(6)
|
26k
|
18k
|
17k
|
22k
|
22k
|
6k
|
67k
|
47k
|
63k
|
14k
|
|
Ball-electrode
|
(1)
|
2274k
|
451k
|
531k
|
1223k
|
628k
|
721k
|
1899k
|
736k
|
1335k
|
342k
|
|
(2)
|
783k
|
315k
|
448k
|
470k
|
484k
|
386k
|
551k
|
585k
|
937k
|
185k
|
|
(3)
|
513k
|
118k
|
223k
|
420k
|
269k
|
319k
|
492k
|
419k
|
556k
|
158k
|
|
(4)
|
434k
|
108k
|
206k
|
360k
|
238k
|
217k
|
353k
|
232k
|
252k
|
125k
|
|
(5)
|
160k
|
41k
|
148k
|
125k
|
121k
|
188k
|
203k
|
215k
|
128k
|
65k
|
|
(6)
|
33k
|
28k
|
44k
|
50k
|
100k
|
36k
|
152k
|
159k
|
52k
|
37k
|
|
Adhesive electrode
|
(1)
|
797k
|
924k
|
710k
|
543k
|
609k
|
758k
|
721k
|
840k
|
702k
|
380k
|
|
(2)
|
561k
|
650k
|
493k
|
508k
|
405k
|
714k
|
648k
|
546k
|
408k
|
263k
|
|
(3)
|
347k
|
502k
|
155k
|
327k
|
183k
|
192k
|
281k
|
280k
|
359k
|
151k
|
|
(4)
|
105k
|
148k
|
98k
|
198k
|
133k
|
167k
|
278k
|
175k
|
217k
|
73k
|
|
(5)
|
103k
|
79k
|
37k
|
90k
|
112k
|
55k
|
151k
|
146k
|
196k
|
47k
|
|
(6)
|
78k
|
33k
|
20k
|
34k
|
58k
|
15k
|
126k
|
110k
|
134k
|
26k
|
Table 3. Peak-to-peak values of interference and noise voltages (mV)
|
Skin Pre-treatment
|
Subject Number
|
|
I
|
II
|
III
|
IV
|
V
|
VI
|
VII
|
VIII
|
IX
|
X
|
|
Clamp-electrode
|
(1)
|
5.16
|
3.18
|
3.15
|
5.14
|
2.4
|
3.87
|
6.13
|
4.39
|
4.4
|
3.87
|
|
(2)
|
2.65
|
2.78
|
2.19
|
2.37
|
1.2
|
2.3
|
4.93
|
2.65
|
2.71
|
2.32
|
|
(3)
|
1.58
|
2.48
|
1.17
|
1.4
|
1
|
1.28
|
4.32
|
1.4
|
2.33
|
1.36
|
|
(4)
|
1.19
|
1.13
|
1.12
|
1
|
0.96
|
1.15
|
1.59
|
1.32
|
1.3
|
0.97
|
|
(5)
|
0.89
|
1.09
|
0.65
|
0.94
|
0.95
|
0.75
|
1.56
|
1.14
|
0.99
|
0.51
|
|
(6)
|
0.64
|
0.55
|
0.5
|
0.64
|
0.63
|
0.4
|
0.97
|
0.93
|
0.96
|
0.46
|
|
Ball-electrode
|
(1)
|
11.7
|
4.88
|
5.06
|
10.97
|
6.04
|
6.12
|
11.4
|
6.13
|
11.1
|
3.19
|
|
(2)
|
6.16
|
3.06
|
4.4
|
5.06
|
4.92
|
3.9
|
5.08
|
5.2
|
8.9
|
1.58
|
|
(3)
|
5.07
|
1.22
|
2.24
|
4.37
|
2.41
|
2.8
|
4.95
|
4.36
|
5.09
|
1.36
|
|
(4)
|
4.38
|
1.17
|
2.01
|
3.89
|
2.35
|
2.21
|
3.2
|
2.35
|
2.45
|
1.29
|
|
(5)
|
1.31
|
0.9
|
1.31
|
1.2
|
1.23
|
1.7
|
2
|
2.1
|
1.31
|
0.96
|
|
(6)
|
0.76
|
0.75
|
0.95
|
1
|
1.1
|
0.78
|
1.35
|
1.36
|
0.95
|
0.85
|
|
Adhesive electrode
|
(1)
|
6.44
|
8.81
|
6.3
|
5.09
|
5.94
|
6.15
|
6.12
|
7.3
|
6.28
|
3.86
|
|
(2)
|
5.08
|
6.07
|
5
|
4.98
|
4.07
|
6.11
|
6.06
|
5.11
|
4.3
|
2.63
|
|
(3)
|
3.75
|
5.01
|
1.33
|
2.85
|
1.5
|
1.98
|
2.68
|
2.67
|
3.87
|
1.35
|
|
(4)
|
1.17
|
1.23
|
1.12
|
1.99
|
1.22
|
1.38
|
2.66
|
1.43
|
2.31
|
0.98
|
|
(5)
|
1.15
|
1.05
|
0.85
|
1.12
|
1.2
|
0.94
|
1.35
|
1.3
|
2
|
0.93
|
|
(6)
|
1.02
|
0.77
|
0.6
|
0.78
|
0.99
|
0.5
|
1.3
|
1.17
|
1.23
|
0.65
|
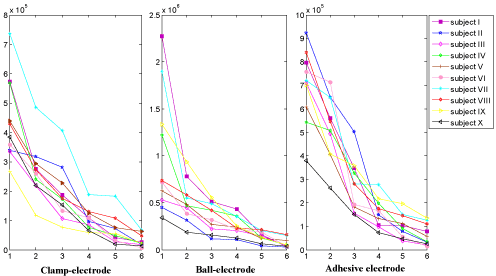
Figure 3. Line charts of average HBOI Amplitudes
By comparing the HBOI values and charts under 6 pretreatment methods in Table 2 and Figure 3, we can find that any pretreatments can reduce the output impedance to certain extent; the two pretreatments smearing saline after cleaning with alcohol and smearing saline after gently rubbing with sandpaper can reduce impedance amplitudes most of all. For instance, the average HBOI amplitudes after 6 pretreatment methods using clamp-electrode for subject I are accordingly 573 kΩ, 275 kΩ, 187 kΩ, 109 kΩ,41 kΩ, 26 kΩ, and the largest reduction of average value is 573 kΩ-26 kΩ=547 kΩ.
This shows: (1) the skin-electrode impedances are much different for 6 pretreatment methods; (2) the average value of internal human body impedance in frequency 0.1 Hz to1000 Hz must be smaller than 26 kΩ; (3) the output impedance difference of 547 kΩ is mainly caused by the difference of skin-electrode impedance, which demonstrates that skin-electrode impedance among the human body output impedance may be much larger than internal human body impedance. Therefore, we must attach importance to the pretreatment of skin surface to ensure a good contact between skin and electrode.
Method two
Principle
Figure 4 gives equivalent interference and noise model respectively. According to the equivalent external interference model as shown in Figure 4(a), external interference sources, including high voltage grid, electrical equipment, radio, lightning phenomena of nature and so forth [18], leak into bioelectrical amplifier via voltage dividing of a parallel impedance composed of the input resistance of amplifier (Ri) and HBOI (R+jX). Since Ri is always higher than 109 ohm, the interference received by the amplifier, at the input terminal, is proportional to the size of HBOI. According to the equivalent interior noise model shown in Figure 4(b), the interior noise current caused by the circuit itself passes through the HBOI and flows back to bioelectrical amplifier, which also produces an unwanted noise voltage proportional to the size of HBOI.
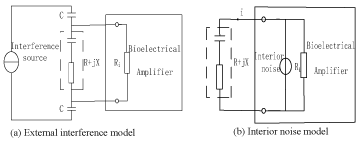
Figure 4. Equivalent interference and noise model
(a) External interference model
(b) Interior noise model
According to the above, we can evaluate different skin pretreatment methods by recording the interference and noise voltage in the biopotential acquisition system. Choose two test points which are close enough on the subjects’ skin, then put an electrode on each point and connect them into the biopotential acquisition system. By now, the influences of body biopotential and human internal impedance on pretreatment evaluations are ruled out, since biopotential electrical potential difference between two close test points is approximately 0 and the human internal impedance is small when two test points are close enough
Experiment
Here are the concrete implementation steps: (1) Seat a subject relaxed at the experimental desk with his/her inner forearm upward on the desktop, then choose two close points whose distance is about 5cm on the inside surface of right arm as measuring points and get a biopotential acquisition system ready; (2) Pretreat skin surface according to the skin pretreatment method awaiting assessment, then place an electrode to each measuring point selected in step (1), and access them to the Ai port of the biopotential acquisition system; (3) Record the voltage data for 24 s as txt format; (4) Calculate peak-to-peak value of the recorded voltage data for evaluation, and the smaller the peak-to-peak value means the smaller the interference and noise. In above steps, the biopotential acquisition system is constructed with NI PCI4461 card and a computer. Flow chart of this evaluation method is shown in Figure 5 and Figure 6. Following the scheme provided above, we tested 10 healthy adults in total.

Figure 5. Flow chart of method two
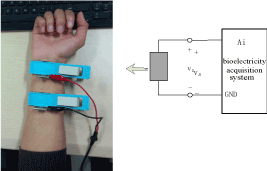
Figure 6. Schematic of interference and noise voltage measuring
Result
Interference and noise voltage signal, according to the principle mentioned above, increase with skin-electrode impedance. In this case, value orders of the recorded voltage of 6 different kinds of skin surface pretreatment should be constants with that of HBOI. Figure 7 showed the recorded voltage oscillogram of one subject using ball-electrodes. Six curves correspond to the skin pretreatment method (1) to method (6) in Table 1, respectively. Obviously, the interference and noise generated by different pretreatment methods are different.
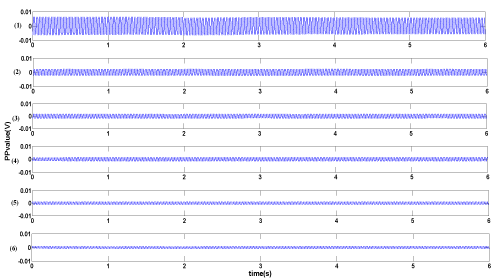
Figure 7. Voltage oscillogram of one subject using ball-electrode
The recorded voltage signals of each experiment situation were divided into 10 equal length groups. We calculated the peak-to-peak values of each groups and then took the median of 10 peak-to-peak values as the final result, which is shown in Table 3. Comparing Table 2 and Table 3, with the correlation coefficient of two groups of data being 0.926, apparently, the rule of voltage values achieved in this method and the rule of impedance values in method one is fully consistent.
Discussion
Interference is mainly composed of 50 Hz signal and its harmonic waves, which are easy to be removed. However, other interference and noise signals are too complex to remove. Though the other interference and noise signals may be as small as only hundreds or even tens of μV, as shown in Table 4, it certainly has little effects on adult ECG [19] whose amplitude is about several mV, nevertheless, for noninvasive fetal ECG [20] or EEG acquisition, this noise cannot be neglected, which will influence fetal ECG or EEG extraction severely.
Table 4. Peak-to-peak values of residual voltages after removing 50 Hz signal and its harmonic waves (μV)
|
Skin Pre-treatment
|
Subject Number
|
|
I
|
II
|
III
|
IV
|
V
|
VI
|
VII
|
VIII
|
IX
|
X
|
|
Clamp-electrode
|
(1)
|
517
|
600
|
373
|
684
|
224
|
425
|
562
|
107
|
691
|
532
|
|
(2)
|
463
|
120
|
327
|
646
|
151
|
142
|
172
|
588
|
506
|
217
|
|
(3)
|
256
|
91
|
241
|
173
|
603
|
178
|
160
|
147
|
136
|
143
|
|
(4)
|
332
|
124
|
191
|
129
|
603
|
147
|
167
|
268
|
144
|
53
|
|
(5)
|
77
|
114
|
131
|
164
|
603
|
101
|
117
|
164
|
40
|
102
|
|
(6)
|
77
|
432
|
154
|
105
|
603
|
98
|
547
|
84
|
105
|
85
|
|
Ball-electrode
|
(1)
|
1500
|
1900
|
837
|
754
|
928
|
1000
|
880
|
954
|
303
|
435
|
|
(2)
|
195
|
1600
|
706
|
689
|
306
|
480
|
269
|
520
|
266
|
367
|
|
(3)
|
208
|
128
|
214
|
501
|
220
|
386
|
332
|
206
|
137
|
134
|
|
(4)
|
249
|
595
|
524
|
246
|
441
|
317
|
662
|
414
|
297
|
114
|
|
(5)
|
149
|
195
|
195
|
178
|
308
|
126
|
323
|
737
|
105
|
218
|
|
(6)
|
118
|
162
|
181
|
80
|
226
|
130
|
303
|
180
|
105
|
126
|
|
Adhesive electrode
|
(1)
|
338
|
435
|
560
|
850
|
347
|
999
|
804
|
482
|
516
|
450
|
|
(2)
|
204
|
839
|
479
|
726
|
281
|
258
|
468
|
481
|
826
|
759
|
|
(3)
|
150
|
150
|
222
|
501
|
443
|
506
|
443
|
324
|
151
|
140
|
|
(4)
|
280
|
136
|
348
|
190
|
438
|
218
|
425
|
497
|
96
|
118
|
|
(5)
|
220
|
739
|
298
|
251
|
226
|
180
|
267
|
221
|
87
|
188
|
|
(6)
|
109
|
181
|
209
|
213
|
345
|
2021 Copyright OAT. All rights reserv
123
|
345
|
313
|
142
|
62
|
Conclusion
With two particularly designed methods and a large amount of experiments for 6 skin pretreatments, we may safely draw the conclusions that: (1) skin pretreatment is vital to biopotential signal acquisition and should be given more attentions clinically and in experimental study; (2) The skin-electrode impedances for 6 skin pretreatments are quite different; some are as great as thousands of kilohms and some are only tens kilohms, (3)without considering the factors such as time-consuming, the descending performance sequence of 6 skin pretreatments is: smearing saline after gently rubbing with sandpaper, smearing saline after cleaning with alcohol, rubbing skin with sandpaper, spreading saline on skin, cleaning skin with alcohol, and lastly no pretreatment.
Conflict of interest
The authors have no conflict of interests to be declared.
Ethical approval
Ethical approval for experiment was given by School of Electronic Science and Engineering, Nanjing University.
Acknowledge
This paper is supported by the National Natural Science Foundation of China (61271079).
References
- Chen YH, Op de Beeck M, Vanderheyden L, Mihajlovic V, Grundlehner B, et al. (2013) Comb-shaped Polymer-based Dry Electrodes for EEG/ECG Measurements with High User Comfort. Conf Proc IEEE Eng Med Biol Soc 2013: 551-554. [Crossref]
- Seitsonen E, Yli-Hankala A, Korttila K (2000). Are electrocardiogram electrodes acceptable forelectroencephalogram bispectral index monitoring? Acta Anaesthesiol Scand 44: 1266-1270. [Crossref]
- Hemmerling TM, Harvey P (2002) Electrocardiographic electrodes provide the same results as expensive special sensors in the routine monitoring of anesthetic depth. Anesth Analg 94: 369- 371. [Crossref]
- Beetner DG, Kapoor S, Manjunath S, Zhou X, Stoecker WV (2003) Differentiation Among Basal Cell Carcinoma, Benign Lesions, and Normal Skin Using Electric Impedance. IEEE Trans Biomed Eng 50: 1020-1025. [Crossref]
- Beetner DG, Kapoor S, Manjunath S, Zhou X, Stoecker WV (2003) Differentiation among basal cell carcinoma, benign lesions, and normal skin using electric impedance. IEEE Trans Biomed Eng 50: 1020-1025. [Crossref]
- Jaffrin MY, Moreno MV (2007) Measurements of total body water with a foot-to-foot impedance meter. Med Eng Phys 30: 483- 486.
- Rothlingshofer L, Ulbrich M, Hahne S, Leonhardt S (2011) Monitoring Change of Body Fluid during Physical Exercise using Bioimpedance Spectroscopy and Finite Element Simulations. J Electr Bioimp 2: 79-85.
- [Crossref] Pollard AE, Barr RC (2013) A new approach for resolution of complex tissue impedance spectra in hearts. IEEE Trans Biomed Eng 60: 2494-2503.
- Rahman T, Hasan MM, Farooq A, Uddin MZ (2013) Extraction of cardiac and respiration signals in electrical impedancetomography based on independent component analysis. J Electr Bioimp 4: 38-44.
- Coffman FD, Cohen S (2012) Impedance measurements in the biomedical sciences. Stud Health Technol Inform 35: 185-205. [Crossref]
- Medrano G, Eitner F, Walter M, Leonhardt S (2010) Model-based correction of the influence of body position on continuous segmental and hand-to-foot bioimpedance measurements. Med Biol Eng Compute 48: 531-541.
- Kyle UG, Bosaeus I, De Lorenzo AD, Deurenberg P, Elia M, et al. (2004) Bioelectrical impedance analysis-part I: review ofprinciples and methods. Clin Nutr 23: 1226-1243. [Crossref]
- Jafarpoor M, Li J, White JK, Rutkove SB (2013) Optimizing Electrode Configuration for ElectricalImpedance Measurements of Muscle via the Finite Element Method. IEEE Trans Biomed Eng 60: 1446-1452. [Crossref]
- Tan CT, Svirsky M, Anwar A, Kumar S, Caessens B, et al. (2013) Real-time measurement of electrode impedance during intracochlear electrode insertion. Laryngoscope 123: 1028-1032. [Crossref]
- White EA, Horne A, Runciman J, Orazem ME, Navidi WC, et al. (2011) On the correlation between single-frequency impedance measurements and human skin permeability to water. Toxicol In Vitro 25: 2095-2104. [Crossref]
- Buendia R, Gil-Pita R, Seoane F (2011) Cole Parameter Estimation from the Modulus of the Electrical Bioimpedance for Assessment of Body Composition. A Full Spectroscopy Approach. J Electr Bioimp 2: 72-78.
- Rahal M, Khor JM, Demosthenous A, Tizzard A, Bayford R. (2009) A comparison study of electrodes for neonate electrical impedance tomography. Physiol Meas 30: 73-84. [Crossref]
- Wegmueller MS, Oberle M, Felber N, Kuster N, Fichtner W (2010) Signal Transmission by Galvanic CouplingThrough the Human Body. IEEE Trans Biomed Eng 59.
- [Crossref] Meziane N, Webster JG, Attari M, Nimunkar AJ (2013) Dry electrodes for electrocardiography. Physiol Meas 34: R47-69.
- Min ZJ, Qun G, Ming TL, Bing LT, Xing LH, et al. (2014) Position difference regularity of corresponding R-wave peaks for maternal ECG components from different abdominal points. Chin Phys B 23: 018701.


