Abstract
The aim of this pilot study is to evaluate and compare the quality of the genomics and proteomics data obtained from paired Formalin Fixed Paraffin Embedded (FFPE) and frozen (FF) tissue percutaneous core biopsies of LIRADS 5 hepatocellular carcinoma (HCC) of varying histological grade. The preliminary data identified differentially expressed proteins and genes in poor, moderate and well differentiated HCC biopsies, with a greater efficacy in fresh frozen samples. The data offered valuable insights into the characteristics and suitability of samples for future studies.
Keywords
Liver HCC, radioproteomics, radiogenomics, biomarkers
Introduction
Hepatocellular Carcinoma (HCC) is the most common liver cancer and it’s the leading cause of cancer-related deaths worldwide. HCC patients do not respond to most systemic therapies [1,2].
Current diagnostic tests are blood, imaging, and biopsy, with no useful predictive biomarkers. Very few proteomics biomarkers have been studied for liver HCC and their correlation to clinical behavior and response to therapy is limited [3-5]. Targeted therapy is also not available which limits the potential of personalized therapy for HCC patients. Therefore, we aim to analyze the tissue biopsies of HCC patients of different grades, using proteomics and genomics analysis, and combine it with our imaging CT/MRI data (radiomics) to generate radioproteomics and radiogenomics data to better predict HCC subtypes and ultimately offer personalized medicine for HCC patients.
Most of the tissue biopsies, in most clinics, are stored as FFPE, which is the standard method used by pathologists to make diagnosis. However, comparison studies of other type of cancer tissues, suggested that using FF tissues have advantages over FFPE, such as: proteins/ DNA/ RNA are better preserved, the variability if FF tissues are lower than FFPE tissues which can affect the data quality, and FF samples can be stored for more than 2 years with no risk of DNA/protein degradation unlike FFPE samples [6,7].
Here we report the preliminary data that we obtained by comparing three paired FFPE and FF tissue biopsies, derived from 18 G percutaneous biopsy of LIRADS 5 of three histological grades (well differentiated, moderate differentiated, and poorly differentiated) HCC on histology, to determine the most optimal tissue type for our larger study.
Materials and Methods
RNA-seq library construction and sequencing
RNA-seq libraries of three paired FFPE and FF tissue biopsies of three histological grades were prepared with KAPA mRNA HyperPrep Kit with RiboErase (Roche). rRNA was depleted by hybridization of complementary DNA oligonucleotides, followed by treatment with RNase H and DNase. The f first strand cDNA synthesized using random priming followed by second strand synthesis converting cDNA:RNA hybrid to double-stranded cDNA (dscDNA), and incorporating dUTP into the second cDNA strand. cDNA generation is followed by end repair to generate blunt ends, A-tailing, adaptor ligation and PCR amplification.
Sequencing was performed on Illumina NovaSeq6000 for a paired end 2x50 run. Data quality check was done on Illumina SAV. Demultiplexing was performed with Illumina software. The reads were mapped by STAR 2.7.9a [8] and read counts per gene were quantified using the human genome GRCh38.104. In Partek Flow [9], read counts were normalized by CPM +1.0E-4. Differential expression of genes was measured using the gene set enrichment (GSA) algorithm in Partek Flow, generating unfiltered as well as filtered datasets. Statistical filters for differential expression were set at fold-change > 2 and p < 0.01.
Deparaffinization of FFPE Tissues
FFPE tissue scrolls were placed in Eppendorf tubes, 1 mL of 100% xylene was added for 10 minutes to deparaffinized the tissue scrolls. Centrifuged 3 times, at 16,000 x g for 3 min, supernatant was discarded. Followed by 3 mL of 100% ethanol, for 3 min, pelleted at 16,000 x g for 3 minutes. This step was repeated an additional two times. Supernatant was discarded.
Protein digestion and TMT labelling
Fresh frozen and FFPE tissues homogenization was carried out using with12 mM sodium lauryl sarcosine, 0.5% sodium deoxycholate, and 50 mM triethyl ammonium bicarbonate TEAB, in ultrasonic cell disruptor for 20 seconds. Samples were then centrifuged at 16,000 × g for 5 min, supernatant was collected, heated at 95°C for 1 hour and sonicated for 5 minutes. The total protein concentration of the samples was determined using BCA Protein Assay Kit (Pierce, Thermo Fischer Scientific). The standard curve was generated using Bovine serum albumin. The samples were treated with tris (2-carboxyethyl) phosphine (10 μL, 55 mM in 50 mM TEAB, 30 min, 37 °C), followed by treatment with chloroacetamide (10 μL, 120 mM in 50 mM TEAB, 30 min, 25 °C in the dark). They were then diluted five-fold with aqueous 50 mM TEAB and incubated overnight with Sequencing Grade Modified Trypsin (1 μg in 10 μL of 50 mM TEAB; Promega, Cat # V511A, Madison, WI, USA), 1 μg of trypsin per sample used regardless of protein extraction yield. After digestion an equal amounts of peptides TMT were labelled and combined for MS analysis, modified protocol from Simonian, et al. [10]. An equal volume of ethyl acetate/trifluoroacetic acid (TFA, 100/1, v/v) was then added, followed by avigorous mix (5 min) and centrifugation (13,000 × g, 5 min). The supernatants were discarded, and the lower phases were dried in a centrifugal vacuum concentrator. The samples were then desalted using a modified version of Rappsilber’s, et al. protocol [11], in which the dried samples were reconstituted in acetonitrile/water/TFA (solvent A, 100 μL, 2/98/0.1, v/v/v) and then loaded onto a small portion of a C18-silica disk (3M, Maplewood, MN, USA) placed in a 200 μL pipette tip. Prior to sample loading, the C18 disk was prepared by sequential treatment with methanol (20 μL), acetonitrile/water/TFA (solvent B, 20 μL, 80/20/0.1, v/v/v), and finally with solvent A (20 μL). After loading the sample, the disc was washed with solvent A (20 μL, eluent discarded) and eluted with solvent B (40 μL). The collected eluent was dried in a centrifugal vacuum concentrator. The samples were then chemically modified using a TMT11plex Isobaric Label Reagent Set (Thermo Fisher Scientific, Cat # A34808, Waltham, MA, USA) as per the manufacturer’s protocol. The TMT-labeled peptides were dried and reconstituted in solvent A (50 μL), and an aliquot (2 μL) was taken for measurement of total peptide concentration (Pierce Quantitative Colorimetric Peptide, Thermo Fisher Scientific, Waltham, MA, USA). The samples were then pooled and desalted again using the modified Rappsilber’s protocol.
LC MS/MS
Peptides were injected onto a reverse phase nanobore HPLC column (AcuTech Scientific, C18, 1.8um particle size, 360 um x 20 cm, 150 um ID), equilibrated in solvent A (water/acetonitrile/FA, 98/2/0.1, v/v/v) and eluted (300 nL/min) with an increasing concentration of solvent B (acetonitrile/water/FA, 98/2/0.1, v/v/v: min/% F; 0/0, 5/3, 18/7, 74/12, 144/24, 153/27, 162/40, 164/80, 174/80, 176/0, 180/0) using an EASY-nLC II (Thermo Fisher Scientific). The effluent from the column was directed to a nanospray ionization source connected to a hybrid quadrupole-Orbitrap mass spectrometer (Q Exactive Plus, Thermo Fisher Scientific) acquiring mass spectra in a data-dependent mode alternating between a full scan (m/z 350-1700, Automated Gain Control (AGC) target 3 x 10⁶, 50 ms maximum injection time, FWHM resolution 70,000 at m/z 200) and up to 15 MS/MS scans (quadrupole isolation of charge states 2-7, isolation window 0.7 m/z) with previously optimized fragmentation conditions (normalized collision energy of 32, dynamic exclusion of 30 s, AGC target 1 x 10⁵, 100 ms maximum injection time, FWHM resolution 35,000 at m/z 200).
Proteomics Data Analysis
Raw proteomic data were searched against a Uniprot database containing the complete reference human proteome (ID: UP000005640, Gene Count: 20597) using SEQUEST-HT (including dynamic modifications: oxidation (+15.995) on M, deamidation (+0.984) on N/Q, and carbamidomethyl (+57.021), phosphorylation (+79.966) on S/T/Y) in Proteome Discoverer (Version 2,4, Thermo Scientific), which provided measurements of relative abundance of the identified peptides. Decoy database searching was used to generate high confidence tryptic peptides (FDR < 1%). Tryptic peptides containing amino acid sequences unique to individual proteins were used to identify and provide relative quantification between different proteins in each sample.
Results
RNA-seq identified 12,791 genes with 594 overlapping differentially expressed genes. The gene quantification efficiency of sequencing data gathered from FF was markedly higher than from FFPE tissues, with average gene counts per mapped reads of (0.61) vs (0.35) respectively (Figure 1). However, the overlapping upregulated genes in FFPE were higher than FF in the three histological grades, likely, due to tissue heat response associated with FFPE sample preparation. On histological grades comparison analysis, the overlapping upregulated genes in the moderately differentiated tissue cores were slightly higher than well differentiated tissue and markedly higher than poorly differentiated tissue cores in both FF and FFPE biopsy samples (Figures 2 and 3).
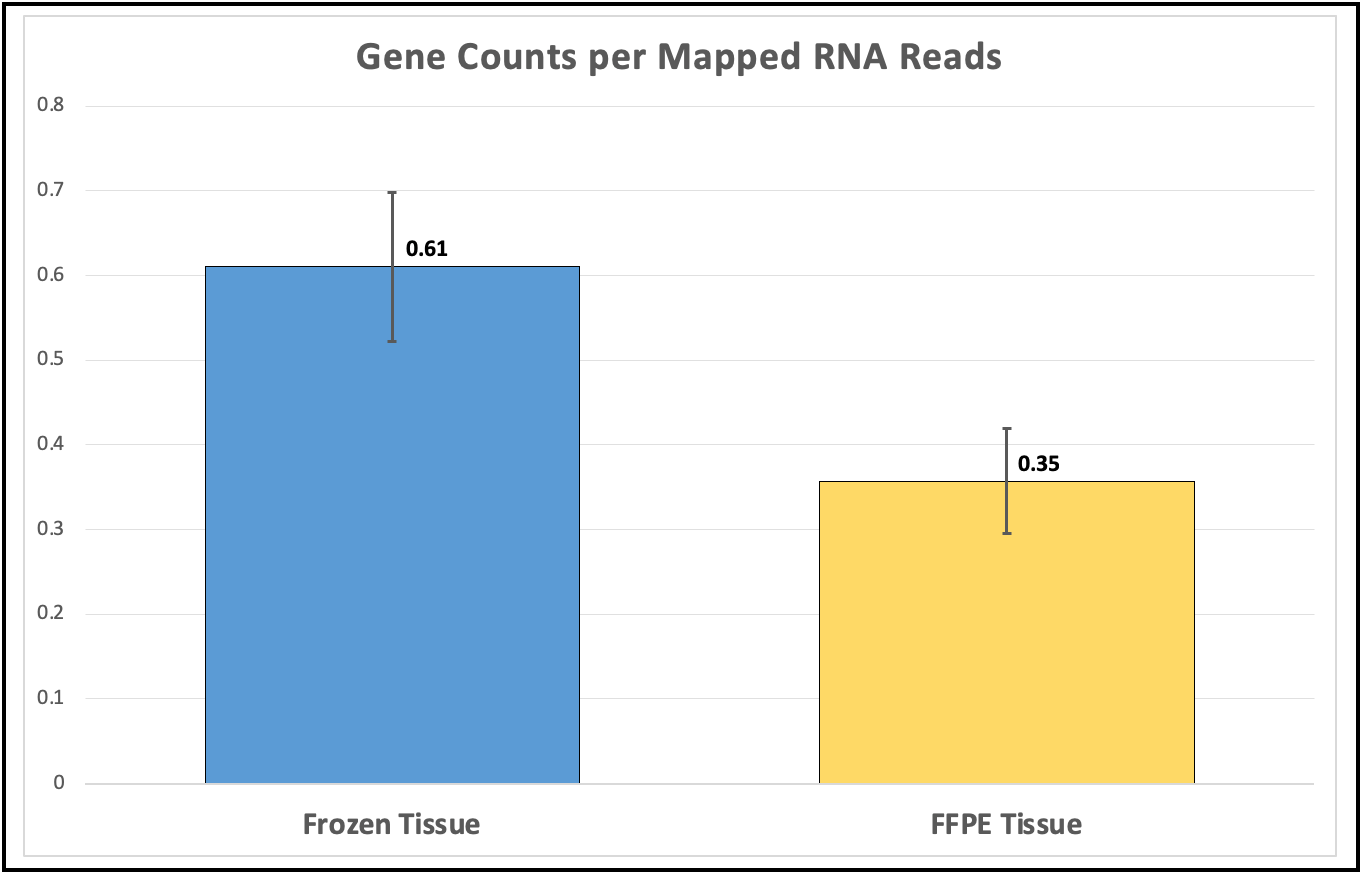
Figure 1. Higher gene counts in FF tissues over FFPE
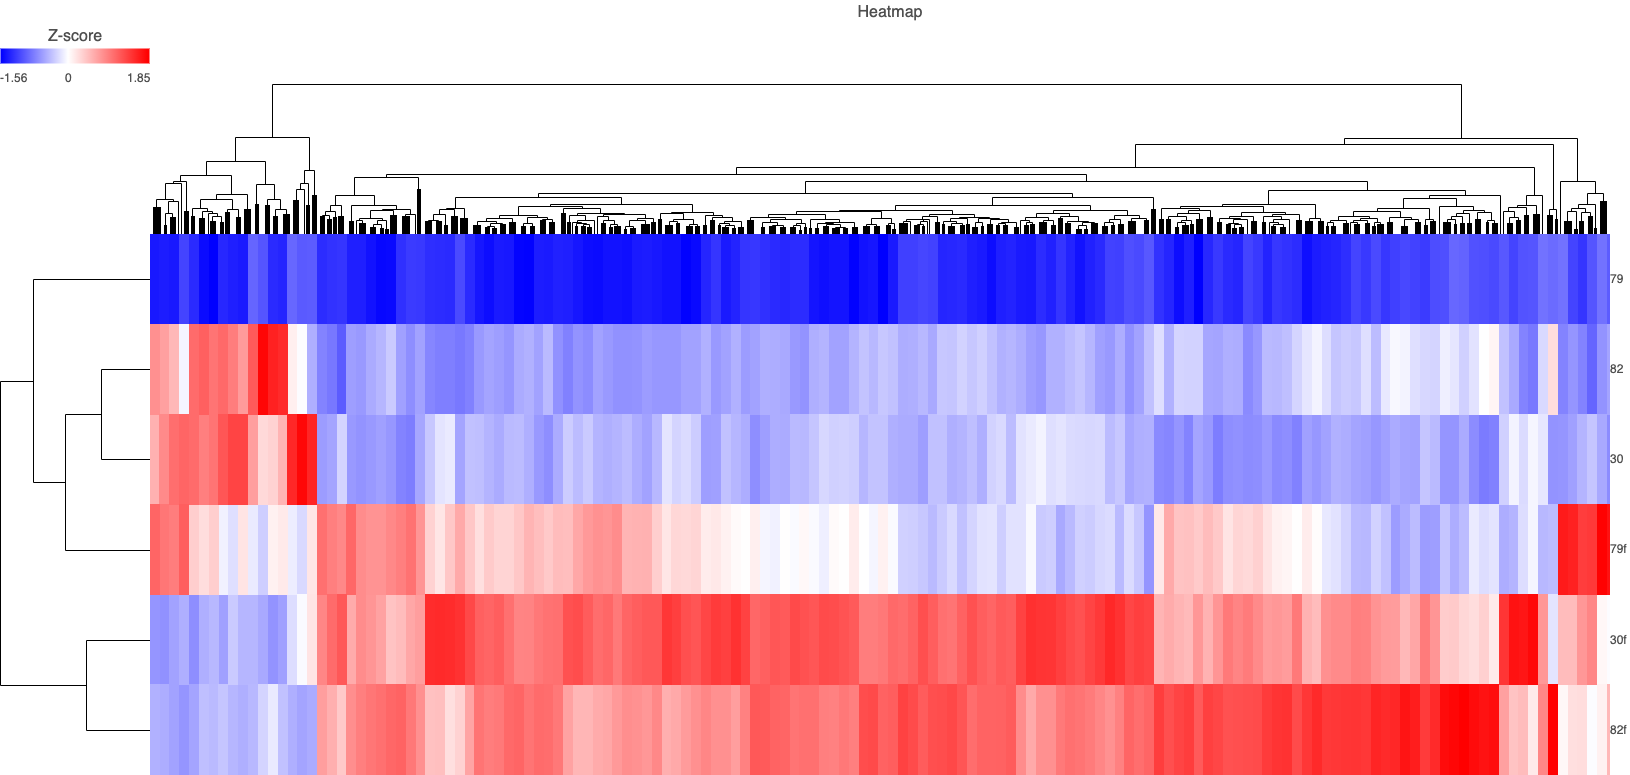
Figure 2. Heat map of overlapping genes in FFPE and FF in all phenotypes. (30 = FF moderate, 30f = FFPE moderate, 82 = FF well, 82f = FFPE well)

Figure 3. Heat map of moderate vs poor in FFPE and FF. (68 = poor, 30 = FF moderate, 30f = FFPE moderate)
From the 594 overlapping genes, 5 genes were significantly upregulated (fold-change > 2) in moderate vs well differentiated tissue cores in both FF and FFPE, with greater fold change in FF samples e.g., MBL2 expression in (moderate FF) vs (well FF) = 25-fold, while in (moderate FFPE vs (well FFPE) = 3-fold; GLUL expression in (moderate FF) vs (well FF) = 27-fold, while in (moderate FFPE vs (well FFPE) = 5-fold (Table 1).
Table 1.The significantly upregulated genes >2 fold, in moderate vs well differentiated tissue cores in both FF and FFPE, with greater fold change in FF, due to higher gene counts
|
Frozen tissues (FF) |
FFPE tissues |
Gene name |
Normalized Gene Count
moderate |
Normalized Gene Count
well |
Fold-Change (moderate vs well) |
Normalized Gene Count
moderate |
Normalized Gene Count
well |
Fold-Change (moderate vs well) |
SCD |
3280.54 |
101.16 |
32.41 |
1503.52 |
535.03 |
2.81 |
ACSL4 |
929.61 |
7.07 |
131.55 |
181.51 |
32.86 |
5.52 |
MBL2 |
392.09 |
15.94 |
24.58 |
194.96 |
65.80 |
2.96 |
RELN |
596.45 |
24.03 |
24.81 |
293.06 |
81.29 |
3.61 |
GLUL |
8238.2 |
300.55 |
27.41 |
4000.74 |
840.19 |
4.76 |
Additionally, 30 more genes were upregulated in moderate vs well differentiated in both FF and FFPE tissue cores, but with a fold-change < 2.
The proteomics data identified 466 proteins in FF and 321 proteins in FFPE, with 222 overlapping differentially expressed proteins. More upregulated proteins were identified in FF vs FFPE is all phenotypes, including in the overlapping proteins, with greater fold-change in FF, due to higher concentration of proteins in Frozen tissue (Figure 4)
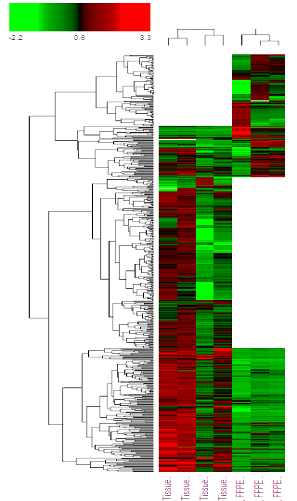
Figure 4. Heat map of all protein identified in FF and FFPE of liver HCC from proteomics analysis. The white patches indicates that proteins were not detected
Within overlapping proteins comparison analysis, many proteins were upregulated in moderate vs well differentiated tissue cores, in both FF and FFPE, (209 and 190 respectively), with a greater fold change in FF (Supplementary Table 2).
Table 2. Some of the upregulated proteins >1 fold, in (poor vs moderate) and (poor vs well) differentiated of the frozen tissues FF
Protein name |
fold-change |
fold-change |
| |
poor vs moderate |
poor vs well |
Aldehyde dehydrogenase |
1.34 |
1.53 |
Profilin-1 |
1.01 |
1.23 |
Actin-related protein |
1.15 |
1.11 |
Isoform of P0DMV9, Heat shock 70 |
1.12 |
1.12 |
Alpha-actinin-4 |
1.32 |
1.35 |
Isoform of P32754 |
1.10 |
1.72 |
Catalase |
1.00 |
1.98 |
Adenosyl homocysteinase |
1.07 |
1.04 |
Serine hydroxymethyl transferase |
1.49 |
1.74 |
Apolipoprotein A-I |
1.44 |
1.17 |
Glycine amidino transferase |
1.43 |
2.9 |
Myosin-9 |
1.02 |
1.06 |
Protein disulfide-isomerase A6 |
1.07 |
1.13 |
Sulfotransferase 1A1 |
1.22 |
2.27 |
Endoplasmin |
1.18 |
1.03 |
Protein disulfide-isomerase |
1.01 |
0.93 |
Isoform of P06737, Alpha-1,4 |
1.13 |
1.41 |
Additionally, 195 proteins were upregulated in poor vs moderate differentiated tissues in FF, and 214 proteins were upregulated in poor vs well differentiated tissues in FF, some of proteins are presented in Table 2, more are in supplementary Table 2.
Many of the genes and proteins identified in this study play role in cancer progression, cell proliferation and immune response.
Discussion / Conclusion
The proteomics data was in agreement with the RNA-Seq data. Both FF and FFPE can be used, with higher gene and protein quantification efficacy in the FF tissue cores.
Furthermore, this study revealed the relative strengths and limitations of percutaneous biopsy derived from 18 G percutaneous LIRADS 5 HCC of varying histological grade in FFPE and FF tissues for genomics and proteomics analysis, and offered valuable insights into the characteristics and suitability of samples. Understanding these aspects is crucial for making informed decisions in the planning and execution of future experiments.
While we recognize the importance of moving to proteoform analysis, the proteogenomic analytical approach used in this pilot study was only looking at correlations with RNA data. Our future study will focus on utilizing a large number of FF biopsy tissue cores and extensive proteomics and proteoforms to significantly obtain novel biomarkers to better predict HCC subtypes and their response to therapy.
Furthermore, by incorporating radiogenomics and radioproteomics, we aim to provide a comprehensive understanding of the molecular underpinnings of HCC across different radiological classifications, thus contributing valuable insights for clinical practice and research endeavors.
Supplementary Materials
The following supporting information can be downloaded at: www.mdpi.com/xxx/s1, Table S1: Gene expression/counts in poor, moderate and well differentiated samples in FF and FFPE. Table S2: Protein abundances, and upregulation radios in in poor, moderate and well differentiated samples in both FF and FFPE.
Author Contributions
Conceptualization, Margaret Simonian, David Lu and Steven Raman; methodology, Margaret Simonian, Julian Whitelegge; software, Margaret Simonian, Julian Whitelegge and Whitaker Cohn; formal analysis Margaret Simonian; investigation, Margaret Simonian, David Lu, Steven Raman and Willian Hsu; resources, Steven Raman, David Lu.; data curation, Margaret Simonian.; writing—original draft preparation, Margaret Simonian; writing—review and editing, Steven Raman, Julian Whitelegge and Margaret Simonian ; supervision Steven Raman, David Lu, Margaret Simonian; project administration, Preeti Ahuja; funding acquisition, Steven Raman.
Funding
The study was funded in part by the UCLA Department of Radiological Sciences IDx program.
The study was performed under IRB waiver for retrospective analysis of acquired data.
Acknowledgments
The RNA-Seq analysis was conducted at UCLA Technology Center for Genomics & Bioinformatics (TCGB). Special thanks to Prof. Xinmin Li and Mark Duhon.
Conflicts of Interest
The authors declare no conflict of interest.
References
- Khemlina G, Ikeda S, Kurzrock R (2017) The biology of Hepatocellular carcinoma: implications for genomic and immune therapies. Mol Cancer 16: 149. [Crossref]
- Sung H, Ferlay J, Siegel RL, Laversanne M, Soerjomataram I, et al. (2021) Global Cancer Statistics 2020: GLOBOCAN estimates of incidence and mortality worldwide for 36 cancers in 185 countries. CA Cancer J Clin 71: 209-249. [Crossref]
- Gao Q, Zhu H, Dong L, Shi W, Chen R, et al. (2019) Integrated Proteogenomic Characterization of HBV-Related Hepatocellular Carcinoma. Cell 179: 561-577. [Crossref]
- Charlotte K Y Ng, Dazert E, Boldanova T, Coto-Llerena M, Nuciforo S, et al. (2022) Integrative proteogenomic characterization of hepatocellular carcinoma across etiologies and stages. Nat Commun 13: 2436. [Crossref]
- Simonian M, Baquerizo A, Schaffer R, et al. (2018) Analysis of differentially expressed proteins in hepatocellular carcinoma. J Transplantation 102: S907.
- Esteve-Codina A, Arpi O, Martinez-García M, Pineda E, Mallo M, et al. (2017) A Comparison of RNA-Seq Results from Paired Formalin-Fixed Paraffin-Embedded and Fresh-Frozen Glioblastoma Tissue Samples. PLoS One 12. [Crossref]
- Gao XH, Li J, Gong HF, Yu GY, Liu P, et al. (2020) Comparison of Fresh Frozen Tissue With Formalin-Fixed Paraffin-Embedded Tissue for Mutation Analysis Using a Multi-Gene Panel in Patients With Colorectal Cancer. Front Oncol 10: 310. [Crossref]
- STAR: ultrafast universal RNA-seq aligner. A Dobin, CA Davis, F Schlesinger, J Drenkow, C Zaleski, et al.(2013) Bioinformatics 29: 15-21.
- Partek® Flow® software, v7.0 Copyright ©. 2019 Partek Inc., St. Louis, MO, USA.
- Simonian M, Shirasaki D, Lee1 VS, Bervini D, Grace M, et al. (2018) Proteomics identification of radiation-induced changes of membrane proteins in the rat model of arteriovenous malformation in pursuit of targets for brain AVM molecular therapy. Clin Proteomics 15: 43. [Crossref]
- Rappsilber J, Mann M, Ishihama Y (2007) Protocol for micro-purification, enrichment, pre-fractionation and storage of peptides for proteomics using Stage Tips. Nat Protoc 2: 1896-1906. [Crossref]