To test CODESNA_HRV, a new tool dedicated to the analysis of heart rate variability (HRV). This software computed indices aimed at evaluating the parasympathetic and sympathetic cardiac control.
Control subjects performed three active tilt-tests (8 min supine, 7 min standing, separated by 15 min) to test the reliability. They also performed a passive tilt test (8 min at 0, 30, 45 and 60°) to evaluate whether the indices highlighted subtle autonomic nervous system (ANS) changes. Finally, Controls were compared to Runners to evaluate whether an endurance training effect could be observed.
Fifteen control subjects (22±1 years, 177±7 cm, 70±6kg) and 10 high-level runners (28±7 years, 180±8 cm, and 71±4kg)
For each condition, the CODESNA_HRV indices were calculated and compared to the traditional time- and frequency-domain HRV indices calculated in accordance with the 1996 Task Force (using Kubios software). Additionally, during the passive tilt-test, 4 different durations were used for the CODESNA_HRV analysis to assess whether changing the duration modified the indices.
Results indicated that CODESNA_HRV was reliable (coefficient of variation ranging 1-10%). Changes from parasympathetic predominance when supine to sympathetic predominance when standing could not be clearly detected with CODESNA_HRV during the tilt-tests. Runners had a clear parasympathetic cardiac predominance compared to controls.
This suggests that chronic changes could be highlighted by CODESNA_HRV but more studies are needed for evaluation of acute changes. One advantage of CODESNA_HRV is that the duration of the analysed period could be changed without major impact on the indices calculated, yielding a more flexible usability.
Autonomic nervous system; cardiovascular regulation; parasympathetic; sympathetic; tilt-test.
The analysis of heart rate variability (HRV) is widely used in the field of exercise training to assess the athlete’s response to training load. HRV analysis yields insights the activity of the autonomic nervous system (ANS) known to be involved in the training response [1-2]. HRV analysis could also be used to highlight an endurance training effect, [3-4] to tailor the training program, [5]) or to avoid overreaching / overtraining [6-8].
Use of HRV analysis is possible because accurate R-R interval time-series can easily be obtained using heart rate monitors ([9-11] and free software programmes such as Kubios [12,13] enables analyses. This makes it possible to obtain traditional indices (i.e. in the time and frequency domains), such as the square root of the mean of the sum of the squared differences between adjacent normal R-R intervals (rMSSD) or high frequency power (HF), both considered to be indices of parasympathetic activity (e.g., ; [2-4], [6-8], [14-16]). However, traditional approaches, such as spectral analysis, suffer from limitations that restrict their use, or that can lead to misinterpretation [16]. For example, the stationary of the periodogram is mandatory and restricts the analysis to non-dynamic situations. In addition, only series with the same duration should be compared, [17] which is sometimes difficult to obtain during field studies or in the daily monitoring of athletes.
The aim of this study was to evaluate CODESNA_HRV, a programme dedicated to the analysis of HRV. CODESNA_HRV is proposed for use in the field of exercise physiology and/or for the monitoring of training adaptations. To this end, we compared HRV indices obtained in accordance with the 1996 Task Force [17] with those obtained using CODESNA_HRV in a 3-step procedure: 1) reliability of the indices was tested during repetition of three active tilt-tests; 2) the ability to detect small changes in ANS activity during graded orthostatic stress was tested (progressive passive tilt-test) and 3) the ANS profile of healthy subjects during an active tilt-test was compared to that of high-level endurance runners to highlight a potential training effect. The effect of the duration of the period analysed was also tested with CODESNA_HRV. The working hypothesis was that, as the reference software, CODESNA_HRV would give HRV indices able to describe the activity of the autonomic nervous system but with additional advantages, such as the possibility to compare R-R intervals time series of different durations.
Fifteen healthy man (“Controls”: 22±1 years, 177±7 cm, 70±6kg, peak oxygen uptake 52.3±8.9 mL.min-1.kg-1, performing 2.8±1.1 hours of endurance sport per week - running, cycling, and cross country skiing) and 10 high-level male endurance runners (“Athletes”: 28±7 years, 180±8 cm, and 71±4kg, peak oxygen uptake 69.1±2.6 mL.min-1.kg-1, performing 12.5±1.3 hours per week) voluntarily participated. All participants were free from injuries and cardiovascular disease and had been for the previous year. The tests were always performed in the late afternoon at the Exercise Performance Health Innovation Platform (Besançon, France) during February and March 2015. All subjects were instructed to fast for at least 3 h before testing. They were also asked to refrain from ingesting beverages containing caffeine and alcohol 24h before the tests and no heavy training session nor competition took place during the two days preceding the tests. The study protocol was conducted in accordance with international ethical standards [18].
Firstly, the 15 control subjects performed 3 active tilt-tests separated by 15 min of sitting rest, in order to evaluate the short-term reliability of the HRV analyses. On a second visit, they performed a passive tilt-test on a tilt-table to graduate the orthostatic stress [19] to assess the within-subject sensitivity of the analysis. With CODESNA_HRV, 4 durations for the HRV analysis were compared during this passive tilt-test to evaluate whether changing the duration of the period analysed would have an effect on the indices. To complete the evaluation of the sensitivity (between-subjects) and evaluate whether an endurance training effect could be detected, the HRV profile of the control subjects during the first active tilt-test was compared to that of the 10 athletes, who performed the same active tilt-test.
A Polar s810i HR monitor (Polar Electro, Tampere, Finland) was used to record the beat-by-beat (R-R) intervals [9,11]. Occasional irregularity in the form of extra or skipped heartbeats (i.e., an extra systole and subsequent compensatory pause) was identified visually and replaced manually by interpolated values for adjacent intervals as previously described [15,20,21].
Tilt-tests
The active tilt-test is used to monitor training responses [4,6,8] or for physiological purpose [22]. In the present study, the tests took place in a quiet, dimly lit room (ambient temperature 22°C to 24°C). A 15 min supine resting period was imposed before starting measurements for 8 min supine followed by 7 min standing [8].
We used a tilting table with a board as foot support for the passive tilt-test. After 15 min in the supine position, data acquisition was initiated and the control subjects were then tilted at angles chosen to graduate the orthostatic stress. Inclination of the tilt table was set for 8 min at each of the following angles, in a random order: 0°, 30°, 45° and 60° [19].
HRV Analysis
Firstly, HRV analysis was conducted in accordance with the 1996 Task Force [17] using Kubios HRV Analysis Software 2.0 for Windows (The Biomedical Signal and Medical Imaging Analysis Group, Department of Applied Physics, University of Kuopio, Finland [13]). This programme was used to perform time and frequency domain analyses of HRV [2,4,6,8,17,20]. We voluntarily restricted the analysis to the indices presented below, because of their wide use in the field of exercise. For the time domain, the root mean square of successive RR interval differences (rMSSD) and the fraction of consecutive RR intervals that differ by more than 50 ms (pNN50%), both indicators of parasympathetic activity, were calculated. In the frequency domain, the total power of HRV and the power of spectral components in the very-low (VLF: 0.00–0.04 Hz), low (LF: 0.04–0.15 Hz) and high frequencies (HF: 0.15–0.50 Hz) were reported. The physiological significance of the VLF and LF are not well defined and thus not addressed in the present study [23-25]. However, both VLF and LF were calculated in order to obtain the HF in normalized units (nu) (HFnu=HF [ms2]/(total power [ms2]−VLF [ms2]) and in percentage (HF%=HF [ms2]/total power [ms2]×100%) beyond the absolute spectral power units (ms²). HF power is almost entirely mediated by the parasympathetic activity to the sinus node directly associated with respiratory activity [26]. Finally, the LF/HF ratio was calculated as an indicator of sympathetic over parasympathetic balance [17,27] even if this interpretation should be viewed with caution [25].
Secondly, analyses were performed with CODESNA_HRV (http://www.codesna.com/en/products/codesna_hrv/). The programme is supposed to be able to assess the sympathetic and parasympathetic branches of ANS in real time and on average. In the present study, only the average evaluation during a stable condition (i.e. over a stable period of 200-400 sec) was reported to compare the results with those of Kubios. The CODESNA_HRV method is based on an analysis of heart accelerations and decelerations present in periodograms and combines the sigma-delta signal processing technique and the basic statement that when HR increases, the sympathetic action is predominant, while when HR decreases the parasympathetic activity is predominant. With this basic idea, parasympathetic (Para; ms²) and sympathetic (Ortho; ms²) indexes can be calculated.
Two other indices were directly derived from the Para and Ortho indices, namely Stress Level and Resting Factor.
Stress level is calculated as the difference between Para and Ortho, over the total power:
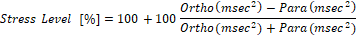
Value above 100 indicates sympathetic predominance. For a better assessment of recuperation capacity, a “Resting factor” was defined by taking into account both the level and the duration of Para and Ortho during the selected period:

Value above 1 is considered as good recuperation capacity; the higher, the better.
The duration of HRV analysis is key, and only periods of the same duration should be compared when using the traditional indices, especially those derived from spectral analysis [17]. Hence, a stable period of 300 sec [13,17,28,19] was chosen for comparisons between the two programmes. On the contrary, the duration of the analysis is claimed to have no real effect on the indexes with CODESNA_HRV. Thus we performed analyses on 270 sec, 330 sec and a “spontaneously chosen” period during the periodograms of the passive-tilt test. The “spontaneous” period was chosen subjectively on the basis of the most stable period over the periodograms [29].
Statistical analysis
Results are presented as Mean±standard deviation (SD). The reliability of the measures over the passive tilt-tests was tested using a one-way ANOVA with repeated measures. Also, we calculated the typical error of measurement (TE) expressed as coefficient of variation (CV, %). TE represents the typical amount by which a repeated measurement deviates from the true value [30] and has received growing interest in past years (e.g., [15]). During the passive tilt-test, a one-way ANOVA with repeated measures was used to highlight any difference between the different tilt angles. The effect of data duration on the CODESNA results was tested using a one-way ANOVA and the CV was also calculated. Finally, the comparison of the Control subjects and Athletes was performed using two-way ANOVA. The normality of the distributions was verified with the Shapiro-Wilk test before analysis. When data were not normally distributed, the Kruskal Wallis test was used. Statistical significance was accepted when the overall p value was <0.05 Analyses were performed using SigmaStat 12 for Windows (Systat Software Inc., San Jose, CA, USA).
Active tilt-tests in Controls (Table 1)
Table 1. Indices calculated from Kubios and CODESNA_HRV software programmes during three active tilt-tests in 15 control subjects.
|
Kubios |
CODESNA_HRV |
|
rMSSD (ms) |
pNN50 (%) |
HF (ms²) |
HF% |
HFnu |
LF/HF |
Ortho (ms²) |
Para (ms²) |
RFactor |
Stress Level (%) |
Active Tilt test |
1 |
Supine |
45±26 |
23.8±23.2 |
814±855 |
31.3±14.5 |
50.3±19.3 |
1.4±1.2 |
1471±1463 |
1439±1323 |
1.2±0.4 |
99.4±5.2§ |
Standing |
23±11* |
5.8±8.8* |
168±204* |
6.5±5.8* |
10.5±8.6* |
13.5±8.0* |
1798±1371 |
1414±969 |
0.6±0.3* |
110.3±7.7* |
2 |
Supine |
57±34 |
31.9±27.8 |
1317±1646 |
31.7±15.9 |
51.2±19.8 |
1.3±1.2 |
2215±1988 |
2148±1831 |
1.1±0.5 |
100.5±5.1 |
Standing |
27±14* |
9.3±10.8* |
244±309* |
5.4±4.3* |
8.9±7.6* |
15.7±8.5* |
2194±1199 |
1923±1060 |
0.7±0.3 |
107.1±5.3 |
3 |
Supine |
61±31 |
36.8±25.7 |
1169±1229 |
31.1±16.7 |
49.7±17.0 |
1.2±0.7 |
1972±1344 |
2095±1371 |
1.6±0.9 |
96.2±4.4§ |
Standing |
34±17* |
14.1±13.2* |
343±381* |
5.7±4.4* |
10.4±8.7* |
13.6±8.7* |
2782±1487 |
2389±1225 |
0.8±0.6* |
107.2±8.3* |
CV (%) Supine |
8.9±9.1 |
7.5±1.3 |
5.4±7.2 |
4.2±2.4 |
5.7±3.0 |
2.6±1.2 |
3.7±3.7 |
3.4±2.3 |
5.7±7.0 |
30.8±15.4 |
CV (%) Standing |
16.4±41.6 |
1.8±1.3 |
4.0±4.5 |
6.0±7.7 |
5.5±5.5 |
5.1±5.0 |
4.0±2.4 |
5.8±8.5 |
4.8±3.1 |
39.6±32.8 |
*= significantly different from Supine at the p<0.05 level. §= significantly different from tilt-test number 2 in the same position, at the p<0.05 level.
RR intervals significantly decreased when changing from Supine to Standing during tilt-test number 1 (from 988±133 to 742±115 ms), 2 (from 1053±141 to 774±114 ms) and 3 (from 1015±193 to 765±137 ms). No significant difference in the R-R intervals duration was observed between the three tilt-tests neither supine (p=0.146) nor standing (p=0.296).
Whatever the tilt-test, a significant decrease in rMSSD, pNN50, HFms², HF% and HFnu was observed with a significant increase in LF/HF. No significant differences were observed between the three active tilt-tests as regards rMSSD, pNN50, HF ms², HF%, HFnu and LF/HF both Supine (all p > 0.498) and Standing (all p> 0.119). The CV were between 2.6 and 8.9% supine and between 1.8 and 16.4% standing.
With CODESNA_HRV, a trend for an increase in Ortho and a decrease in Para were observed when changing from Supine to Standing, without reaching the significant level. Significant decrease in R factor (p=0.023) and increase in Stress level (p=0.034) with standing was observed during tilt-tests number 1 and 3, but not during tilt-test number 2. Supine, no significant differences were observed for Ortho, Para and R factor (all p>0.160) between the three tilt-tests. However, Stress level was significantly lower during tilt-test number 2 than tilt-tests number 1 and 3 (p= 0.0471 and p=0.0446, respectively). Standing, the data were not significantly different for the 4 indices (all p> 0.062). Overall, the CV were lower than for the indices derived from Kubios (close to 5%) except for Stress level, which had a CV >30%.
Passive tilt-test in Controls (Table 2)
Table 2. Indices calculated from Kubios and CODESNA_HRV software programmes during the passive tilt-test in 15 control subjects.
|
KUBIOS |
CODESNA_HRV |
|
rMSSD (ms) |
pNN50 (%) |
HF (ms²) |
HF% |
HFnu |
LF/HF |
Ortho (ms²) |
Para (ms²) |
RFactor |
Stress Level (%) |
0° |
48.8±21.2 |
28.5±21.4 |
6.4±1.2 |
34.5±11.8 |
51.7±16.2 |
1.2±0.8 |
1266±911 |
1298±870 |
1.5±0.7 |
96.9±5.2 |
30° |
38.9±17.5 |
20.2±17.9 |
6.1±1.1 |
21.8 ± 14.2 |
35.2±19.3 |
2.8±2.0 |
1459±770 |
1476±738 |
1.3±0.6 |
98.9±5.2 |
45° |
34.8±14.5 |
15.3±14.7 |
5.9±1.0 |
14.4±12.4 |
24.5±18.2 |
6.2±5.8* |
1985±1031 |
1869±963 |
1.1±0.6 |
102.1±7.5* |
60° |
25.4±11.6*§ |
7.7±11.2*§ |
5.3±0.9* |
10.1±11.1* |
17.2±14.0*§ |
8.6±6.6*§ |
1935±1658 |
1733±1711 |
0.9±0.6* |
105.8±10.7* |
*, and § = significantly different from 0° and 30°, respectively, at the p<0.05 level.
The duration of the RR intervals decreased progressively (1033±126, 937±138, 840±115 and 751±92 ms for 0, 30, 45 and 60°, respectively) but the significant level was reached only between 0 and 45°, between 0 and 60° and between 30 and 60°.
With Kubios, a trend towards a decrease was observed for the parasympathetic indices: rMSSD, pNN50 and HFnu decreased significantly between 0 and 60° and 30 and 60° while HFms² and HF% decreased significantly between 0 and 60°. On the other hand, LF/HF increased significantly between 0 and 45°, 0 and 60° and 30 and 60°.
With CODESNA_HRV, Ortho and Para indices did not change significantly (p= 0.077 and 0.404, respectively). R factor decreased significantly between 0 and 60° and between 30 and 60° while Stress level increase significantly between 0 and 45° and between 0 and 60°.
Passive tilt-test in Controls: effect of data length (Table 3)
Table 3. Effect of the duration of the analysis on the data calculated by the CODESNA_HRV software programme during the passive tilt-test in 15 control subjects.
Index |
Angle |
Comparison |
Mean± |
SD |
Index |
Angle |
Comparison |
Mean± |
SD |
Ortho (ms²) |
0° |
270 vs 300 sec |
-0.2± |
5.0% |
Para (sec²) |
0° |
270 vs 300 sec |
0.0± |
4.7% |
330 vs 300 sec |
17.6± |
28.7% |
330 vs 300 sec |
17.3± |
30.1% |
Spontaneous vs 300 sec |
4.1± |
19.5% |
Spontaneous vs 300 sec |
4.0± |
20.1% |
30° |
270 vs 300 sec |
3.4± |
3.4% |
30° |
270 vs 300 sec |
2.7± |
3.8% |
330 vs 300 sec |
7.6± |
17.6% |
330 vs 300 sec |
6.3± |
16.5% |
Spontaneous vs 300 sec |
3.8± |
11.0% |
Spontaneous vs 300 sec |
3.2± |
11.5% |
45° |
270 vs 300 sec |
-3.0± |
7.2% |
45° |
270 vs 300 sec |
-2.7± |
7.0% |
330 vs 300 sec |
7.0± |
12.2% |
330 vs 300 sec |
7.8± |
11.3% |
Spontaneous vs 300 sec |
-0.6± |
11.8% |
Spontaneous vs 300 sec |
-1.1± |
10.5% |
60° |
270 vs 300 sec |
-3.6± |
19.6% |
60° |
270 vs 300 sec |
-3.5± |
19.3% |
330 vs 300 sec |
5.2± |
8.9% |
330 vs 300 sec |
4.0± |
9.0% |
Spontaneous vs 300 sec |
-4.6± |
22.4% |
Spontaneous vs 300 sec |
-3.7± |
20.7% |
R factor |
0° |
270 vs 300 sec |
-2.2± |
8.0% |
Stress level (%) |
0° |
270 vs 300 sec |
-0.1± |
1.0% |
330 vs 300 sec |
1.0± |
6.2% |
330 vs 300 sec |
0.2± |
0.9% |
Spontaneous vs 300 sec |
3.1± |
26.1% |
Spontaneous vs 300 sec |
0.2± |
2.3% |
30° |
270 vs 300 sec |
2.0± |
9.6% |
30° |
270 vs 300 sec |
0.4± |
1.1% |
330 vs 300 sec |
-0.2± |
7.4% |
330 vs 300 sec |
0.5± |
1.3% |
Spontaneous vs 300 sec |
2.1± |
23.3% |
Spontaneous vs / 300 sec |
0.3± |
3.2% |
45° |
270 vs 300 sec |
-0.2± |
7.6% |
45° |
270 vs 300 sec |
-0.2± |
1.3% |
330 vs 300 sec |
0.1± |
7.5% |
330 vs 300 sec |
-0.4± |
1.7% |
Spontaneous vs 300 sec |
-0.3± |
11.9% |
Spontaneous vs 300 sec |
0.2± |
1.0% |
60° |
270 vs 300 sec |
0.4± |
6.5% |
60° |
270 vs 300 sec |
-0.1± |
1.3% |
330 vs 300 sec |
-1.2± |
5.7% |
330 vs 300 sec |
0.6± |
1.3% |
Spontaneous vs 300 sec |
5.4± |
20.1% |
Spontaneous vs 300 sec |
-0.8± |
3.0% |
Changing the duration of the period analysed with CODESNA_HRV did not significantly change the indices. The most important variation was approximately 10% but for most comparisons, the variation was 2-3%.
Effect of endurance training
Changing from Supine to Standing in high-level runners significantly decreased the duration of the RR intervals (from 1261±199 to 813±122 ms). Also, all the Kubios parasympathetic indices (rMSSD, pNN50, HF ms², HF%, HFnu) significantly decreased, while LF/HF significantly increased (Table 4). Conversely, there was no significant change in Ortho and Para with CODESNA_HRV. Moreover, R factor significantly decreased, and Stress Level significantly increased. All these changes were in accordance with those of the Controls (see results above).
Table 4. Comparison of the indices calculated from Kubios and CODESNA_HRV software programmes during active tilt-test in 15 control subjects and 10 high-level runners.
| |
|
|
KUBIOS |
CODESNA_HRV |
|
|
rMSSD (ms) |
pNN50 (%) |
HF (ms2) |
HF% |
HFnu |
LF/HF |
Ortho (ms²) |
Para (ms²) |
RFactor |
Stress Level (%) |
Control Subjects |
Supine |
44.9±26.4 |
23.8±24.3 |
814±855 |
31.3±14.5 |
50.3±19.3 |
1.4±1.2 |
1471±1463 |
1439±1323 |
1.2±0.4 |
99.4±5.2 |
Standing |
22.7±11.3* |
5.9±9.2* |
169±204* |
6.5±5.8* |
10.5±8.6* |
13.5±8.0* |
1798±1378 |
1414±969 |
0.6±0.3* |
110.3±7.7* |
High-level runners |
Supine |
69.2±24.3§ |
45.6±18.1§ |
1880±1261§ |
24.2±17.0 |
49.5±19.2 |
1.5±2.5 |
3833±970§ |
4123±987§ |
1.6±0.7 |
96.3±5.5 |
Standing |
26.0±8.3* |
6.7±5.5* |
185±202* |
3.36±3.42 |
8.6±14.4* |
23.4±12.3* |
3150±1364§ |
2294±810§ |
0.5±0.3* |
114.3±9.5* |
*= significantly different from supine at the p<0.05 level. § = significantly different from the control subjects in the same posture, at the p<0.05 level.
Athletes had higher rMSSD, pNN50 and HFms² values than Controls in the supine position. No significant difference was observed when standing. Ortho and Para were significantly higher in Athletes than in Control subjects in both the supine and standing positions, with no significant difference for R factor or Stress level.
Our findings also showed that in the conditions s2021 Copyright OAT. All rights reserv indices able to describe the activity of the autonomic nervous system in healthy subjects. Specifically, Rfactor and Stress level highlighted short-term changes in ANS activity contrary to the Para and Ortho indexes. Conversely, the cross-sectional comparison of Athletes and Controls revealed a parasympathetic predominance in the former revealed by CODESNA_HRV, suggesting that this software could highlight chronic ANS changes. One advantage of CODESNA_HRV is that the duration of the analysed period can be changed without impacting the indices calculated, rendering the programme more flexible to use.
The active and passive tilt-tests were chosen because response to orthostatism is well known and because it is a simple and reproducible test [31-33] Changing from supine to standing shifts about 500–800 mL of blood from the thorax to the vessels of the abdomen and lower limbs, lowering venous return and stroke volume. This induces a parasympathetic withdrawal and an increase in sympathetic activity to increase heart rate and peripheral resistances to maintain cardiac output and blood pressure [33]. The effects of an active tilt-test are roughly similar to those of a passive tilt-test [32,34,35].
As expected in both Controls and Athletes, changing from supine to standing reduced the parasympathetic indices and increased the sympathetic index obtained with Kubios. This was true for the three tilt-tests performed by the Controls, and also during the passive tilt-test, although clear angulation changes (at least 30°) were required to achieve the significance level. Despite trends in the right direction, Ortho and Para by CODESNA_HRV could not clearly reveal the expected ANS changes. Conversely, R-factor significantly decreased, while Stress level index significantly increased, highlighting the correct change from parasympathetic predominance at the level of the heart during the supine position, to sympathetic predominance during standing. As for the Kubios indices, a clear angulation change (of at least 45°) was needed to reach the significance level. This is in accordance with a clear-cut, rather than gradual switching in control of cardiac activity during graded orthostatism [19,36].
It could be added that the reliability of the indices was roughly the same with both programmes, with perhaps more reliable values from CODESNA_HRV (as suggested by the lower CVs), except for the Stress level index. Studies have reported moderate reliability of HRV indices at rest ranging from 3 to 37% for time domain indices [37,38]. Higher CV values have been reported for spectral indices, ranging from 11 to 46% for LF or HF, and even higher for ratio indices such as HFnu and LF/HF, with CVs ranging from 27 to 79% [21,38]. Overall, the results of the present study obtained with Kubios are in accordance with these studies, with CVs ranging from 2 to 16%. The CVs of the CODESNA_HRV indices were slightly lower (from 3.5 to 5.7%), with the exception of Stress level, which nevertheless had a CV close to previously reported values for indices such as LF/HF that could have CV close to/larger than 30%.
A large number of cross-sectional studies have revealed higher HRV vagal-related indices (i.e., rMSSD, pNN50 and HF) in well-trained subjects compared with controls [2,4,16,20,39-41] and an increase in these indices is also observed in longitudinal studies [4,42-44]. Also, a decrease in these indices are usually observed with training induced fatigue [6,8,14,45]). It should be kept in mind that this simple “all-or-none” approach is rarely observed and the involvement of the ANS during the training process is far more complicated (for more detailed discussion see [16].
In the present study, the comparison of Athletes and Controls confirmed the higher parasympathetic activity in the former through significantly higher rMSSD, pNN50 and HFms² values in the supine posture. The higher ANS activity in Athletes was highlighted by the significantly higher Ortho and especially Para values compared to Control subjects, even if the high Ortho index is questioning. A trend towards a higher R-factor and lower Stress level was also underlined, highlighting the parasympathetic predominance. However, this needs to be confirmed in further studies, as statistical significance was not reached.
The smallest worthwhile difference (or half of a CV) is thought to represent the minimal threshold needed to assess a meaningful difference (between-group comparisons) or change (training studies) [46]. Thus, the reliability of any physiological measurement is of particular importance for practitioners and coaches to avoid biased interpretation when assessing changes in a marker. Para and Ortho values are 40-60% higher in athletes than in control subjects, while half of their CV corresponded to about 2-3% suggesting that these indices are clearly able to highlight the parasympathetic predominance in training athletes. Half of the CV for Stress level is around 15%, while the difference between controls and athletes was around 3%, suggesting that this index is not sufficiently sensitive in this case.
The Task Force of 1996 stated that it is inappropriate to compare HRV measures obtained from periodograms of different durations, and that for short-term recordings, 5 min appears to be appropriate [17]. We thus used this duration for the analyses performed with Kubios. As regards CODESNA_HRV, the designer claimed that the duration is of little importance and that changing the duration of the analysis would not deeply affect the indices. The results of the present study indicate that reducing or increasing the duration by 30 sec (i.e. changing to 270 or 330 vs. 300 sec) modified the CODESNA indexes by less than 10%, and most of the time, by less than 5%. It could be added that spontaneously choosing a period for the analysis (i.e., subjectively choosing the period for analysis on the basis of the periodogram stationary whatever the duration) gave the best approximation as compared to the fixed 300 sec suggested by the Task Force. This is of particular importance and represents an added value for CODESNA_HRV, since it could save time for the clinician/coach/athlete when computing HRV indices.
This study evaluated the CODESNA_HRV programme dedicated to the analysis of HRV to obtain information regarding ANS activity. Under the design of this study, CODESNA_HRV provided HRV indices able to describe the activity of the autonomic nervous system in healthy subjects. Rfactor and Stress level identified short-term changes in the ANS activity (response to orthostatism), contrary to Para and Ortho. These later indices could nevertheless have identified chronic ANS differences such as those occurring with endurance training. The fact that the duration of analysis has no real consequence on the indices obtained with CODESNA_HRV is of key importance and renders the analysis more convenient. CODESNA_HRV appears to be a promising tool for HRV analysis as complement to traditional method but further studies are nevertheless required to confirm these results with more participants, and in other physiological / physiopathological situations.
I acknowledge the work of Romain Van Haesbrourck and David Chaparro Obando from the UPFR des Sports (University of Franche Comté) for their strong involvement in the practical organisation of the study as well as Fabien Cerutti from the Hospital of Besançon for the statistical analysis. I also acknowledge Vasile Zoicas from freely providing the CODESNA software and Fiona Ecarnot for correcting and improving the English. This study was funded by grants from the French Ministry of National Education, of Research and of Technology (EA3920) and from Tomsk Polytechnic University Competitiveness Enhancement Program grant, Project № ВИУ-ИСГТ-108/2017 - TPU CEP-HSTI-108/2017.
- Spinal cord injury (SCI) facts and figures at a glance (2015) National Spinal Cord Injury Statistical Center.
- Hoffman LR, Field-Fote EC (2007) Cortical Reorganization Following Bimanual Training and Somatosensory Stimulation in Cervical Spinal Cord Injury: A Case Report. Phys Ther 87: 208–223. [Crossref]
- Carr JH, Shepherd RB (1987) A Motor Relearning Programme for Stroke. 2nd ed., US. Oxford: Heinemann Medical Books.
- Wolf SL, Winstein CJ, Miller JP, Taub E, Uswatte G, et al. (2006) Effect of Constraint-Induced Movement Therapy on Upper Extremity Function 3 to 9 Months After Stroke. JAMA 296: 2095–3104. [Crossref]
- Fote EC (2009) Spinal Cord Injury Rehabilitation. Philadelphia, PA, USA.
- Montgomery PC (2003) Neuroplasticity: Applications to Motor Control. In: Clinical Applications for Motor Control. Thorofare, NJ: SLACK 94.
- Wang D, Sun T (2011) Neural plasticity and functional recovery of human central nervous system with special reference to spinal cord injury. Spinal Cord 49: 486-492. [Crossref]
- Beekhuizen KS, Field-Fote EC (2005) Massed practice versus massed practice with stimulation: Effects on upper extremity function and cortical plasticity in individuals with incomplete cervical spinal cord injury. Neurorehabil Neural Repair 19: 33-45. [Crossref]
- Beekhuizen KS, Field-Fote EC (2008) Sensory stimulation augments the effects of massed practice training in persons with tetraplegia. Arch Phys Med Rehabil 89: 602-608. [Crossref]
- Hoffman L, Field-Fote E (2013) Effects of practice combined with somatosensory or motor stimulation on hand function in persons with spinal cord injury. Top Spinal Cord Inj Rehabil 19: 288-299. [Crossref]
- Hoffman LR, Field-Fote EC (2010) Functional and corticomotor changes in individuals with tetraplegia following unimanual or bimanual massed practice training with somatosensory stimulation: A pilot study. J Neurol Phys Ther 34: 193-201. [Crossref]
- Taub E, Uswatte G, Mark VW, Morris DM (2006) The learned nonuse phenomenon: implications for rehabilitation. Eura Medicophys 42: 241-255. [Crossref]