chronic myeloid leukemia, bcr-abl1, atypical transcript, minimal residual disease, DDPCR
Chronic myeloid leukemia (CML) is characterized by the t(9;22)(q34;q11) translocation which leads to the generation of the BCR-ABL1 protein with constitutive tyrosine kinase activity.
BCR-ABL1 is the molecular marker for the evaluation of minimal residual disease (MRD) and its levels throughout the follow up define the depth of molecular remission and guide clinical decisions like change of tyrosine-kinase inhibitor (TKI) or, more recently, discontinuation of therapy [1].
In the majority of cases breakpoint on chromosome 22 gives rise to the conventional types of BCR-ABL1 fusion transcripts e13a2 or e14a2, whereas alternative breakpoints in BCR or ABL1 lead to other fusion transcripts, known as atypical, such as e19a2, e8a2, e13a3, e14a3. The epidemiology of these atypical transcripts has been recently evaluated [2], but the clinical meaning is controversial due to their rarity.
The presence of a rare transcript can make the CML diagnosis challenging because Real-Time PCR (RT-qPCR), which is the standardized method adopted for the quantification of BCR-ABL1, might not be able to perform the amplification and the result could be falsely negative. Diagnosis requires first a qualitative analysis, followed by sequencing. Disease monitoring is currently carried out with qualitative methods, such as NESTED PCR and FISH analysis. No standardized methods are codified for the quantitative monitoring of rare transcripts. In an era where we use to refer to CML response in terms of major molecular response or deep molecular response, it results very difficult to follow the clinical course of patients with atypical transcripts. Moreover, lacking the possibility to quantify the MRD, patients who carry an atypical transcript are currently automatically excluded by any attempt of treatment discontinuation protocols [3].
Digital PCR (dPCR) appeared to be the most reliable and reproducible method for MRD monitoring compared to RT-qPCR, being independent from calibrators or standard reference curves. dPCR value has been reported in several experiences conducted both on Philadelphia positive (Ph+) and negative leukemia [4-7].
We reported here a new case of chronic-phase CML with a unique atypical transcript where the application of droplet dPCR (ddPCR) allowed us to quantify the disease burden from diagnosis through follow up, by designing a patient-specific assay.
Patient was a 58 years-old woman with a previous history of relapsed breast cancer and was diagnosed with chronic-phase CML in March 2018. At diagnosis, her blood count was as follows: Hb 14.6 g/dl, platelets 282.000/uL, WBC 15860/uL with 6.4% of basophils, 2.3% of eosinophils and no blasts in the peripheral smear. No splenomegaly was evidenced. Both Sokal and ELTS scored low. She was started on imatinib 400 mg/day.
The patient was first characterized by conventional cytogenetic and fluorescence in situ hybridization (FISH) as described below.
Karyotyping was performed at diagnosis on bone marrow (BM) cells according to standard methods. BM cells were cultured for 48 hours and chromosomes were G-banded with Wright’s eosin methylene blue (#101383, Merck Millipore), according to the manufacturing protocol. At least 20 metaphases were analyzed. FISH analysis were performed on BM samples at diagnosis, using XL BCR/ABL1 plus (#D-5052-100-OG, MetaSystem), following manufacturer’s protocol. At least 300 interphase cells were counted and all available metaphases were analyzed.
Cytogenetics analysis at diagnosis detected a classical t(9;22)(q34;q11) translocation on 20/20 metaphases. FISH revealed the 96% of Ph positive cells. At 3 months and 6 months re-evaluations, Complete Cytogenetics response (CCyR) was obtained and FISH analysis come back both times negative for Ph positive cells (data not shown).
Successively, molecular characteristics of patient were investigated as follow: total RNA derived from BM and peripheral blood (PB) cells was reverse transcribed to complementary DNA using M-MLV Reverse Transcriptase, RNAse Inhibitor and Random Hexamers Primers (respectively, #28025013, #N8080119 and #N8080127, Thermo Fisher Scientific). The presence of BCR-ABL1 fusion transcript was assessed as recommended [8].
Conventional RT-qPCR analysis was performed using BCR-ABL P210 ELITe MGBKit (#RTSG07PLD210, ELITech Group), without producing target sequence amplification. BCR-ABL1 fusion transcript was sequenced by Sanger method using primers described in van Dongen et al. [8]. Droplet dPCR (ddPCR) experiments were performed by the QX200 system (Bio-Rad). ddPCR is based on a water-oil emulsion droplet technology that allows to quantify the single target molecules per droplet in a sample, implementing PCR data with Poisson statistics. Primer and probes for the patient-specific sequence were designed as follows: BCR Primer 5’-cgtggagctgcagatgct-3’, ABL1 Primer 5’CCTGCTCCTTTGATAAAATGC’ and TaqMan Probe 5’-ccaactcaaaagta-3’ (Thermo Fisher Scientific). ABL1 (#Hs01104728_m1, Thermo Fisher Scientific) gene was used as internal control. The BCR-ABL1 fusion and ABL1 transcripts were tested in multiplex in the same well. Each replicate was partitioned into 20,000 droplets by an automated droplet generator and each droplet was amplified by PCR. Each sample was then loaded onto the QX200 droplet reader and ddPCR data were analyzed with QuantaSoft analysis software (version 1.7.4). Each sample was analyzed in triplicate and 100ng of initial RNA were loaded for each well. The target concentration in each sample was expressed as BCR-ABL1 copies/ng and as % of BCR-ABL1/ABL1.
To evaluate the good quality of the ddPCR assay for the patient-specific BCR-ABL1 transcript quantification, we first tested primers efficiency by using RT-qPCR technology with 5 ten-fold dilutions of patient’s cDNA. The curve obtained showed a high linearity (coefficient of correlation R2=0.989), a slope of -3.24 and good efficiency (E=103.5%) (Figure 1A). Successively, to estimate the sensitivity of the assay, we mixed patient’s RNA with a pool of RNA negative for BCR-ABL1 transcript for testing in ddPCR (100%, 10%, 1%, 0.1%, 0.01%, 0.001% and 0% patient’s RNA vs. BCR-ABL1 negative RNA pool). Results indicated that our assay could quantify a reduction of BCR-ABL1 transcript of up to 10-5, without positive droplets in 0% sample (Figure 1B). Furthermore, the curve obtained showed a very high linearity (coefficient of correlation R2=0.9998) (Figure 1C).
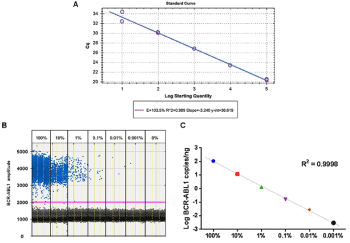
Figure 1. A Primers efficiency calculated by using qRT-PCR. The ten-fold serial dilutions are linear over five logs. Data represent two replicates of each dilution. (E: efficiency; R2: coefficient of correlation). B 1-D plot obtained by ddPCR analysis showing fluorescence produced by patient-specific probe. Each dot represents a droplet positive for the BCR-ABL1 fusion transcript. C The progressive decrease of the BCR-ABL1 fusion transcript (expressed as log of copies/ng) of the ten-fold serial dilutions of patient cDNA. (R2: coefficient of correlation)
Then, the BCR-ABL1 fusion transcript was evaluated in patient’s samples at diagnosis (BM) and after 3, 6 and 12 months of TKI treatment (PB and BM). At diagnosis, NESTED PCR caught a specific signal compatible with an e14a2 transcript by molecular weight, while we observed a consistent reduction of the signal with very slight persistent positivity at first step for every evaluation performed until the last follow up after 12 months (Figure 2A). Despite the NESTED PCR result at diagnosis was comparable with an e14a2 transcript, RT-qPCR was not able to quantify it (data not shown). Sanger sequencing of NESTED PCR product at diagnosis revealed an atypical breakpoint between BCR ex13 with a deletion of 53 nucleotides and an insertion of 119 nucleotides from ABL1 intron 1 fused to ABL1 exon a2 (BCR e13(-53nt)/ins 119nt ABL 1b/ABL ex2) (Figure 2B). Subsequently, a patient-specific assay was designed to quantify the BCR-ABL1 transcript at diagnosis and during follow up by using ddPCR technology. Data showed a constant reduction of BCR-ABL1 level from the diagnosis to the last follow up (12 months) (Figure 2C).
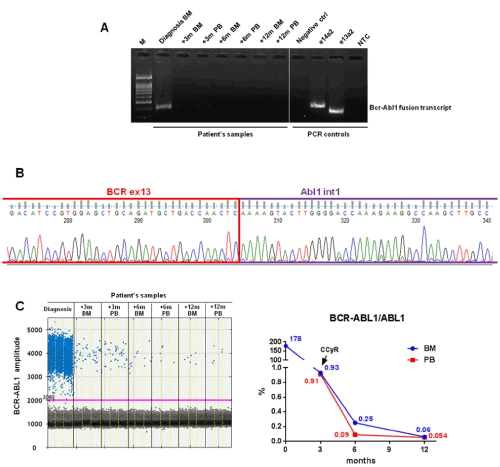
Figure 2. Molecular analyses. A qualitative PCR analysis performed for BCR–ABL1
fusion transcripts detection. (M: DNA Molecular Weight Marker; ctrl: control; NTC: no template control). B Direct sequencing of the qualitative PCR product revealed a fusion between BCR ex13 with a deletion of 53 nucleotides and an insertion of 119 nucleotides from ABL1 intron 1 fused to ABL1 exon a2. C On the left, 1-D plot obtained by ddPCR analysis showing fluorescence produced by patient-specific probe. Each dot represents a droplet positive for the BCR-ABL1 fusion transcript. On the right, a progressive decrease of the BCR-ABL1 fusion transcript (expressed as % of BCR-ABL1/ABL1) as from the start of TKIs therapy was shown. (CCyR: complete cytogenetic response CCyR)
Variant BCR–ABL1 fusion transcripts occur in 1-2% of CML patients and the most commonly reported are due to alternative splicing of BCR and ABL1 exons. Insertion of 21 nucleotides of ABL1 intron 1 at the BCR–ABL1 fusion site was first described in a CML patient in 1998 by Rubinstein and Purves [9]. Other variable size insertions of ABL1 intron 1 with apparent false-negative result in RT-qPCR were described in subsequent years [9-11]. Despite qualitative NESTED PCR and Sanger sequencing remain useful to diagnose and identify the BCR-ABL1 transcripts, ddPCR technology have been effective in quantifying atypical BCR–ABL1 fusions in Ph+ leukemia, leading an absolute quantification without the need of a standard curve preparation. According to the European LeukemiaNet criteria [12], this patient would have reached the early molecular response (MR2) at 6 months and the major molecular response (MR3) after 12 months of TKI treatment. Unfortunately, this judgment would be impossible in the clinical practice because no standardized methods for monitoring the rare BCR–ABL1 variants are available. In conclusion, molecular monitoring of BCR–ABL1 in CML patients showing atypical transcripts could be useful in order to better define MRD levels of these patients.
JP and MD designed the study, performed the experiments and wrote the manuscript; AC provided samples and clinical data; MLI designed the assay; CF and CB processed samples; AS performed sequencing analysis; EG performed cytogenetic analysis; GA and VR analyzed data; EG, GRC, GS, DC and CF supervised the experiments and provided the final approval of the manuscript. All authors read and approved the final manuscript.
JP and MD contributed equally to this manuscript.
This work was supported by a grant from AIRC (grant number 10005 to GS).
The authors declare that they have no competing interests.
- Jabbour E, Kantarjian H (2018) Chronic myeloid leukemia: 2018 update on diagnosis, therapy and monitoring. Am J Hematol 93: 442-459.
- Baccarani M, Castagnetti F, Gugliotta G, Rosti G, Soverini S, et al. (2019) International BCRABLSG. 2019. The proportion of different BCR-ABL1 transcript types in chronic myeloid leukemia. An international overview. Leukemia 33: 1173-1183.
- Hochhaus A, Saussele S, Rosti G, Mahon FX, Janssen J, et al. (2017) Chronic myeloid leukaemia: ESMO Clinical Practice Guidelines for diagnosis, treatment and follow-up. Ann Oncol 28(suppl_4): iv41-iv51.
- Coccaro N, Anelli L, Zagaria A, Casieri P, Tota G, et al. (2018) Droplet Digital PCR Is a Robust Tool for Monitoring Minimal Residual Disease in Adult Philadelphia-Positive Acute Lymphoblastic Leukemia. J Mol Diagn 20: 474-482.
- Della Starza I, De Novi LA, Santoro A, Salemi D, Tam W, et al. (2019) Digital droplet PCR and next-generation sequencing refine minimal residual disease monitoring in acute lymphoblastic leukemia. Leuk Lymphoma 1-3.
- Nicolini FE, Dulucq S, Boureau L, Cony-Makhoul P, Charbonnier A, et al. (2019) Evaluation of residual disease and TKI duration are predictive factors for molecular recurrence after stopping Imatinib first-line in chronic phase CML Patients. Clinical Cancer Research clincanres 3373.
- Cilloni D, Petiti J, Rosso V, Andreani G, Dragani M, et al. (2019) Digital PCR in Myeloid Malignancies: Ready to Replace Quantitative PCR? Int J Mol Sci 20: 3-16.
- van Dongen JJ, Macintyre EA, Gabert JA, Delabesse E, Rossi V, Saglio G, et al. (1999) Standardized RT-PCR analysis of fusion gene transcripts from chromosome aberrations in acute leukemia for detection of minimal residual disease. Report of the BIOMED-1 Concerted Action: investigation of minimal residual disease in acute leukemia. Leukemia 13: 1901-1928.
- Crampe M, Haslam K, Kelly J, Conneally E, Langabeer SE (2017) Characterization of a novel variant BCR-ABL1 fusion transcript in a patient with chronic myeloid leukemia: Implications for molecular monitoring. Hematol Oncol Stem Cell Ther 10: 85-88.
- McCarron SL, Haslam K, Kelly J, Duggan C, Langabeer SE (2012) A novel, variant BCR-ABL1 transcript not detected by standard real-time quantitative PCR in a patient with chronic myeloid leukaemia. Int J Lab Hematol 34: e1-2.
- Jurcek T, Razga F, Jeziskova I, Dvorakova D, Zackova D, et al. (2010) Failure of molecular diagnostics in chronic myeloid leukemia: an aberrant form of e13a2 BCR-ABL transcript causing false-negative results by standard polymerase chain reaction. Leuk Lymphoma 51: 558-561.
- Baccarani M, Deininger MW, Rosti G, Hochhaus A, Soverini S, et al. (2013) European LeukemiaNet recommendations for the management of chronic myeloid leukemia: 2013. Blood 122: 872-874.