Abstract
A major problem in patients with 2 levels of movement disorders in cerebral palsy is the possibility of compensation of the morphological and functional deviations in the development process: low body maCs index, restoration of the reduced speed of cerebral blood flow, reduced velocities and constraints in implementation of co-coordinated movements. From 180 healthy individuals and 30 patients with CP in age from 4 to 40 years were investigated anthropometric indices, motor response speed, tapping, and speed of blood flow in median cerebral arteries and brachial arteries. Discovered that reduced at birth and body mass index in children (1.83) no further persists and is 1.42 g/cm2. Reduced in patients with cerebral blood flow speed by the end of the growth period reaches a normal level. The lack of speed motor responses is reduced with age from 45% to 0%, the value of the tapping from 60% to 18% every 10 years. Execution of combined movements 2 and 3 fingers for patients remains an insurmountable obstacle.
Key words
cerebral palsy, neonatal development, functionality, tapping, cerebral blood flow
Introduction
The size of the lag of children with cerebral palsy (cerebral palsy) in longitudinal body growth and development is well documented [1-3]. However, it is important to assess the compensatory potential of the body in different age periods. It is necessary to know how the pathology of the Central nervous system affects longitudinal growth and weight gain, muscle contractility, speed of motor response and coordination of muscle efforts. It is known that the speed of movements is postulated by the presence of temporary programs in memory. At the same time, tumors of the brain, parastolic structures, cerebellum, spinal cord, as well as their inflammatory diseases do not violate the reaction time of the hand [4]. since the control of the temporal characteristics of movements is carried out at a higher level of the Central nervous system than the distribution of movements to various Executive bodies. Tepping test using computer programs is now widely used to evaluate the types of the nervous system [5]. During the test, 3 factors are important: time, spatial amplitude and frequency of motion [1]. Options with different duration determine the maximum frequency of movements allow to evaluate the lability and because of the process of excitation of the nervous system, as well as the severity of psychomotor attitudes on optimization efforts, when the best results are achieved when a uniform rate of movement [6].
With increasing age, children are increasing the speed of the motor reactions, and rate of finger movements. In healthy subjects, the frequency response of tepping is 56±9 per 10 s for the right hand and 52±9 for the left. This frequency is slightly higher in men than in women. In patients with hemiparesis, the incidence of shock was reduced to 64% of normal [1]. To limit the maximum speed of finger tapping can damage joints, stimulate early training. In particular, pianists have a greater frequency of finger movements by 20-30% [7].
With the help of a tepping test, you can control the severity of lung and moderate traumatic brain injuries, for example, in boxers and football players and assess the dynamics of brain function recovery a month after such an injury [2,8]. The aim of the study was to identify the nature of disorders in the growth and development of children with cerebral palsy level 2 MACS [5].
Research material and methods
The data of maps of newborns of the control group of healthy children (180) and 30 patients with cerebral palsy effects are analyzed. Examined 30 people of different ages from 7 to 40 years (30 people), as well as 30 sick children with the effects of cerebral palsy aged 4 to 40 years. With the help of an electronic device, the following were determined: the speed of a simple visual-motor reaction using a signal of light modality, the maximum frequency of single movements of the second finger of the right hand for 10 seconds, as well as the maximum frequency of combined movements of the second and third fingers. To the third phalanx of the 2nd finger was attached contact, closing at the touch of the metal plate electrical circuit. Previously examined people got acquainted with the work of the plant and conducted trial sessions of the survey.
The study of blood flow velocity along the middle cerebral arteries (SMA) and brachial artery was carried out using the method of ultrasonic Doppler flowmetry with sensors with a carrier frequency of 2 and 8 MHz respectively of the computerized diagnostic complex "Angiodin-2KM" of the production Association "BIOSS" (Russia). Statistical processing of research results was carried out with the help of Microsoft EXEL-2010 data analysis package. The student's t-test was used to assess the validity of differences in the results. Methods of correlation and regression analysis were applied
Results of the study and their discussion
In the group of newborns healthy children were the highest body weight and body mass index. In newborns with cerebral palsy revealed a natural lag the longitudinal body size by 12%, the indicator scale Apgar-1 by 25% and Apgar-2 by 21% and body weight by 33% [table 1].
Table 1. In newborns with cerebral palsy revealed a natural lag the longitudinal body size by 12%, the indicator scale Apgar-1 by 25% and Apgar-2 by 21% and body weight by 33%
Groups of children |
n |
Body Weight (g) |
Body Length (cm) |
Apgar - 1 |
Apgar-2 |
Body mass Index |
Healthy |
180 |
3360
±19 |
52,0
±0,11 |
7,46
±0,03 |
8,55
0,06 |
64,6
(100%) |
With cerebral palsy |
30 |
2021 Copyright OAT. All rights reserv
2242
±174 |
46,0
±1,60 |
5,56
0,63 |
6,78
±0,62 |
48,7
(75%) |
In newborns with cerebral palsy with large longitudinal body size was more lag in body weight, reaching 600 g (Figure 1).
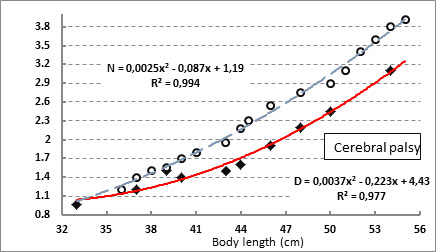
Figure 1. Dependence of body weight on its longitudinal dimensions in newborns of the control group and in patients with cerebral palsy
In the postnatal period, the deficit of the body mass index of 1.42 kg was not compensated for during the subsequent life of children (Figure 2).
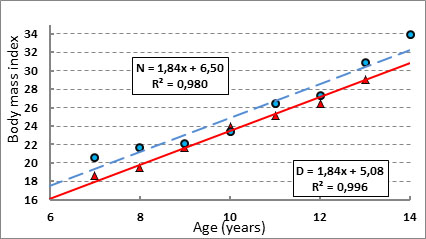
Figure 2. Age dynamics of body mass index in healthy children in patients with cerebral palsy
With increasing age in healthy subjects, the rate of blood flow through the middle cerebral arteries tended to decrease (Figure 3). This decrease is due to the need to maintain a stable level of autoregulation of the arteries. In children with cerebral palsy revealed a sharp decrease in the indicator of cerebral blood flow to 10 years of life, which was compensated by the end of the period of natural growth of the body.
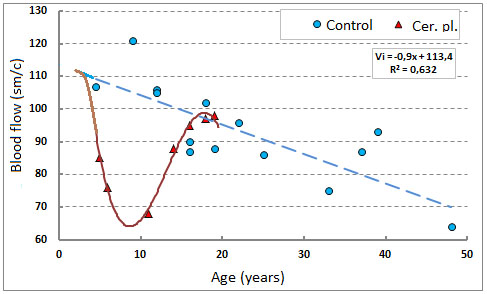
Figure 3. Age dynamics of blood flow velocity along the middle cerebral arteries in healthy people and in patients with cerebral palsy.
During the same period, the rate of blood flow through other arteries, such as shoulder arteries, changed as well as in healthy children, increasing during the puberty period and decreasing over the next years of life (Figure 4).
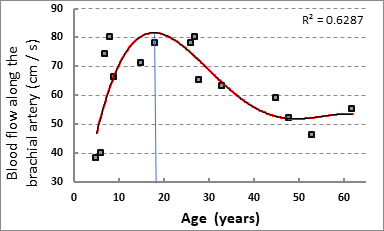
Figure 4. Age dynamics of linear blood flow velocity on the brachial artery in healthy and in patients with cerebral palsy
Time simple visually-motor motor motor reaction in children with cerebral palsy was more than 2 times. However, with increasing age this difference is leveled (Figure 5).
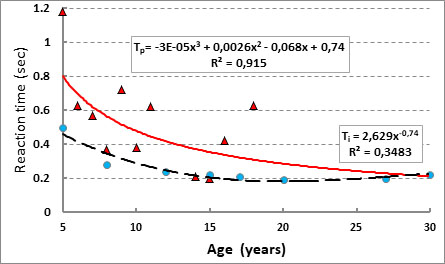
Figure 5. Age dynamics of time of simple visual-motor motor reaction in healthy subjects and patients with cerebral palsy
Both healthy and patients with increasing age, the maximum frequency of finger movements (tapping) were increased. At the same time, patients with tepping index is lower by 50-25%. The highest values of the frequency of movements reached 15-20 years and then began to decline [9,10]. The difference between performance in the 2 groups was reduced to 15% (Figure 6).
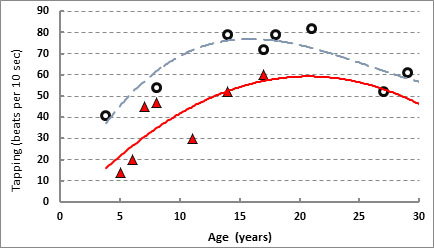
Figure 6. Age dynamics of tepping in healthy subjects and in patients with cerebral palsy
In healthy subjects the rate of combined movement of 2 and 3 fingers in all age groups was reduced by 30% (Figure 7). the rate of asymmetry of the single movements of the right and left fingers was 7.3%, and the combined movements – 12.9% [11-13].
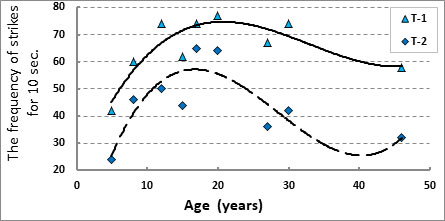
Figure 7. Age dynamics of single and combined tepping in healthy subjects.
Thus, a common sign of functional disorders in patients with level 2 movement disorders in cerebral palsy is an uncompensated body mass deficit, a decrease in the speed of cerebral blood flow in the postnatal period of childhood, a decrease in the speed of movement and difficulty in performing combined coordinated movements.
References
- Camcon-Fang L, Bell KI (2013) Assessment of growth and nutrition in children with cerebral palsy Eur.J.Clin. Nutr 67: 5-8. [Crossref]
- Dikmen SS, Machamer JE, Winn HR, Temkin NR (1995) Neuropsychological outcome at 1-year post head injury. Neuropsychology 9: 80–90.
- Ryabykh TV, Tomov AD, Popkov DA (2016) Features of somatic status in children with cerebral palsy in surgical orthopedic treatment. The genius of orthopedics 3: 52-57.
- Blinkov SM, Nikandrov MG (2008) To the question of friendly hand reaction. Communication 3. Friendliness of hands reaction to the signal of sound and light modality in focal lesions of the brain stem and intermediate brain. Human Physiology 34: 96-101.
- Eliseev OP (2003) Determination of the coefficient of functional asymmetry and properties of the nervous system on psychomotor indicators. Practicum on psychology of personality P. 200-202.
- Il'in EP (2003) Psychomotor organization of man. – SPb: Peter.
- Baturina VG (1969) To the characteristic of the motor system in pianists Adaptation of athletes to work at different oxygen regime M – P. 168-173.
- Prigatano GP, Borgaro SR (2003) Qualitative features of finger movement during the Halstead finger oscillation test following traumatic brain injury. Journal of the International Neuropsychological Society 9: 128–133. [Crossref]
- Araujo LA, Silva LR (2013) Anthropometric assessment of patients with cerebral palsy which cerves are more appropriale? J. Pediatr (Rio J) 89: 307-314. [Crossref]
- Eliasson AC, Krumlinde-Sundholm L, R?sblad B, Beckung E, Arner M, Ohrvall AM, Rosenbaum P (2006) The Manual Ability Classification System (MACS) for children with cerebral palsy: scale development and evidence of validity and reliability. Dev. Med. Child Neurol 48: 549–554. [Crossref]
- Feigenberg IM (2008) The Speed of motor reaction and probabilistic approach Human Physiology
- Ichiro S, Toshiaki N, Konichi U (1990) The finger-tapping test. A quantitative analysis. Arch. Neurol B. 47: 681-684. [Crossref]
- Liu W, Forrester L, Whitall J (2006) A note on time-frequency analysis of finger tapping. Journal of Motor Behavior 38: 18–28 [Crossref]