Abstract
An experiment was conducted to determine the toxicity of dietary melamine fed to barrows for 21 days. Thirty barrows, two weeks post weaning (initial weight 10.66 ± 1.52 kg), were assigned to one of six dietary treatments. Each dietary treatment was fed to five individually housed pigs. The diets contained 0.00, 0.25, 0.50, 0.75, 1.00 and 1.25% melamine (MEL). Based on average feed intake and body weight gain over the experimental period it was determined that pigs fed 0.00, 0.25, 0.50, 0.75, 1.00 and 1.25% MEL consumed approximately 0, 134, 276, 400, 558, and 714 mg/kg BW/day MEL, respectively. Two extra pigs were fed a combination of 0.75% melamine and 0.75% cyanuric acid for 18 days. No mortality occurred during the study. Inclusion of ≥ 1.00% melamine decreased body weight and average daily gain compared to controls. Gain to feed was lower in pigs fed 1.25% melamine as compared to controls. Relative liver and kidney weights and serum creatinine were not affected by treatments. In contrast, barrows fed the combination of melamine and cyanuric acid had relative kidney weight that were 82% heavier than controls and a creatinine level that was approximately seven-fold greater than that of controls. Urine from pigs fed the combination of melamine and cyanuric acid contained a moderate amount of crystals that were consistent with melamine-cyanuric acid complexes. No histologic change was noted in the liver, kidney, or muscle sections from pigs fed only melamine. However, kidneys from pigs fed the combination of melamine and cyanuric acid contained a large number of golden brown to yellowish crystals in the tubules. Melamine residue levels of pigs fed a combination of melamine and cyanuric acid (0.75% each) were lower than in pigs fed 0.75% melamine alone.
Key words
crystals, cyanuric acid, kidney, melamine, porcine
Abbreviations
MEL: Melamine; CYA: Cyanuric Acid; BUN: Blood Urea Nitrogen; CREAT: Creatinine; BW: Body Weight; NOAEL: No-Observed-Adverse-Effect-Level; UPLC-MS/MS: Ultra-Performance Liquid Chromatography Tandem Mass Spectrometry; CBC: Complete Blood Count; WBC: White Blood Cell; RBC: Red Blood Cell; HGB: Hemoglobin; HCT: Hematocrit; MCV: Mean Corpuscular Volume; MCH: Mean Corpuscular Hemoglobin; MCHC: Mean Corpuscular Hemoglobin Concentration; PLT: Platelets; GLU: Glucose; Na: Sodium; K: Potassium; Cl: Chloride; ALB: Albumin; TP: Total Protein; GLOB: Globulin; Ca: Calcium; Phos: Phosphorus; Mg: Magnesium; T Bil: Total Bilirubin; D Bil: Direct Bilirubin; AST: Aspartate Aminotransferase; GGT: Gamma-Glutamyl Transpeptidase; CPK: Creatine Phosphokinase; BWG: Body Weight Gain; FI: Feed Intake; HPLC: High Pressure Liquid Chromatography; ADG: Average Daily Gain
Introduction
Melamine (C3H6N6; MEL) is a white, crystalline powder [1] with a wide variety of industrial applications including use in manufacturing of plastics, adhesives, laminates, paints, flame retardants, textiles finishes, and fertilizers [2]. Cyanuric acid (CYA), along with ammeline and ammelide, are structural analogues of MEL [3,4] and all belong to the class of chemicals known as s-triazines [ 5 ]. The ability of MEL and CYA to self-assemble and form a hydrogen-bonded bimolecular network [6] allows the compounds to crystallize in the kidneys of animals that have ingested them, causing renal failure [7].
Contamination of feed or food with MEL and/or CYA can occur indirectly and accidently by treatment of feed ingredients with products that contain MEL or CYA [4]. However, in recent years the intentional adulteration of feed and food with MEL [2] has received international attention. MEL is 66 % nitrogen [8], therefore, protein analysis using the Kjeldahl method will result in an invalid or an over estimate of the actual protein content of a matrix that contains MEL [8]. For this reason, MEL was intentionally added to feed ingredients and feeds to increase their monetary value [9]. Precipitation of MEL-CYA crystals in the kidneys of dogs and/or cats has been reported by several authors [9-11]. It has also been reported [10,12] that blood urea nitrogen (BUN) levels increase in animals fed MEL and CYA due to a decrease in kidney function. Possible routes of absorption of MEL and related compounds as well as how precipitation of the compounds can lead to renal damage and renal failure have been previously described [12,13].
In 2007, renal failure, caused by ingestion of pet food that was contaminated with MEL and CYA, caused the death of pets across North America and South Africa [2]. It was subsequently determined that pet food scraps containing MEL and CYA were incorporated into swine, poultry, and aquaculture feed [14-16]. Animals that consumed the contaminated feeds were quarantined by the USDA Food Safety and Inspection Service until it was determined that meats and other products from these animals were not themselves contaminated [16].
In September 2008, reports from China indicated that 52,875 children had been treated for renal complications after having consumed infant formula and other related dairy products contaminated with MEL [4,17]. By November 2008, some 294,000 infants in China had been affected, with 50,000 hospitalized and 6 reported deaths [4,17]. It was determined that MEL was used to artificially increase the crude protein of milk that was used in the production of infant formula [4,18]. However, unlike the pet food incidence of 2007, the melamine added to the milk was relatively pure, with levels of CYA, ammeline, and ammelide about 0.1% that of the MEL level [4]. This level of contamination with CYA, ammeline, and ammelide was much lower than the levels present in the pet food products in 2007 [4].
Since the 2007 and 2008 incidents of contamination of animal feed and human food with MEL and related analogs, several case reports and experiments have been published involving consumption of MEL and related compounds by swine [19-21]. Starter diets fed to swine on a farm in Thailand had MEL, CYA, and ammeline concentrations of 3,209 ppm (0.32 % of the diet), 1,126 ppm (0.11 % of the diet), and 949 ppm (0.09 % of the diet), respectively [21]. Mortality started approximately two weeks after weaning and within two months approached 100%. Kidneys from affected pigs appeared yellow, slightly swollen, glistening, and showed perirenal edema. Crystal precipitates were evident on the surface of cut renal sections, with crystals appearing yellow to brown with radiating striations [21]. MEL concentrations that ranged from 750 ppm (0.075 % of the diet) to 1,500 ppm (0.15 % of the diet) were documented in a swine diet in Malaysia [20]. Pigs that consumed the contaminated feed appeared inappetant, anorexic, thin, dull, and depressed. The kidneys from these pigs were enlarged and yellowish in appearance. Severely affected pigs had kidneys that were small in size with clear pitting and dimpling, dark red and brown in color, with multiple cysts present in the cortex [20].
The first experimental data regarding the consumption of MEL by swine involved feeding 400 mg/kg body weight (BW; ? 0.7 % of the diet) of MEL and CYA, alone or in combination, to 16 week old Yorkshire-cross pigs [22]. A three-day feeding period was used with one pig per treatment. Pigs fed MEL alone and CYA alone showed no gross lesions or crystals in the kidneys and had normal BUN and creatinine (CREAT) levels. Only the pigs fed the combination diet developed golden-brown crystals that formed radial spheroid aggregates in the kidneys. The combination fed pigs also had elevated BUN and CREAT levels. An interesting observation reported by the authors was that MEL-CYA and MEL-uric acid crystals might not be stable in formalin and would dissolve when tissues were fixed in formalin [22].
In 2011, a no-observed-adverse-effect-level (NOAEL) was determined in pigs [23]. Three separate studies were conducted with weanling barrows fed MEL, CYA, or a combination of MEL+CYA. The first study found a dose related response in kidney weight and relative kidney weight when MEL-CYA was fed at levels greater than 10 mg/kg BW/day (? 0.025 % of the diet). Crystalline structures were found in the medulla and cortex of kidneys from barrows fed 10 mg/kg BW/day or more of the MEL-CYA combinations, and in barrows fed 200 mg/kg BW/day (? 0.50 % of the diet) of MEL alone. In the second experiment, conducted to determine the NOAEL, 0.0, 1.0, and 3.3 mg/kg BW/day ( ? 0.0, 0.0025, and 0.00825% of the diet) of MEL-CYA was fed to barrows for 28 days[23]. Only one barrow fed 3.3 mg/kg BW/day developed a cluster of crystals in the kidneys, therefore the NOAEL was set at 1.0 mg/kg BW/day of MEL in combination with 1.0 mg/kg BW/day CYA. Finally, a follow-up study was conducted by feeding 200 mg/kg BW/day of MEL to barrows. Upon examination no crystals were present in pigs fed 200 mg/kg BW/day [23].
During the NOAEL experiments, ultra-performance liquid chromatography tandem mass spectrometry (UPLC-MS/MS) was used to determine crystal composition [23]. It was found that crystals removed from the kidney of pigs fed MEL only were closely related to the morphology of crystals from pigs fed combinations of MEL and CYA. Similar morphology and a one to one ratio of MEL to CYA, determined by UPLC-MS/MS, indicates that crystals from the MEL fed pig contained both MEL and CYA [23]. It was stated that while microbial conversion of MEL to CYA has been reported [5,7], it is unclear if the microorganisms responsible for the conversion reside and are active in the gastrointestinal tract of animals [23].
Previous research has determined that combinations of MEL and CYA can form renal crystals similar to those detected in pets [22] and established a NOAEL for pigs fed a combination of MEL and CYA [23]. However, to date, no research has addressed the effects of higher dietary levels of MEL in young weanling pigs or tissue residue levels after consumption. Therefore, the objectives of the current study were to determine the effects of high dietary levels of MEL (up to 1.25 % of the diet) on weanling barrows, and to determine MEL residue levels in the kidney, muscle, and bile.
Materials and methods
Diet preparation
A basal diet (Table 1) was formulated to meet or exceed all requirements of weanling pigs as suggested by the National Research Council [24]. Six dietary treatments were prepared from the basal diet by adding MEL, obtained from Fisher Scientific (St. Louis, MO, USA). Melamine was substituted for sand to obtain the desired dietary MEL concentrations (0.00, 0.25, 0.50, 0.75, 1.00, and 1.25 %).
Table 1. Ingredients and nutrient composition of basal ration.
Ingredient |
Composition (%) |
Corn |
49.77 |
Soybean Meal |
27.50 |
Whey, Dried |
10.00 |
Plasma |
2.50 |
Choice White Grease |
5.00 |
Dicalcium Phosphate |
2.05 |
Limestone |
0.87 |
Vitamin Premixa |
0.50 |
Salt |
0.20 |
L-Lysine |
0.15 |
Trace Mineral Premixb |
0.15 |
DL-Methionine |
0.065 |
Sand |
1.25 |
Total |
100.00 |
Nutrient composition (calculated) |
Crude Protein (%) |
20.5 |
Metabolizable Energy (kcal/Kg) |
1580.00 |
Lysine (SID, %) |
1.20 |
Methionine (SID, %) |
0.34 |
Methionine + Cysteine (SID, %) |
0.68 |
Threonine (SID, %) |
0.72 |
Calcium (%) |
0.95 |
Phosphorus (% Av.) |
0.55 |
- Vitamin premix provided (mg/kg of diet): retinyl acetate, 11,000 IU; cholecalciferol, 1,100 IU; DL-α-tocophereryl acetate, 44.1 IU; menadione Na dimethylpyrimidinol bisulfate, 4.0; vitamin B12, 30.3 µg; riboflavin, 8.3 mg; D-Ca-pantothenate, 28.1 mg; nicotinamide, 33.1 mg; choline chloride, 551.3 mg; D-biotine, 0.22 mg; folic acid, 1.65 mg
- Trace mineral premix provided (mg/kg of diet): Zn, 165 mg (ZnSO4); Fe, 165 mg (FeSO4H2O); Cu, 16.5 mg (CuSO45H2o); Mn, 33 mg (MnSO4); I, 0.3 mg Ca(IO3)2; Se, 0.3 mg (Na2Se03).
SID = Standardized ileal digestible basis.
Pigs, management, and response variables
The animal care and use protocol was reviewed and approved by the University of Missouri Animal Care and Use Committee. Thirty barrows, two weeks post weaned, were purchased from a commercial producer, weighed, ear tagged, and placed in individual pens with ad libitum access to feed and water. A completely randomized design was used, with five replicate pens of one pig each assigned to each of the six dietary treatments. Pigs were housed in an environmentally controlled building with elevated 1.2 m2 pens with plastic covered grate flooring over a flush system. Each pen had a stainless-steel nipple waterer and a three-hole nursery feeder. Dietary treatments were fed for 21 days with each pig inspected daily for signs of illness.
On day 21, two blood samples per pig were taken from pigs in the first three replicates. The blood was collected via the anterior vena cava. Blood and sera samples were analyzed at a Veterinary Diagnostic Laboratory (University of Missouri – Columbia, MO, USA). A complete blood count (CBC), which involves analysis of white blood cells, (WBC), red blood cells (RBC), hemoglobin (HGB), hematocrit (HCT), mean corpuscular volume (MCV), mean corpuscular hemoglobin (MCH), mean corpuscular hemoglobin concentration (MCHC), and platelets (PLT), was performed on whole blood samples. Serum was analyzed for glucose (GLU), BUN, CREA, sodium (Na), potassium (K), chloride (Cl), albumin (ALB), total protein (TP), globulin (Glob), calcium (Ca), phosphorus (Phos), magnesium (Mg), total bilirubin (T Bil), direct bilirubin (D Bili), aspartate aminotransferase (AST), gamma-glutamyl transpeptidase (GGT), and creatine phosphokinase (CPK). The following day (day 22) blood samples from the remaining two replicates were taken and treated in the same manner as the first group. Pigs were bled and later killed in two groups due to time restrictions on the necropsy floor.
On day 21, all pigs and feed were weighed and average body weight gain (BWG), average feed intake (FI), and feed conversion were calculated. On day 22, pigs in the first three replicates were euthanized via captive bolt followed by exsanguination, after which necropsies were performed at a veterinary diagnostic laboratory (University of Missouri -Columbia, MO, USA). The remaining pigs in the final two replicates were euthanized in the same manner as the first group on day 23 of the study.
During necropsies, the liver and kidneys were removed from each pig and weighed to calculate relative weights (organ weight/body weight). Sections of liver, kidney, and muscle (hind quarter) were taken from each pig and fixed in 10 % neutral buffered formalin, purchased from Fisher Scientific (St. Louis, MO, USA) for histopathology. For histopathology, tissues were also fixed in a 70 % ethanol, obtained from Fisher Scientific (St. Louis, MO, UAS), solution for 24 h, after which they were placed in a 95 % ethanol solution until the tissues were trimmed for tissue processing and saved. Additional samples of kidney and muscle (hind quarter) along with bile were frozen for later analysis of MEL residue by high pressure liquid chromatography (HPLC).
Urine was collected from two pigs per treatment and sent to a veterinary diagnostic laboratory (University of Missouri – Columbia, MO, USA) for a complete physical/chemical urinalysis (color, clarity, specific gravity, glucose, bilirubin, ketones, heme, pH, protein dipstick, SSA, urobilinogen, presence of white blood cells, red blood cells, bacteria, round cells, squamous cells, casts, and crystals).
Two extra pigs were purchased to replace early mortalities and to ensure only high-quality pigs were used in the experiment. These pigs were fed the same basal diet as pigs in the experiment. However, on day three of the experiment, since no mortality occurred, the extra pigs were fed a basal diet (same basal diet used to formulate experimental treatments) that contained a combination of 0.75 % MEL and 0.75 % cyanuric acid, obtained from Fisher Scientific (St. Louis, MO, USA; CYA). The two extra pigs were treated the same as the experimental pigs. Feed intake, body weight gain, and all tissue collection and analysis were performed in the same manner as with the experimental pigs. The purpose of feeding the combination diet to the extra pigs was to obtain kidney crystals (MEL-CYA) to compare to crystals that might occur in the MEL only fed pigs. Extra pigs (MEL + CYA) are not included in any statistical analysis and are not included when treatment group is used to describe effects of MEL on barrows.
Melamine analysis
All chemicals, if not otherwise specified, were obtained from Fisher Scientific (St. Louis, MO, USA) The procedure for MEL extraction from tissue and bile was developed from a previously described method [25] and involved HPLC via UV detection. For kidney and muscle, 10 mL of water:acetonitrile (1:2) was added to 1 g of tissue and the tissues homogenized (BioHomogenizer, Bispec Products Inc., Bartlesville, OK, USA) for 30 sec in a 50 mL conical centrifuge tube. The homogenized sample was then centrifuged (Dynac II centrifuge, Clay Adams, Sparks, MD, USA) for 5 min at 180 x g and the supernatant transferred to microcentrifuge tubes and further centrifuged (Spectrafuge 16M, Labent International, Woodbridge, NJ, USA)for 5 min at 8,200 x g. The supernatant was passed through a MycoSep 224 AflaZon cleanup column (Romer Labs, Union, MO, USA). Finally, 500 µL of the eluant was diluted (1:1) with buffer solution (BUFF; 1.924 g citric acid and 2.34 g of octanesulfonate (Sigma-Aldrich, St. Louis, MO, USA) dissolved in 1 L of distilled water, pH adjusted to 3 using NaOH) before HPLC analysis was performed.
For bile, extraction involved adding 200 µL of bile to 1,800 µL of water:acetonitrile (1:2), vortexing and transferring the samples to microcentrifuge tubes and centrifuging (Spectrafuge 16M, Labent International, Woodbridge, NJ, USA) for 5 min at 8,200 x g. The supernatant was collected and passed through a MycoSep 224 AflaZon cleanup column (Romer Labs, Union, MO, USA). Finally, 500 µL of the eluent was diluted (1:1) with BUFF before high-performance liquid chromatography (HPLC) analysis was performed.
MEL analysis was performed on a commercial HPLC system consisting of a Hitachi Model L-7100 pump with a Model L-7485 UV detector, Hitachi Model L-7200 autosampler with Hitachi D-7000 data acquisition interface and ConcertChrom software on a microcomputer (Hitachi, Tokyo, Japan) with a HyperClone C18 column(Phenomonex, Torrance, CA, USA; 100 x 4.60 mn) and a flow rate of 1 mL/min. UV detection occurred at 240 nm and the mobile phase consisted of BUFF:acetonitrile(ACN; 87:13).
A primary standard of 2,000 ppm MEL solution was diluted with BUFF: ACN (1:1) to prepare standards of 1, 5, 10, and 20 ppm MEL. MEL standards were running before and after each set of samples and used to calculate a standard curve. The area under the curve was calculated, plotted on the standard curve, and used to calculate individual MEL concentrations in samples. The limit of detection was set at 8.0 ppm.
Statistical analysis
Data were analyzed using the general linear model procedures of Statistical Analysis Software [26]. Animal was the experimental unit. Variables that showed significant differences in the ANOVA were compared using Fisher’s protected least significant difference procedure [26]. Regression analysis was performed on all data to determine linear ( yi = a + bxi + Ei ) or quadratic ( yi = a + bxi + cx2i + Ei ) responses. Statistical significance was accepted at a P -value of ≤ 0.05. A log10 transformation was applied to kidney MEL residue data before statistical analysis was performed. Data for MEL residue levels in the muscle was ranked before analysis was performed [27]. Regressions analysis was not performed on ranked data.
Results
Performance and mortality
The effects of MEL on BWG, FI, feed conversion, and mortality are summarized in Table 2. No mortality occurred during the treatment period for pigs fed MEL alone or the two extra pigs fed the MEL + CYA combination. BWG and average daily gain (ADG) decreased linearly ( P = 0.0005) with increasing dietary concentrations of MEL. Inclusion of ≥ 1.00% MEL in the diet decreased BWG and ADG ( P = 0.0205) compared to controls. Extra pigs fed the combination of MEL + CYA had an 18-day BWG of 7.76 kg and an ADG of 0.43.
Table 2. Effects of melamine on performance and organ weights of young barrows
Treatmenta |
Response Variablesb |
Melamine (%) |
BWG(kg) |
ADG(kg) |
FI(kg) |
G: F (kg:kg) |
Mortality (%) |
Liver wt. (g) |
Rliver(%) |
Kidney wt. (g) |
Rkidney(%) |
Basal Diet + 0.00% MEL |
12.76A |
0.61A |
20.68 |
0.63AB |
0 |
614 |
2.64 |
129 |
0.56 |
Basal Diet + 0.25% MEL |
11.90A |
0.57A |
18.23 |
0.65A |
0 |
603 |
2.67 |
145 |
0.64 |
Basal Diet + 0.50% MEL |
11.86A |
0.56A |
18.63 |
0.64AB |
0 |
600 |
2.66 |
131 |
0.58 |
Basal Diet + 0.75% MEL |
11.41AB |
0.54AB |
17.46 |
0.65A |
0 |
576 |
2.63 |
128 |
0.59 |
Basal Diet + 1.00% MEL |
9.50B |
0.45B |
17.48 |
0.56BC |
0 |
592 |
2.97 |
121 |
0.6 |
Basal Diet + 1.25% MEL |
9.44B |
0.45B |
18.07 |
0.53C |
0 |
560 |
2.84 |
126 |
0.63 |
0.75% MEL + 0.75% CYAc |
7.76 |
0.43 |
15.26 |
0.51 |
0 |
499 |
2.48 |
235 |
1.15 |
ANOVA:d |
S.E.M |
0.75 |
0.04 |
1.69 |
0.03 |
|
37 |
0.14 |
10 |
0.04 |
P-value |
0.0205 |
0.0205 |
0.7769 |
0.0427 |
|
0.9191 |
0.4384 |
0.6305 |
0.5644 |
Regression:e |
L: P-value |
0.0005 |
0.0005 |
0.2326 |
0.0076 |
|
0.2761 |
0.1078 |
0.2719 |
0.413 |
Q: P-value |
0.6076 |
0.6076 |
0.3619 |
0.0407 |
|
0.9365 |
0.6352 |
0.7778 |
0.9132 |
- Treatments were the addition of melamine, in percent indicated, to a basal diet. Experimental diets were fed for 21 days, except for MEL + CYA pig,which received diets for 18 days.
- Data are means of five replicate pens with one barrow per pen.
- Values from pigs fed MEL + CYA were not included in statistical analysis. Diet was inclusive of 0.75% MEL and 0.75% CYA added to the basal diet.
- One way analysis of variance values.
- Regression: Linear (L) or quadratic (Q) regression.
- Means within a column with no common superscript are different (P<0.05).
BWG = body weight gain; ADG = average daily gain; FI = feed intake; G:F = gain to feed; RLiver = relative liver weight; RKidney = relative kidney weight; MEL = melamine; CYA = cyanuric acid.
The decrease in gain to feed with increasing dietary concentrations of MEL contained both linear ( P = 0.0076) and quadratic ( P = 0.0407) components. Pigs fed 1.25% MEL had a lower ( P = 0.0427) gain to feed value than controls (0.53 vs 0.63). Gain to feed of extra pigs fed the combination of MEL + CYA was 0.51. FI was not affected ( P = 0.7769) by the addition of up to 1.25% MEL in the diet.
Organ weights
Table 2 contains a summary of the effects of dietary MEL on organ weights of young barrows. Liver weight, kidney weight, relative liver weight (% of body weight), and relative kidney weight (% of body weight) were not affected ( P > 0.05) by dietary MEL.
The similarity of organ weight among control pigs and pigs fed MEL alone is in sharp contrast to Figure 1 which depicts the kidneys from a control pig (tag 26) and a pig fed a combination of MEL + CYA (tag 2). The kidney of the pig fed the MEL + CYA combination was larger in appearance and paler in color than the kidney from the control pig. The effect of a combination of MEL + CYA on kidney weight is also apparent in the relative kidney weight between controls and pigs fed the combination of MEL + CYA (0.56 % vs 1.15 %).

Figure 1. Effects of a combination of melamine and cyanuric acid on the kidney of barrows. Kidneys on left (Tag 2) are from a pig that received a diet that contained a combination of 0.75 % MEL and 0.75 % CYA. The kidney on the right (Tag 26) is from a pig that received the basal diet without MEL (control pig).
Complete blood count (CBC)
The results of the CBC are summarized in Table 3. There were no treatment differences ( P > 0.05) for WBC, RBC, HGB, HCT, MCHC or PLT. MCH ( P = 0.0393) and MCV ( P = 0.0068)decreased linearly with increasing dietary concentrations of MEL. MCV in pigs fed 0.75 (54.08 fL) and 1.25% (54.56 fL) MEL were lower than MCV (59.80 fL) in control pigs. Pigs fed the combination of MEL + CYA had WBC counts that were 66% greater than that of control pigs and 60% greater than that of pigs fed 1.25 % MEL.
Table 3. Effects of melamine on blood variables of young barrows
Treatmenta |
Response Variablesb |
Melamine(%) |
WBC(10^3/µL) |
RBC(10^6/µL) |
HGB(g/dL) |
HCT(%) |
MCV (fL) |
MCH(pg) |
MCHC(g/dL) |
PLT(10^3/µL) |
Basal Diet + 0.00% MEL |
22.46 |
6.96 |
12.28 |
41.58 |
59.80A |
17.7 |
29.6 |
446 |
Basal Diet + 0.25% MEL |
25.63 |
6.98 |
11.96 |
40.14 |
57.64AB |
17.18 |
29.78 |
366 |
Basal Diet + 0.50% MEL |
25.95 |
6.77 |
11.78 |
39.46 |
58.38A |
17.46 |
29.88 |
354 |
Basal Diet + 0.75% MEL |
28.95 |
7.29 |
11.88 |
39.38 |
54.08B |
16.32 |
30.18 |
412 |
Basal Diet + 1.00% MEL |
26.35 |
7.12 |
12.14 |
40.58 |
56.94AB |
17.04 |
29.9 |
419 |
Basal Diet + 1.25% MEL |
23.4 |
6.89 |
11.28 |
37.58 |
54.56B |
16.38 |
29.98 |
439 |
0.75% MEL + 0.75% CYAc |
37.47 |
6.89 |
10.75 |
32.65 |
47.15 |
15.55 |
33 |
580 |
ANOVA:d |
S.E.M |
3.36 |
0.28 |
0.47 |
1.63 |
1.27 |
0.45 |
0.34 |
44 |
P-value |
0.7945 |
0.8188 |
0.7464 |
0.6358 |
0.0295 |
0.2085 |
0.888 |
0.595 |
Regression:e |
L: P-value |
0.7153 |
0.7966 |
0.2675 |
0.1675 |
0.0068 |
0.0393 |
0.3475 |
0.6123 |
Q: P-value |
0.159 |
0.6577 |
0.8254 |
0.9847 |
0.5499 |
0.7992 |
0.4969 |
0.1536 |
- Treatments were the addition of melamine, in percent indicated, to a basal diet. Experimental diets were fed for 21 days, except for MEL + CYA pig,which received diets for 18 days.
- Data are means of five replicate pens with one barrow per pen.
- Values from pigs fed MEL + CYA were not included in statistical analysis. Diet was inclusive of 0.75% MEL and 0.75% CYA added to the basal diet.
- One way analysis of variance values.
- Regression: Linear (L) or quadratic (Q) regression.
- Means within a column with no common superscript are different (P<0.05).
WBC = white blood cell count; RBC = red blood cell count; HGB = hemoglobin; HCT = hematocrit; MCV = mean corpuscular volume; MCH =mean corpuscular hemoglobin; MCHC = mean corpuscular hemoglobin concentration; PLT = platelet count; CBC = complete blood count; MEL =melamine; CYA = cyanuric acid.
Serum chemistry
The treatment means for the large animal maxi profile are summarized in Table 4 and Table 5. Serum concentrations of BUN, CREAT, ALB, GLOB, T Bili, D Bili, TP, GGT, and CPK were not affected by dietary concentrations of MEL alone. A linear decrease ( P = 0.0124) was observed for serum GLU as dietary MEL levels increased. In contrast, a linear increase ( P = 0.0049) in AST was observed as dietary MEL levels increased. Pigs fed the combination of MEL + CYA had serum BUN levels that were 11-fold greater than control pigs and 12-fold greater than that of pigs fed 1.00% MEL. Pigs fed the combination of MEL + CYA also had a mean CREAT level that was seven-fold greater than that of control pigs and pigs fed 1.25% MEL. Serum concentrations of P, Mg, Na, K and Cl were not affected by dietary concentrations of MEL alone. There was a linear ( P = 0.0053) decrease in serum Ca levels with increasing dietary concentrations of MEL.
Table 4. Effects of melamine on serum proteins, bilirubin, and select enzymes of young barrow
Treatmenta |
ANOVAd |
Regressione |
Melamine (%) |
|
Response Variablesb |
0.00% |
0.25% |
0.50% |
0.75% |
1.00% |
1.25% |
MEL +CYAc |
S.E.M |
P-value |
Linear P-Value |
Quadratic P-Value |
GLU |
134 |
136 |
139 |
127 |
122 |
117 |
166 |
6 |
0.1436 |
0.0124 |
0.2182 |
AST |
24.2 |
29.8 |
38.6 |
36.8 |
37.8 |
49.2 |
26 |
5.9 |
0.1033 |
0.0049 |
0.967 |
BUN |
10.2 |
8.6 |
10.2 |
9.8 |
10 |
8.8 |
111 |
1.3 |
0.8944 |
0.7568 |
0.7504 |
CREAT |
0.84 |
0.76 |
0.82 |
0.88 |
0.86 |
0.78 |
5.8 |
0.05 |
0.6179 |
0.8971 |
0.5304 |
ALB |
3.3 |
3.18 |
3.26 |
3.14 |
3.06 |
2.96 |
3.6 |
0.14 |
0.5698 |
0.0651 |
0.6671 |
GLOB |
2.02 |
1.98 |
2.08 |
2.22 |
2.2 |
2.3 |
2.75 |
0.19 |
0.8166 |
0.1549 |
0.8947 |
T BIL |
0.1 |
0.1 |
0.12 |
0.3 |
0.22 |
0.2 |
0.15 |
0.08 |
0.4496 |
0.1324 |
0.5017 |
D BILI |
0 |
0 |
0 |
0 |
0.02 |
0 |
0 |
0.008 |
0.4389 |
0.3973 |
0.7955 |
TP |
5.32 |
5.16 |
5.34 |
5.36 |
5.26 |
5.26 |
6.35 |
0.16 |
0.9494 |
0.9874 |
0.817 |
GGT |
33 |
31.6 |
27.4 |
30.4 |
27.8 |
33.6 |
30.5 |
2.6 |
0.4475 |
0.803 |
0.0821 |
CPK |
1014 |
1567 |
2262 |
914 |
746 |
1345 |
627.5 |
368 |
0.0794 |
0.5252 |
0.401 |
- Treatments were the addition of melamine, in percent indicated, to a basal diet. Experimental diets were fed for 21 days, except for MEL + CYA pigs (2) which received diets for 18 days.
- Data are means of five replicate pens with one barrow per pen.
- Values from pigs fed MEL + CYA were not included in statistical analysis. Diet was inclusion of 0.75 % MEL and 0.75 % CYA added to the basal diet.
- One way analysis of variance values.
- Regression: Linear (L) or quadratic (Q) regression.
GLU = glucose (mg/dL); AST = aspartate aminotransferase (U/L); BUN = blood urea nitrogen (mg/dL); CREAT = creatinine (mg/dL); TP = total protein (g/dL); GLOB = globulin; T BIL = total bilirubin (mg/dL); D BILI = direct bilirubin (mg/dL); ALB = albumin (g/dL); GGT = gamma- glutamyl transpeptidase (U/L); CPK = creatine phosphokinase (U/L); MEL = melamine; CYA = cyanuric acid.
Table 5. Effects of melamine on serum mineral concentrations of young barrows
|
|
Treatmenta |
ANOVA:d |
Regression:e |
Response Variablesb |
|
Melamine (%) |
|
S.E.M |
P-Value |
Linear |
Quadratic |
0.00% MEL |
0.25% MEL |
0.50% MEL |
0.75% MEL |
1.00% MEL |
1.25% MEL |
MEL + |
P-Value |
P-Value |
CYAc |
|
|
Ca |
11.6 |
11 |
11.2 |
11 |
10.3 |
10.6 |
11.5 |
0.3 |
0.0542 |
0.0053 |
0.8687 |
P |
11.2 |
10.8 |
10.7 |
10.6 |
10.3 |
11.2 |
12.8 |
0.5 |
0.7652 |
0.6582 |
0.2056 |
Mg |
2.52 |
2.44 |
2.46 |
2.42 |
2.36 |
2.38 |
3.3 |
0.15 |
0.9762 |
0.4036 |
0.8879 |
Na |
148 |
144 |
142 |
147 |
144 |
141 |
142 |
3 |
0.6225 |
0.2379 |
0.9891 |
K |
6.24 |
5.82 |
5.92 |
5.82 |
6 |
6.86 |
6.2 |
0.54 |
0.7361 |
0.4137 |
0.1617 |
Cl |
104 |
103 |
102 |
105 |
102 |
101 |
96 |
2 |
0.8319 |
0.4993 |
0.7971 |
- Treatments were the addition of melamine, in percent indicated, to a basal diet. Experimental diets were fed for 21 days, except for MEL + CYA pigs (2) which received diets for 18 days.
- Data are means of five replicate pens with one barrow per pen.
- Values from pigs fed MEL + CYA were not included in statistical analysis. Diet was inclusion of 0.75 % MEL and 0.75 % CYA added to the basal diet.
- One way analysis of variance values.
- Regression: Linear (L) or quadratic (Q) regression.
Ca = calcium (mg/dL); P = phosphorus (mg/dL); Mg = magnesium (mg/dL); Na = Sodium (mEq/L); K = potassium (mEq/L); Cl = chloride (mEq/L); M =melamine; CYA = cyanuric acid.
Urinalysis
Urine analysis from two pigs per treatment showed no difference in any of the variables measured (clarity, specific gravity, glucose, bilrubin, ketones, heme, pH, protein dipstick (4+ scale), urobilinogen, WBC, RBC, bacteria, round and squamous cells, or casts). However, one pig each from the control, 0.50% MEL, 0.75% MEL, and 1.00% MEL groups presented with amorphous crystals. One pig each from the 1.00% MEL and 1.25% MEL groups presented with brushite crystals present in the urine. One pig fed 1.25% MEL presented with crystals that had the structural appearance of MEL (Figure 2A). Figure 2 shows the similarity between crystals taken from the urine of a pig fed 1.25% MEL and a pig fed the combination of MEL + CYA (photos ‘A’ and ‘B’, respectively). These crystals are similar in structure to crystals found in young barrows fed a combination of 100 mg/kg MEL + 100 mg/kg CYA [23].
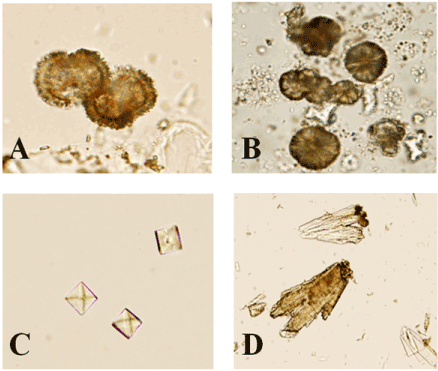
Figure 2. Crystals observed in the urine of pigs fed melamine and a combination of melamine and cyanuric acid. MEL crystals present in the urine of a pig fed 1.25 % MEL (A). Crystals observed in the urine of a pig fed a combination of MEL and CYA (B). Calcium oxalate crystals in the urine from a control pig (C). Calcium phosphate crystals in the urine of a pig fed 1.25 % MEL (D).
Additional analysis of urine from one pig of the control, 1.25% MEL and combination MEL + CYA groups was performed. This revealed calcium oxalate crystals present in the urine of the control pig (Figure 2C) and calcium phosphate crystals in the urine of the pig fed 1.25% MEL (Figure 2D). Crystals with the structural appearance of MEL were also found in the urine of the pig fed 1.25 % MEL and the pig fed the combination of MEL + CYA. The calcium oxalate crystals are of little clinical value as they often develop if a urine specimen is left standing [28]. Calcium phosphate crystals, also called brushite, can indicate urinary tract infections but otherwise are of little clinical value [28].
Both pigs fed the combination of MEL + CYA presented with white blood cells present in the urine. The urine also contained a moderate amount of crystals that were consistent with MEL-CYA complexes. All other variables measured were similar to results obtained from MEL fed pigs.
Tissue residues
MEL levels in the kidney, muscle (hind quarter), and bile are summarized in Table 6. The increase in MEL concentrations in the kidney with increasing dietary concentrations of MEL contained both linear ( P < 0.0001) and quadratic ( P < 0.0001) components. Kidneys from pigs fed diets containing MEL alone had residue levels greater than controls ( P < 0.0001). MEL concentrations in bile increased linearly ( P < 0.0001) with increasing dietary MEL concentrations. Muscle ( P < 0.0001) and bile ( P < 0.0001) from pigs fed diets containing ≥ 0.50%MEL had residue levels that were higher than controls. Pigs fed the combination of MEL + CYA had an average MEL concentration of 32 ppm in the kidney, 17 ppm in the muscle and 46 ppm in the bile.
Table 6. Melamine concentrations in the kidney, muscle, and bile of young barrows
Treatmenta |
Response Variables |
Melamine |
Kidneyb |
Muscle - hind quarterc |
Biled |
(%) |
(ppm) |
(ppm) |
(ppm) |
Basal Diet + 0.00% MEL |
NDD |
NDC |
NDC |
Basal Diet + 0.25% MEL |
41C |
12C |
20C |
Basal Diet + 0.50% MEL |
75B |
33B |
63 B |
Basal Diet + 0.75% MEL |
75B |
33 B |
77 B |
Basal Diet + 1.00% MEL |
143A |
62A |
85 B |
Basal Diet + 1.25% MEL |
125A |
57 A |
126 A |
0.75%MEL + 0.75%CYAe |
32 |
17 |
46 |
ANOVA:f |
S.E.M. |
0.06 |
2 |
9 |
P-value |
< 0.0001 |
< 0.0001 |
< 0.0001 |
Regression:g |
L: P-Value |
< 0.0001 |
- |
< 0.0001 |
Q: P-Value |
< 0.0001 |
- |
0.6718 |
- Treatments were the addition of melamine, in percent indicated, to a basal diet. Experimental diets were fed for 21 days, except for MEL + CYA pigs (2) which received diets for 18 days.
- Data are means of four replicate pens with one barrow per pen. Statistical analysis was performed on transformed data (log10).
- Data are means of four replicate pens with one barrow per pen. Statistical analysis was performed on transformed data (ranked data).
- Data are means of five replicate pens with one barrow per pen.
- Values from pigs fed MEL + CYA were not included in statistical analysis. Diet was inclusion of 0.75 % MEL and 0.75 % CYA added to the basal diet.
- One way analysis of variance values.
- Regression: Linear (L) or quadratic (Q) regression.
- Means within a column with no common superscript are different (P< 0.05).
- MEL = melamine; CYA = cyanuric acid; ND = none detected.
Pathology
Gross pathology
No mortality occurred during the 21-day experimental period (Table 2) including the pigs fed the combination of MEL + CYA for 18 days. During termination, no differences were noted in liver and kidney size, or color among pigs fed MEL alone. No crystals were present when the bile of pigs fed 1.25% MEL was examined microscopically.
Livers from pigs fed t2021 Copyright OAT. All rights reservsignificantly different from those of control pigs. However, kidneys from pigs fed the combination of MEL + CYA were 82% larger than kidneys from control pigs, and kidneys from these pigs were pale and yellow in color. Figure 1 demonstrates the sharp contrast in size and color of kidneys from a pig fed the combination of MEL + CYA (Tag 2) and a control pig (Tag 26). On cross section of the kidneys there were numerous fine yellow crystals in the renal medulla (Figure 3).
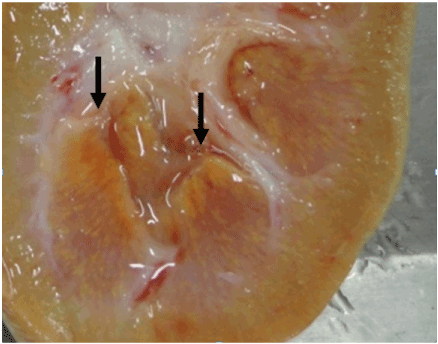
Figure 3.Effects of a combination of MEL and CYA on the kidney of young barrows. Cross section of a kidney from a pig fed MEL and CYA (0.75 % of each compound) for 18 days. Yellow to golden fine crystals are present (arrows).
Histopathology
Evaluation of liver, kidney, and muscle revealed no change in control pigs and pigs fed MEL alone. Figure 4 shows no microscopic changes in the kidney from a control pig (Figure 4A) and a pig fed 1.25% MEL (Figure 4B). Bile from a control pig, a pig fed 1.25% MEL, and a pig fed the combination of MEL + CYA were examined microscopically and all were found to be free of crystals. However, three pigs, one from the 1.00% MEL group and two from the 1.25% MEL group, presented with multifocal moderate to severe suppurative subacute inflammation of unidentified etiologies (likely due to bacterial infection) in the liver, kidney, and muscle but the inflammation did not appear to be directly related to MEL consumption.
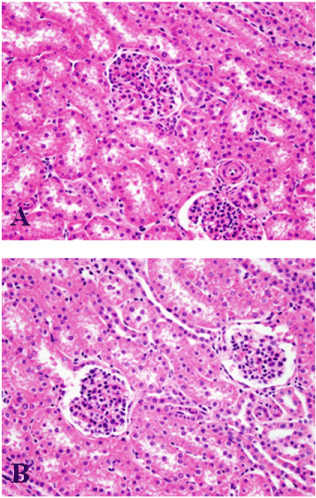
Figure 4. Microscopic effects of melamine in the kidney of barrows. Kidney from a pig fed the basal diet without MEL (control pig, A). Kidney from a pig fed the basal diet plus 1.25 % MEL (B).
The pigs fed the combination of MEL + CYA had no microscopic lesions in the liver. The kidneys however, contained tubular degeneration with numerous crystals present in the tubular lumen. Crystals were golden brown to yellow in color and appeared round with spokes emanating from the center (Figure 5A-D).
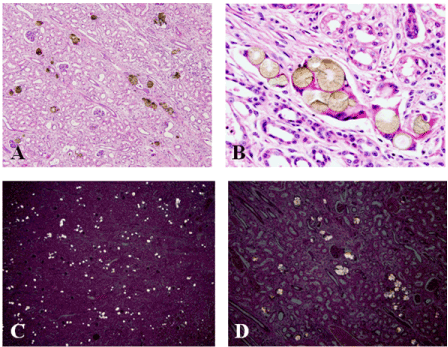
Figure 5. Effects of a combination of MEL and CYA on the kidneys of young barrows. Note golden-brown radial spheroid crystals in the kidneys of combination fed pigs (A and B). These crystals were visible under polarized light (C and D).
It was also determined that while tissues fixed in formalin and ethanol had similar microscopic characteristics, the ethanol fixation preserved crystals slightly better in the tissue. The total number of crystals in tissues fixed in formalin and ethanol was similar. However, crystals in the formalin fixed tissues had a tendency to break off easily leaving empty spaces in the tissue.
Discussion
Body weight gain and gain to feed were the only performance variables that were significantly lower than controls when MEL levels were ≥ 1.00 % and equal to 1.25 % of the pig’s diet, respectively. Barrows fed 1.00 % and 1.25 % MEL gained 3.26 and 3.32 kg less than controls, respectively. While this decrease in weight gain for the 1.00 and 1.25 % MEL treatment groups was significant, no mortality occurred and FI, while numerically lower in groups fed MEL, was not significantly decreased. This suggests that while MEL consumed at ≥ to 1.00 % of the diet is not fatal, performance of barrows is reduced. These data are consistent with previous research in pigs and poultry: 1) feeding 200 mg/kg BW/day ( ? 0.50 % of the diet) to barrows had no effect on daily gain [23]; 2) feeding ≥ 1.0 % MEL caused a decrease in feed intake and body weight gain in broilers [25] and ducks [29]; 3) feeding 1.5 % MEL caused a reduction in body weight gain reduction in poults[30].
Blood urea nitrogen (BUN) is a measure of urea or the end product of protein metabolism and is excreted by the kidneys [31]. Therefore, BUN is directly related to protein intake, nitrogen metabolism, and kidney excretion rate and can be used to measure kidney function [31]. Creatinine (CREAT), a waste product generated from muscle metabolism [32], is cleared from the body by the kidney [31]. In the current study, BUN and CREAT concentrations of pigs fed MEL alone were not different from controls and values were within or near (± 0.6) references ranges [33]. This suggests, along with no changes in kidney size (kidney weight or relative kidney weight) and no changes in the appearance of the kidney (gross or microscopically), that MEL at levels up to 1.25% of the diet does not appear to affect the kidney function of young barrows. Similar results were observed when feeding 400 mg/kg BW ( ? 0.7% of the diet ) of MEL to 16 week old pigs and no gross lesions were observed in the kidney, and BUN and CREAT levels were within the normal range [22]. An additional study reported that barrows fed 200 mg/kg BW/day MEL ( ? 0.5% of the diet) for 28 days showed no differences among treatments in any variable measured (BWG, average relative kidneys weight, BUN or CREAT) [22]. When feeding up to 18,000 ppm (1.8% of the diet) MEL to rats for 13 weeks it was noted that the kidneys of male rats were unaffected by MEL [34]. It was reported that slightly higher levels of MEL (1.5%) than was used in the current study caused mild accumulation of spherical basophilic crystals in the collecting ducts and collecting tubules of broilers [25]. In poults, feeding ≥ 1.00% MEL caused gross pathology that was associated with renal failure, while feeding ≥ 2.0% MEL caused ? 63 % mortality [30].
Urine analysis revealed no difference among any variables measured. Only the presence of brushite (calcium phosphate), calcium oxalate, and amorphous crystals were different among treatments. The amorphous crystals identified from the current analysis are most likely amorphous urates or amorphous phosphate crystals. However, the presence of calcium phosphate and oxalate, and amorphous (urates or phosphate) crystals does not appear to be treatment related and are often of little clinical value [28]. One pig fed 1.25 % MEL had crystals in the urine that appear similar to crystals described in another study involving pigs fed a combination of MEL + CYA [23]. In addition, the crystals from the 1.25% MEL pig appeared similar to crystals found in pigs fed the combination of MEL + CYA in the current study. Previous research has demonstrated that crystals from pigs fed only MEL had MEL:CYA ratios of 1:1 [23]. With the ability of microorganisms to convert MEL to CYA documented [5,35], more research is needed to confirm if this conversion of MEL to CYA can be accomplished by microorganisms that reside in the gastrointestinal tract of mammals [23] or alternatively if MEL can be metabolized to CYA by mammals.
Mean corpuscular volume (MCV) showed significant difference among treatments. Mean corpuscular hemoglobin (MCH) decreased in a linear fashion as dietary MEL levels increased, and serum aspartate aminotransferase (AST) increased in a linear fashion as MEL levels increased However, MCV and AST values from all treatments stayed within normal ranges for swine [33]. MCH values, from all treatments, were also close to reference ranges (± 0.68) [33].
The highest MEL concentrations were found in the kidney and bile. MEL concentrations in the muscle were about half of what was found in the kidney and bile. For example, kidneys from pigs fed 1.25% MEL had MEL concentrations of 125 ppm, while the muscle only had 57 ppm MEL. Higher concentrations of MEL in the kidney are consistent with previous research reports [11,12] that noted precipitation of MEL and CYA complexes in the kidney probably due to an increase in the concentrations of the compounds as they move down the osmotic gradient [12]. Therefore, it is reasonable to assume that MEL concentrations in the kidney would be greater than that in other tissues, due to the compound becoming more concentrated as the kidneys filter unwanted compounds (MEL) out of the blood and into the urine. The fact that the bile had similar MEL values as the kidney suggests that the bile is a route of elimination in the pig. Bile as a route of elimination of MEL has also been suggested to occur in poultry [25,29,36].
Levels of MEL residues reported in the breast, kidney, and bile tissues of broilers and poults fed 1.00% MEL [30] were higher than levels reported in the current study. These differences in MEL residue concentrations between poultry and swine can possibly be explained by differences in renal physiology as well as how poultry and swine absorb and process MEL. Another possible explanation could be the size difference between a 3 wk old bird and an 8 wk old barrow. Assuming the same amount of MEL is absorbed, MEL would be more concentrated in the smaller ( ? 550 g) bird than in the larger ( ? 21,730 g) barrows. Differences in feed intake between an 8 wk old pig and 3 wk old duck could also explain the difference in MEL residue levels. Other possible explanations include: 1) differences in how species absorb and transport MEL from their gastrointestinal tract to their body; 2) differences in how MEL is filtered by the liver; 3) the degree to which hepatobiliary recirculation occurs; 4) differences in the kidneys’ ability to filter MEL from the blood; and 5) the ability of the kidneys to excrete MEL into the urine without precipitation occurring. Water flow through the kidney could be a major factor in the ability of the kidney to excrete MEL into the urine without precipitation occurring, thus decreasing renal damage. Therefore, animal species with higher water consumption resulting in larger urine output might be better able to flush MEL out of their kidney, thus preventing precipitation.
Performance of pigs fed the combination of MEL + CYA (0.75% of each compound) was much poorer than the performance of pigs fed only 0.75% MEL. Relative kidney weights were dramatically increased in pigs fed the combination of MEL + CYA (approximately double that of controls). Blood parameters such as BUN and CREAT of pigs fed the combination of MEL + CYA were also elevated well above that of controls pigs ( ?11 and 7 times higher, respectively), indicating renal failure. Pigs fed the combination of MEL + CYA also had elevated WBC counts and WBC present in the urine. Microscopic examination of kidneys from pigs fed the combination of MEL + CYA revealed tubular degeneration and crystals that were golden brown to yellow in color. Crystals from the MEL + CYA pigs were visible under polarized light, a characteristic consistent with previously described MEL + CYA crystals [10,11,22,30]. These data are in agreement with previous research in which a combination of MEL and CYA was shown to be more toxic to mammals than MEL alone [11,12,22,23]. However, in poults, the addition of CYA to diets containing MEL reduced the negative effects of MEL on feed intake and body weight gain [30]. Furthermore, the addition of CYA to diets containing MEL appears to ameliorate the negative effects of MEL on performance and mortality rates in young Pekin ducks [36].
MEL residue levels in the kidney, muscle, and bile of pigs fed the combination of MEL + CYA were lower than tissues from pigs fed only 0.75% MEL. This suggests that while a combination of MEL and CYA is more toxic to the pig, there is less absorption of the MEL-CYA acid complex from the gastrointestinal tract as compared to MEL alone. This decrease in bioavailability of MEL-CYA complex as compared to MEL alone, due to precipitation of MEL-CYA in the gastrointestinal tract, has previously been described [22].
Conclusion
In conclusion, dietary levels of up to 0.75% MEL were not toxic to young barrows fed contaminated diets for 21 days. MEL levels of 1.00% and 1.25% of the diet decreased growth performance of young barrows. There appeared to be no treatment effect on kidney function, as determined by serum levels of BUN and CREAT, and histopathology results. These results are in agreement with results from similar experiments conducted on mammals [22,23,34]. Residue levels in the kidney and bile suggest that MEL may be eliminated via the bile as well as the kidney in pigs. The use of the hepatobiliary system as an alternative route of elimination has previously been suggested to occur in poultry [30]. More research is needed to determine if conversion of MEL to CYA can occur by microbes in the gastrointestinal tracts of mammals and/or by metabolism in mammals. Finally, a combination of MEL and CYA (0.75% of each compound) was more toxic to young barrows that pigs fed up to 1.25% MEL alone.
Conflict of interest
The authors declare that there are no conflicts of interest.
References
- OSHA (2006) Occupational safety and health adminstration (OSHA)Chemical sampling information, melamine. Occupational Safety and Health Administration.
- Hilts C, Pelletier L (2009) Background paper on occurrence of melamine in food and feed., World Health Organization: Meeting on toxicological and health aspects of melamine and cyanuric acid.
- Tyan YC, Yang MH, JongSB, Wang CK, Shiea J (2009) Melamine contamination. Anal BioanalChem395: 729-735.[Crossref]
- WHO (2008) World Health Organization (WHO) Toxicological and Health Aspects of Melamine and Cyanuric Acid. World Health Organization.
- Wackett LP, Sadowsky MJ, Martinez B, Shapir N (2002) Biodegradation of atrazine and related s -triazine compounds: from enzymes to field studies. Applied Microbiology and Biotechnology58: 39-45.
- Perdigao LM, Champness NR, Beton PH (2006) Surface self-assembly of the cyanuric acid-melamine hydrogen bonded network. ChemCommun 538-540.
- Seffernick JL, Dodge AG, Sadowsky MJ, Bumpus JA, Wackett LP (2010) Bacterial ammeline metabolism via guanine deaminase. J Bacteriol192: 1106-1112.[Crossref]
- Yang S, Ding J, Zheng J, Hu B, LI J, et al. (2009) Detection of melamine in milk products by surface desorption atmospheric pressure chemical ionization mass spectrometry. Analytical Chemsitry81: 2426-2436.
- Cianciolo RE, Bischoff K, Ebel JG, Winkle TJV, Goldstein RE, et al. (2008) Clinicopathological, histological, and toxicological findings in 70 cats inadvertently exposed to pet food contaminated with melamine and cyanuric acid. J Am Vet Med Assoc233: 729-373.[Crossref]
- Brown CA, Jeong K, Poppenga RH, Puschner B, Miller DM, et al. (2007) Outbreaks of renal failure associated with melamine and cyanuric acid in dogs and cats in 2004 and 2007. J Vet Diagn Invest 19: 525-531.[Crossref]
- Puschner B, Poppenga RH, Lowenstine LJ, Filigenzi MS, Pesavento PA (2007) Assessment of melamine and cyanuric acid toxicity in cats. J Vet Diagn Invest19: 616-624.[Crossref]
- Dobson RL, Motlagh S, Quijano M, Cambron RT, Baker TR, et al. (2008) Identification and characterization of toxicity of contaminants in pet food leading to an outbreak of renal toxicity in cats and dogs. Toxicol Sci106: 251-262.
- Tolleson WH (2009) Renal toxicity of pet foods contaminated with melamine and related compounds, American Chemical Society 57-77.
- Buur JL, Baynes RE, Riviere JE (2008) Estimating meat withdrawal times in pigs exposed to melamine contaminated feed using a physiologically based pharmacokinetic model. RegulToxicolPharmacol51: 324-331.[Crossref]
- Karbiwnyk CM, Andersen WC, Turnipseed SB, Storey JM, Madson MR, et al. (2009) Determination of cyanuric acid residues in catfish, trout, tilapia, salmon and shrimp by liquid chromatography-tandem mass spectrometry. Anal Chimica Acta 101-111.
- USDA (2007) United States Department of Agriculture (USDA). Food Safety and Inspection Service. Disposition of Hogs and Chickens from Farms Identified as Having Received Pet Food Scraps Contaminated with Melamine and Melamine-Related Compounds and Offered for Slaughter., Docket No. FSIS 2007-0018, 29945-29948.
- Chan EY, Griffiths SM, Chan CW (2008) Public-health risks of melamine in milk products. Lancet 372: 1444-1445.[Crossref]
- PEHSU (2009) Pediatric Environmental Health Specialty Units (PEHSU). Melamine: Information for Pediatric Health Professionals. Pediatric Environmental Health Speciality Units.
- González J, Puschner B, Pérez V, Ferreras MC, Delgado L, et al.(2009) Nephrotoxicosis in Iberian piglets subsequent to exposure to melamine and derivatives in spain between 2003 and 2006. Journal of Veterinary Diagnostic Investigation 21: 558-563.[Crossref]
- Lee CH, Ooi PT, Sheikh Omar AR, Lim BK (2011) Melamine toxicity in pigs. Peranika Journal of Tropical Agricultural Science 34: 175-179.
- Nilubol D, Pattanaseth T, Boonsri K, Pirarat N, Leepipatpiboon N (2009) Melamine- and cyanuric acid-associated renal failure in pigs in Thailand. Vet Pathol46: 1156-1159.[Crossref]
- Reimschuessel R, Gieseker CM, Miller RA, Ward J, Boehmer J, et al. (2008) Evaluation of the renal effects of experimental feeding of melamine and cyanuric acid to fish and pigs. Am J Vet Res 69: 1217-1228.[Crossref]
- Stine CB, Reimschuessel R, Gieseker CM, Evans ER, Mayer TD, et al. (2011) A No Observable Adverse Effects Level (NOAEL) for pigs fed melamine and cyanuric acid. RegulToxicolPharmacol60: 363-372.[Crossref]
- NRC (1998) National Research Council (NRC). Nutrient Requirements of Swine, National Academy of Science, Washington, DC 1998.
- Brand LM, Murarolli RA, Gelven RE, Ledoux DR, Landers BR, et al. (2012) Effects of melamine in young broiler chicks. Poult Sci91: 2022-2029.[Crossref]
- SAS (2006) Statistical Analysis Software (SAS) SAS Institute Inc., Cary, NC, USA.
- Conover WJ, Iman L (1981) Rank transformation as a bridge between aarametric and nonparametric statistics. The American Statistican35: 124-129.
- SpencerD (2007) Urinalysis. A Professinal Development Resourice by Daniel Spencer.
- Landers BR, Murarolli RA, Gelven RE, Brand LM, Ledoux DR, et al. (2012) Effects of melamine in young Pekin ducks. International Journal of Poultry Science11: 730-738.
- Brand LM (2011) Effects of dietary melamine and cyanuric acid in young broilers and turkey poults. MS Thesis, Animal science. University of Missouri - Columbia, Mo.
- Nicoll D, McPhee SJ, Pignone M, Lu CM (2012) Pocket Guide to Diagnostic Tests, 5e. The McGraw-Hill Companies.
- Nabili ST (2012) Creatinine Blood Test, MedicineNet.com.
- Merck (2011) The Merck Veterinary Manual, in: C.M. Kahn (Ed.), 9th Ed. Merck Sharp and Dohem Corp, Whitehouse Station, NJ, USA.
- Melnick RL, Boorman GA, Haseman JK, Montali RJ, Huff J (1984) Urolithiasis and bladder carcinogenicity of melamine in rodents. ToxicolApplPharmaco72: 292-303.[Crossref]
- Jutzi K, Cook AM, Hutter R (1982) The degradative pathway of s-triazine melamine: The steps to ring cleavage. Biochem J208: 679-684.[Crossref]
- Landers BR, Murarolli RA, Gelven RE, Brand LM, Kobashigawa EH, et al. (2013) Individual and combined effects of melamine and cyanuric acid in young Pekin ducks. International Journal of Poultry Science12: