Background: Changes in the levels of miR-21 and miR-145 in prostate tissue have previously been reported to accompany the development of cancer. These reports have mostly been based on PCR applied to RNA extracts of tissue homogenates, a methodology which does not permit to identify the cells of origin of the miRNA.
Methods: We used in-situ-hybridization to characterize the cellular distribution of miR-21 and miR-145 in paraffin sections of total prostatectomy specimens, related to the histological appearance and various cell types. Furthermore, we compared the expression pattern of miR-21 with that of three putative target proteins of miR-21 inhibition, by immunohistochemical staining of neighboring sections.
Results: MiR-145 was found to be of strict stromal origin. The dominant source of miR-21 was also found to be stromal cells, with a prominent signal detected in cancerous areas. However, in areas of inflammation, strong signal was found both in stromal and epithelial cells. The most prominent epithelial signal was detected in lesions
identified as prostate inflammatory atrophy (PIA) and prostate intraepithelial neoplasia (PIN).
Conclusion: The results of the present study indicate that the change of miR-145 level found by PCR may reflect the percentage of stroma in the sample, rather than an effect of the carcinomatous transformation of the epithelium. A primary biologic function of miR-
21 may be related to tissue damage and inflammation, with a possible secondary effect on carcinogenesis through inhibition of PDCD4. Our findings raise an important caveat, implying that miRNA data obtained by PCR in samples from solid tissues should be corroborated by in situ hybridization or similar methodology.
in situ hybridization, microRNA, miR-145, miR-21, prostate cancer
Since their discovery, micro-RNAs (miRNA) have raised wide interest as potential biomarkers for a host of diseases. These short strands of RNA, which do not code for protein, play an important role in the regulation of protein expression, by their ability to bind to complementary sequences on specific mRNA and thus suppress its translation. Several miRNAs, which have been detected in blood or tissue homogenates, have been shown to correlate significantly with the presence of prostate cancer, or with the risk of developing a tumor at a later stage, or with the subsequent course of the disease in patients with an established cancer diagnosis [1]. However, published reports are often contradictory. Putative biomarkers that are based on a statistical correlation without an understanding of their biological origin may not necessarily reflect a direct connection with the underlying pathological process. RNA is produced inside cells, and in a solid tissue consisting of several cell types, individual miRNA sequences may be produced in certain cells and not in
others, perhaps under particular conditions of cellular physiology. This aspect of miRNA-biology cannot be addressed by analysis of biological fluids or tissue homogenates, a simple fact which is all too often overlooked in current literature.
We therefore performed a study of two putative prostate cancer biomarker miRNAs, miR-21 and miR-145, in order to identify the cells of origin in prostatectomy specimens [2,3]. We also examined the expression of the following three proteins in the same cells that had been characterized with respect to miR-21 expression: Phosphate and tensin homolog (PTEN), programmed cell death protein 4 (PDCD4), and B-cell translocation gene 2 (BTG2). These are all known tumor suppressors, which can be inhibited by miR-21, and they have been reported to show altered expression in association with both miR-21 and prostate cancer [4-8].
Biological material
Since 2004, Biobank1 – the Regional Research Biobank of Central Norway – has systematically collected tissue material from prostate specimens removed surgically as a curative treatment for prostate cancer. Before the operation, patients are routinely invited to donate material to the research biobank, and practically all those asked give their written consent. All material used in the present study was obtained from patients who had consented to a broad range of medical research. The regional committee for research ethics (REK) approved of the procedure.
The microscopic slides from a series of consecutive patients, operated in the beginning of 2017, were re-examined. Included in the study were the first 25 cases in which a slide from the central part of the specimen contained at least one high power field dominated by each of the following three histological patterns: non- malignant glands (hereafter designated as “normal epithelium”), adenocarcinoma, and putative premalignant changes. The cancerous component was mostly of Gleason grade 4, but oftentimes also with some areas of grade 3, and in a few cases an additional grade 5 component. As possibly premalignant lesions were considered atrophic glands with or without surrounding inflammation and irregular epithelial proliferation consistent with prostatic intraepithelial neoplasia (PIN). From each selected FFPE block, serial sections of thickness 4μm were cut for H&E staining, in situ hybridization for detection of miR-21 and miR-145, and protein immunohistochemistry, respectively.
Probes and antibodies
For miRNA in-situ hybridization, digoxigenin labelled miRCURY LNA™ miRNA detection probes were purchased from Exiqon/Qiagen. These probes were synthesized to hybridize with hsa-miR-21-5p (MIMAT0000076: 5'UAGCUUAUCAGACUGAUGUUGA) and hsa-miR-145-5p (MIMAT0000437:
5'GUCCAGUUUUCCCAGGAAUCCCU), respectively. As positive control was used a probe specific for the U6 snRNA, and as negative control was used a scrambled probe with no known complementary sequence among human transcripts, both purchased from Exiqon/Qiagen.
Anti-PTEN (D4.3) XP® rabbit mAb was obtained from Cell Signaling Technology, whereas Anti-PDCD4 (HPA001032) and Anti-BTG2 (HPA002355) rabbit antibodies were purchased from Sigma-Aldrich.
miRNA in situ hybridization (miRNA ISH)
In situ hybridization was performed using miRCURY LNA™ microRNA ISH Optimization Kit (FFPE) (Exiqon) with recommended reagents according to the suppliers’ protocol. Some optimization adjustments were made to strike the balance between sensitivity and specificity. Thus, the probes were diluted to 50 nM, and a volume of 60μl was added to each section. Hybridization and stringency wash were performed at 51°C
for detection of miR-21, and at 55°C in the case of miR-145. Prostate sections were used for both positive and negative control. Counterstaining was done with Nuclear Fast Red™ (H3403, Vector laboratories).
Immunohistochemistry (IHC)
Sections were stained manually using Envision Detection DAB+ Rabbit/Mouse kit (K5007, Dako). Heat-induced epitope-retrieval (HIER) was performed prior to staining by heating to 97°C for 20 minutes, then cooling to 65°C. Target Retrieval Solution (TRS) pH 6 (S2369, Dako) was used for PDCD-4 staining, whereas TRS pH 9 (K8004, Dako) was used for detection of PTEN and BTG2. PDCD-4 antibody was diluted 1:250, PTEN antibody 1:50 and BTG2 antibody 1:25. Counterstaining was performed using hematoxylin. Positive and negative control procedures were performed according to the suppliers’ protocols, using specific tissue types for each antibody, selected on basis of the expression reported in The Human Protein Atlas (www.proteinatlas.org). Thus, sections from normal cerebellum were used for BTG2, prostate for PDCD4 and testicle for PTEN. Prostate sections were used as negative controls for all three antibodies.
miR-21 ISH
In all sections, we observed little or no signal in areas with ordinary, hyperplastic glands, i.e. in areas with essentially normal epithelium. On the other hand, there was a widespread positivity in spindle shaped stromal cells in cancerous areas, as shown in (Figures 1-3). However, the staining intensity varied somewhat between sections and between different areas in the same section. Neither normal nor cancerous epithelium showed any sign of positive reaction.
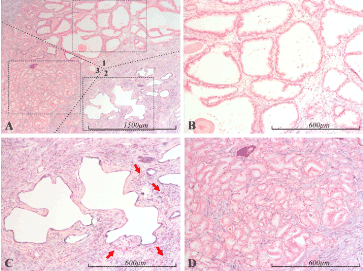
Figure 1. miR-21 expression in the prostate. Micrographs of prostate sections stained for expression of miR-21 by in situ hybridization (blue color). Panel A depicts several zones, roughly delineated by dotted lines, of normal glands (1), atrophic glands (2) and Gleason 3 prostate cancer (3). Representative samples of the respective areas in A, marked with dashed squares, are shown with higher magnification in panels B (1), C (2) and D (3). In the sample of normal glandular epithelium (B), miR-21 staining is completely absent from the epithelium, whereas the stroma shows some staining, with a gradual decrease from the lower right corner to complete absence in the upper right corner. Sample C depicts atrophic glands, which are intensely miR-21 positive, as is the surrounding stroma. In the surrounding stroma, red arrows indicate inflammatory foci. Sample D depicts Gleason 3 prostate cancer. The cancerous epithelium is completely miR-21 negative, while the surrounding stroma is prominently miR-21 positive
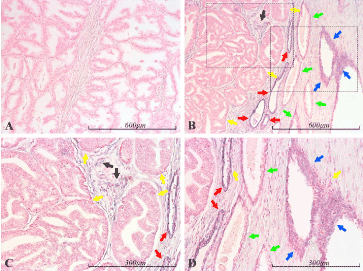
Figure 2. miR-21 expression in the prostate. Micrographs of prostate sections stained for expression of miR-21 by in situ hybridization (blue color). Hyperplastic glands are shown in panel A, while B shows a transition from atrophic glands (right side) to Gleason 4 prostate cancer (left side). Panels C and D depict, with higher magnification, the cancerous and atrophic portion of B, respectively (marked with dashed squares). No miR-21 is detected in the normal glandular epithelium (A), nor in the intervening stroma. The left part of B depicts Gleason 4 prostate cancer (yellow arrows), which is completely miR-21 negative, while the intervening stroma is prominently stained, indicating the presence of miR-21 (black arrows). Higher magnification is shown in panel C. In the right side of B, miR-21 positive glands can be seen. These range from very atrophic and prominently blue (red arrows) to less atrophic and with weaker blue staining (green arrows) to areas of irregular hyperplasia – consistent with prostatic intraepithelial neoplasia (PIN). The latter show prominent staining, indicating the presence of miR-21 (blue arrows). There is also obvious staining of stroma surrounding the atrophic glands and PIN. Part of the area containing atrophic glands and PIN lesions can be viewed with higher magnification in D, where two inflammatory foci are indicated by yellow arrows
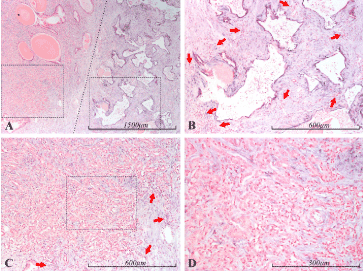
Figure 3. miR-21 expression in the prostate. Micrographs of prostate sections stained for expression of miR-21 by in situ hybridization (blue color). Panel A shows a mostly cancerous area (Gleason 5) to the left and an area containing oddly shaped atrophic glands to the right, demarcated by a dotted line. In panel B, the atrophic glands from A can be seen with higher magnification (right dashed square in A). The thin epithelial layer of these glands is prominently stained, indicating miR-21 expression. The stromal background is rich in inflammatory cells, some of the foci are indicated by red arrows. The stromal cells in this area also show positive staining for miR-21. In panel C, an area from the cancerous part of A can be seen with higher magnification (left dashed square in A), and with even higher magnification in D (dashed square in C). The cancerous epithelium does not show any blue staining, indicating that miR-21 expression is very low or absent in these cells. In contrast, stromal cells are prominently stained, indicating the presence of miR-21. Inflammation can also be seen in relation to the cancer, most prominent towards the edges (some of the foci are indicated by red arrows)
However, the most prominent miR-21 signal intensity was seen in the epithelium of dilated glands with low epithelium, typically near inflammatory reactions, often with some stromal fibrosis in the vicinity (Figures 1-5). The appearance of these glands corresponds to that which has been described as prostatic inflammatory atrophy (PIA). There was also some staining in surrounding stromal cells and occasional cells of lymphocytic appearance, although most of the infiltrating leukocytes showed no staining.
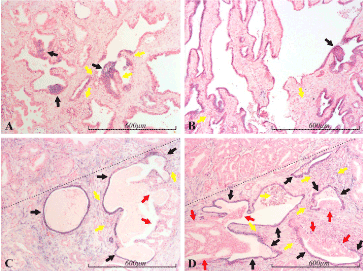
Figure 4. miR-21 expression in the prostate. Micrographs of prostate sections stained for expression of miR-21 by in situ hybridization (blue color). Panel A depicts mostly miR-21 negative, normal looking glands, but some of these contain irregular, hyperplastic lesions (black arrows), consistent with PIN (prostate intraepithelial neoplasia), and these are prominently blue stained (miR-21 positive). Panel B shows mostly atrophic glands, which are miR-21 positive, but there is also a PIN-lesion (black arrow), which is stained with approximately the same intensity as most of the atrophic glands. In panels C and D, a cancerous lesion dominates the area above the dotted line, whereas the area below the dotted line contains atrophic glands (black arrows), which are prominently stained. In one of two atrophic glands in C, and in three of four in D, cribriform structures of atypical cells (red arrows) seem to arise from the atrophic epithelium. These cancerous structures are mostly completely miR-21 negative, although part of the example in C has a thin, luminal layer of miR-21 positive cells. In all the panels, several inflammatory foci are found in close proximity to miR-21 positive epithelium. Some of these are indicated by yellow arrows
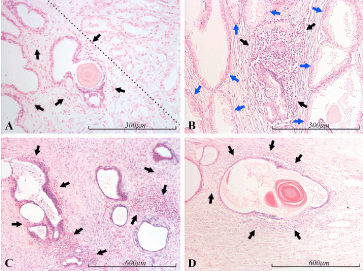
Figure 5. miR-21 expression in the prostate. Micrographs of prostate sections stained for expression of miR-21 by in situ hybridization (blue color), showing miR-21 positive glands in the vicinity of inflammation. Panel A depicts miR-21 positive atrophic glands (lower left side of the dotted line) surrounded by inflammatory cells (black arrows), and Gleason 3 prostate cancer (upper right side of the dotted line). Panel B shows normal prostate glands (blue arrows) on the sides of and above an inflammatory focus (black arrows) with some miR-21 positive, glandular structures. Panel C shows strongly miR-21 positive glands in the vicinity of several inflammatory foci (black arrows). Panel D shows one atrophic miR-21 positive gland, encircled by inflammatory cells
Sometimes one could see groups of crowded, irregular, epithelial cells displaying signs of miR-21 expression, oftentimes such that only a part of a gland was stained. The positively stained cell clusters were identified as corresponding to PIN lesions. However not all PIN areas showed sign of miR-21 expression (Figures 2, 4).
In a few cases we observed structures with morphology corresponding to Gleason 4 prostate cancer in apparent continuity with atrophic miR-21 positive glandular structures. These structures mostly consisted of irregular cribriform sheets of epithelium, which themselves were mostly completely miR-21 negative – in sharp contrast to the highly positive atrophic epithelium, from which they seemed to originate (Figure 4).
miR-145 ISH
Detectable miR-145 was limited to spindle shaped cells in the stromal compartment (Figure 6). Strong nuclear and cytoplasmic signal is seen in cells with the appearance of fibroblasts and smooth muscle cells, including intense staining in the tunica media of small arteries. On the other hand, the epithelium – whether cancerous or normal – never showed any sign of miR-145 expression. In the examples depicted in Figures 6 and 7, four micrographs represent mainly cancerous areas whereas four show non-neoplastic glands. There is no qualitative difference in staining between cancer and non-cancerous tissue. However, cancerous areas tend to contain more epithelium and thus a smaller fraction of stromal cells than a similarly sized area of hyperplasia. This may result in a difference in the total amount of miR-145 positivity (Figure 7).
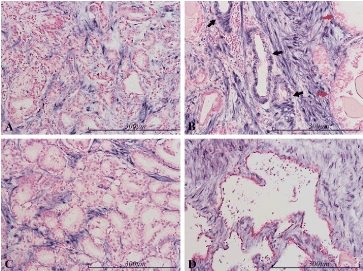
Figure 6. miR-145 expression in the prostate. Micrographs of prostate sections stained for expression of miR-145 (blue color) by in situ hybridization. Positive cells are limited to the stromal compartment, while the epithelium is negative (red nuclear counterstaining). There is no significant color difference between carcinomatous epithelium (Gleason 3/4) in panels A and C, and normal epithelium in B (red arrows) or atrophic glands in D. In the small arteries in B (black arrows) the smooth muscle of the tunica media is stained similarly to stromal cells
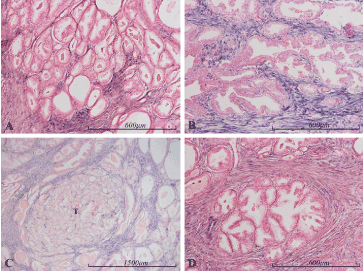
Figure 7. miR-145 expression in the prostate. Micrographs of prostate sections stained for expression of miR-145 (blue color) by in situ hybridization. Positive staining for miR-145 is limited to stromal cells. Carcinomatous epithelium (Gleason 3 in panel A and Gleason 4 in panel B) and normal epithelium (panel B and D) are negative. The well-demarcated tumor nodule in panel C (marked with a T) contains a smaller proportion of stromal cells than the surrounding, non-tumor areas
miR-21 ISH vs BTG2 IHC
Serial sections stained with miR-21 ISH and BTG2 IHC showed some positive correlation in the staining pattern. However, there were several examples of strong miR-21 expression in areas of weak BTG2-signal (Figure 8), and, conversely, no detectable miR-21 expression in epithelia with high BTG2-expression (Figure 9).
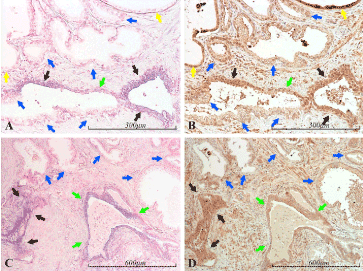
Figure 8. miR-21 vs BTG2 expression in the prostate. Micrographs of prostate sections stained for expression of miR-21 (panels A and C) by in situ hybridization (blue color) and for BTG2 (panels B and D) with immunohistochemistry (brown color). Corresponding areas are marked with arrows of the same color in A and B, and in C and D, respectively. High miR-21 expression correlates well with high BTG2 expression (black arrows). Inversely, low miR-21 expression correlates well with low BTG2 expression (blue arrows), as demonstrated in the heterogenic miR-21 expressing gland in the lower left of A and B. Medium miR-21 expression is accompanied by medium BTG2 expression (green arrows). However, two miR-21 negative and highly BTG2 positive glands are seen in A and B (yellow arrows)
miR-21 ISH vs PDCD4 IHC
Epithelial PDCD4 expression was found to be inversely correlated to that of miR-21 in a consistent manner (Figures 10, 11).
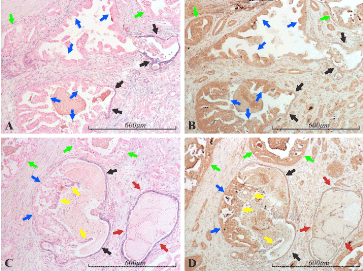
Figure 9. miR-21 vs BTG2 expression in the prostate. Micrographs of prostate sections stained for expression of miR-21 (panels A and C) by in situ hybridization (blue color) and for BTG2 (panels B and D) with immunohistochemistry (brown color). Corresponding areas are marked with arrows of the same color in A and B, and in C and D, respectively. The micrographs show areas of cancer, mainly Gleason 4. The cancerous structures (some of which are indicated by green arrows) are miR-21 negative and for the most part highly BTG2 positive. Atrophic glandular epithelium, which is miR-21 positive, displays low BTG2 expression in this example, in contrast to the cancerous epithelium (red arrows in C and D). Two glandular structures in A and B, and one in C and D show partly atrophic (black arrows) and partly cancerous (blue arrows) morphology, following the same miR-21/BTG2 expressional pattern as the purely cancerous or atrophic glands. The same pattern can be seen in the thin luminal miR-21 positive layer (yellow arrows) in C and D
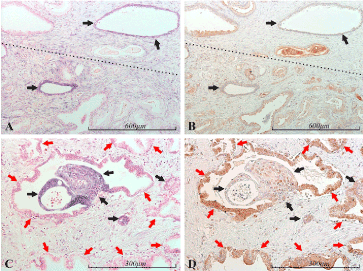
Figure 10. miR-21 vs PDCD4 expression in the prostate. Micrographs of prostate sections stained for expression of miR-21 (panels A and C) by in situ hybridization (blue color) and for PDCD4 (panels B and D) with immunohistochemistry (brown color). Corresponding areas are marked with arrows of the same color in A and B, and in C and D, respectively. Panels A and B show areas of mostly bland/atrophic (upper) and mostly cancerous (lower) glands, roughly separated by the dotted line. In miR-21 positive glands (black arrows) little or no PDCD4 expression is detected. The same pattern is seen in C and D. While normal glandular epithelium (red arrows) is miR-21 negative and highly PDCD4 positive, the miR-21 positive epithelium displays low or no PDCD4 expression
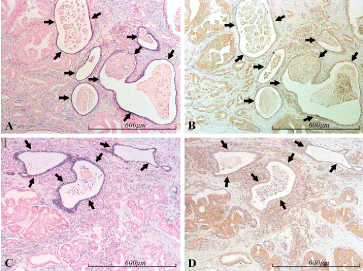
Figure 11. miR-21 vs PDCD4 expression in the prostate. Micrographs of prostate sections stained for expression of miR-21 (panels A and C) by in situ hybridization (blue color) and for PDCD4 (panels B and D) with immunohistochemistry (brown color). Corresponding areas are marked with arrows in A and B, and in C and D, respectively. MiR-21 positive glands display low or no PDCD4 expression (black arrows), in contrast to the surrounding miR-21 negative, cancerous (mostly Gleason 4) structures, which are in general moderately PDCD4 positive
miR-21 ISH vs PTEN IHC
There was a strong positive correlation between miR-21 and PTEN staining intensity in glandular epithelium (Figures 12 and 13). This was true both when the whole gland was miR-21 positive and when only part of the glandular structure was miR-21 positive.
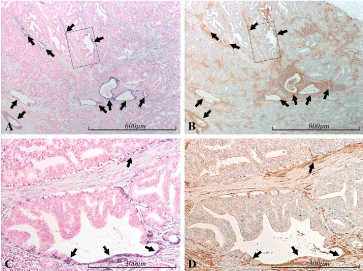
Figure 12. miR-21 vs PTEN expression in the prostate. Micrographs of prostate sections stained for expression of miR-21 (panels A and C) by in situ hybridization (blue color) and for PTEN (panels B and D) with immunohistochemistry (brown color). Corresponding areas are marked with arrows of the same color in A and B, and in C and D, respectively. In A and B, a cancerous (mostly Gleason 4) area can be seen. The miR-21 positive glandular structures, and parts of such, are consistently PTEN positive (black arrows), in contrast to the surrounding, miR-21 negative, cancerous structures. In panels C and D are shown selected areas of A and B (marked by dashed squares) with higher magnification. Areas which are miR-21 positive, consistently show high PTEN expression (black arrows), in contrast to the miR-21 negative cancerous cells
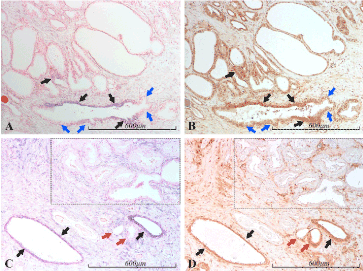
Figure 13. miR-21 vs PTEN expression in the prostate. Micrographs of prostate sections stained for expression of miR-21 (panels A and C) by in situ hybridization (blue color) and for PTEN (panels B and D) with immunohistochemistry (brown color). Corresponding areas are marked with arrows of the same color in A and B, and in C and D, respectively. In A and B, epithelial populations expressing miR-21 are shown to express large amounts of PTEN (black arrows). However, also miR-21 negative, non-malignant cells express PTEN, although with lesser staining intensity (blue arrows). In C and D, the strongly miR-21 positive atrophic glands (black arrows) as well as the weakly positive glands (red arrows) follow the same miR-21/PTEN staining pattern as in A and B. In the upper right part, a cancerous area (Gleason 3), marked by a dashed square, is both miR-21 and PTEN negative
Several authors have reported that miR-145 is suppressed in human cancers in various organs, including the prostate. Thus, Avgeris et al. [9] found the level of miR-
145 to be reduced to approximately 0.5 - 0.7 of that seen in non-cancerous tissue. However, the claims of a downregulation of miR-145 in prostate cancer have been based on findings with quantitative real-time PCR applied to RNA extracts from prostate tissue [9,10]. On the other hand, our findings using ISH indicate that, in the prostate, miR-145 is of strictly stromal origin, its expression being limited to fibroblasts and smooth muscle cells. Thus, we were unable to detect miR-145 in epithelial cells, whether normal, hyperplastic or cancerous. This tissue-specific distribution was seen in all examined sections. However, there is a tendency for tumorous areas to contain less stroma relative to the epithelium when compared to normal or hyperplastic, glandular tissue. This indicates that a seemingly lower expression of miR-145 in cancerous prostate may be due to an altered epithelial/stromal ratio, rather than to the suppression of miR-145 expression in the cancerous epithelium. ISH is arguably less sensitive than PCR, and at best semi-quantitative, so we cannot rule out some reduction of a very small epithelial miR-145 expression, since we may not be able to detect such low levels. However, even if
miR-145 expression is in fact altered in carcinomatous epithelium, our results strongly suggest that the epithelial concentrations are very low compared to the stromal levels, and that any alteration must be very small. This is not to imply that small alterations could not have significant functional implications. Nevertheless, it seems highly unlikely that a PCR-based method should be able to detect such effects in tissue homogenates containing an unknown proportion of fibroblasts and other stromal cells with abundant miR-145 expression. Although this is a new observation in prostate cancer, the same phenomenon has previously been documented in colon cancer. Thus, Kent et al. [11] found miR-145 to be of strict mesenchymal origin, and also that the difference in tissue composition (i.e. the relative amounts of stromal and epithelial elements) in malignant vs non-malignant colonic tissue, may give rise to the misinterpretation that miR-145 is downregulated in colon cancer compared to normal colonic epithelium. However, even if miR-145 is of non-epithelial origin, it may still have tumor suppressing properties. In a recent study, the intravenous injection of miR-145 reduced the growth of metastatic prostate cancer in nude mice [12]. Since cellular miRNA may be exported to the extracellular compartment, it is quite possible that miR-145 of stromal origin may serve to suppress the malignant behavior in carcinomatous cells. Accordingly, it is conceivable that cancer cells become more aggressive whenever the moderator influence of surrounding stroma is reduced.
A dysregulation of miR-21 has been reported in various malignancies, including prostate cancer. However, the possible role of miR-21 in prostate carcinogenesis is still elusive, and in a recent meta-analysis, Song et al. [13] found dysregulation of miR-21 in prostate cancer not to be statistically significant.
Our findings accord well with those of Melbø-Jørgensen et al. [14], who, using a methodology similar to ours, reported that the expression of miR-21 in tumor stroma was higher than in non-neoplastic stroma, and that the level of stromal miR-21 expression in Gleason Score 6 tumors was a significant predictor of biochemical relapse. Indeed, we found miR-21 to be mostly confined to the stromal component of tumorous areas, but we found no clear correlation between staining intensity and Gleason grade. However, this was not a primary focus for our investigation, and our number of patient samples is relatively small.
More interestingly, we found the most intense miR-21 signals in non-malignant epithelium of two specific morphological patterns: (1) in stretches of irregularly thickened epithelium, identified as “prostatic intraepithelial neoplasia” (PIN), and (2) in mostly dilated glands lined with low, often irregular epithelium, usually surrounded by an inflammatory reaction in the stroma, for which the somewhat controversial term “prostatic inflammatory atrophy” (PIA) has been coined. Both PIN
and PIA have been suggested to constitute preneoplastic and precancerous lesions of the prostate, but not without eliciting rebuttals. Although a causal link between PIA and prostate cancer is controversial, we found structures of highly malignant morphology seemingly arising from miR-21 positive atrophic epithelium, interpreted
as PIA. This finding suggests that a possible linkage between PIA and prostatic carcinogenesis may warrant further consideration.
A striking finding was that the strong epithelial miR-21 signal mainly occurred near foci of chronic inflammation, and it was accompanied by positivity also in the stromal cells. A link between miR-21 and inflammation of the prostate is not an entirely new observation, but its cellular origin has not previously been documented. In a recent study, miR-21 was found to be significantly elevated in expressed prostatic secretions (EPS) during chronic prostatitis/chronic pelvic pain syndrome, and the levels decreased with symptom relief [15]. Taken together, these findings point to a possible link between inflammation on one hand and PIA and PIN on the other, with miR-21 being part of a coupling mechanism. If one accepts PIN as a cancer precursor, this would constitute an argument in favor of the idea that sustained cell injury and the ensuing chronic inflammation may provide a background on which carcinogenic agents can exert their action.
Our discovery of strong miR-21 expression in putative PIN- and PIA-lesions – and previous documentation of elevated miR-21 in EPS during inflammation, makes it seem highly unlikely that miR-21 has a potential as a useful biomarker for prostate cancer. Elevated miR-21 might rather indicate an inflammatory process. On the other hand, our results may provide an explanation for the lack of consistency among previous reports on the connection between miR-21 and prostate cancer. The inadvertent inclusion of some abundantly expressing inflammatory foci may heavily modify the total amount of miR-21 in a tissue sample, thus introducing an important source of variation.
In an attempt to identify a molecular link between miR-21 and neoplastic transformation, we found that cells with a strong miR-21 signal also tended to be positive for PTEN. This result seems to be at odds with an experimental study performed by Yang, Guo and Shao [16], who reported that miR-21 transfection of prostate cancer cells suppressed the expression of PTEN, followed by increased proliferation and increased cellular invasion in an in vitro model. However, it is quite possible that in the complex situation of an intact organism, miR-21 does not play the role of a total silencer of PTEN expression, but rather acts as a complement to pretranscriptional regulatory mechanisms, in order to fine-tune the PTEN level, in a situation of highly stimulated expression of the protein. It is conceivable that inflammation triggers a reaction comprising increased PTEN expression, subsequently inhibiting cell proliferation and leading to atrophy. The role of miR-21 may then be to exert an extra, posttranscriptional, control of this reaction.
PDCD4 is a tumor suppressor that targets translation, being itself suppressed in various kinds of cancers [17]. We consistently found lower levels of PDCD4 in miR-21 positive cells, suggesting a downregulation by miR-21. This was the case in glands where all cells express miR-21 as well as in heterogeneous glands, where only part of the cells contain a high concentration of miR-21. The phenomenon that miR-21 downregulates PDCD4 has been documented in many previous studies [18,19]. In their 2015 study, Dong et al. [20] found miR-21 to promote growth of prostate cancer cells by downregulating PDCD4 through several mechanisms. The detection of low PDCD4 expression in miR-21 positive, atrophic glands suggests that PDCD4 inhibition may be part of a compensatory mechanism, aimed at counteracting the atrophic tendency by removal of a proliferation inhibitory signal.
BTG2 is a tumor suppressor gene with a wide array of functions. It has been demonstrated to control several checkpoints in cell division and to function as an inductor of apoptosis. Furthermore, its expression has been found suppressed in many human cancers [21]. In laryngeal carcinoma, miR-21 may directly regulate BTG2 via several mechanisms [22]. In the prostate, BTG2 has been found downregulated in prostate cancer, but inversely correlated to miR-21 only in a subset of cases, suggesting that other mechanisms are the main regulators [4]. Our results regarding the relationship between miR-21 and BTG2 are compliant with previous findings in the prostate – in the sense that the correlation in this organ may be less straightforward than what has been reported in other organs. We found examples of both strong positive and negative correlation between miR-21 and BTG2 expression. The strong correlation suggests that there is indeed a relationship between miR-21 and BTG2 in the prostate, but that the interaction between these factors may be more complex than a mere downregulation of BTG2 subsequent to increased miR-21 expression. It is quite possible that the staining patterns we observe are simply snapshots of a highly dynamic, evolving process, with constantly changing levels of stimulatory and inhibitory signals.
Our findings do not support neither miR-145 nor miR-21 as biomarkers for prostate cancer. However, miR-21 provides a possible new link between the putative precancerous lesions, PIN and PIA, and prostate cancer. The malignant transformation may in part be mediated by suppressed PDCD4 expression. Further investigation is needed to elucidate this relationship and the possible role of miR-21 in prostate carcinogenesis. Moreover, the present paper demonstrates that any changes of miRNA levels in tissue samples as detected by PCR must be corroborated by a method which permits the identification of the cell types producing the relevant miRNA. In this context, in situ hybridization is a useful alternative.
Erik Nesje Wiik and Jostein Halgunset
The authors thank Toril Rolfseng and Kristin Tvete for their valuable technical assistance.
No external funding has been received for the current project, which has been fully financed by our institutions: Norwegian University of Science and Technology and St Olav’s Hospital.
The authors declare that they have no competing interest.
- Fabris L, Ceder Y, Chinnaiyan AM, Jenster GW, Sorensen KD, et al. (2016) The Potential of MicroRNAs as Prostate Cancer Biomarkers. Eur Urol 70: 312-322.
- Danarto R, Astuti I, Umbas R, Haryana SM (2019) Urine miR-21-5p and miR-200c-3p as potential non-invasive biomarkers in patients with prostate cancer. Turk J Urol 46: 26-30.
- Zhang X, Wu J (2015) Prognostic role of microRNA-145 in prostate cancer: A systems review and meta-analysis. Prostate Int 3: 71-74.
- Coppola V, Musumeci M, Patrizii M, Cannistraci A, Addario A, et al. (2013) BTG2 loss and miR-
- 21 upregulation contribute to prostate cell transformation by inducing luminal markers expression and epithelial-mesenchymal transition. Oncogene32: 1843-1853.
- Hao B, Zhang J (2019) miRNA-21 inhibition suppresses the human epithelial ovarian cancer by targeting PTEN signal pathway. Saudi J Biol Sci 26: 2026-2029.
- Liu C, Tong Z, Tan J, Xin Z, Wang Z, et al. (2019) MicroRNA-21-5p targeting PDCD4 suppresses apoptosis via regulating the PI3K/AKT/FOXO1 signaling pathway in tongue squamous cell carcinoma. Exp Ther Med 18: 3543-3551.
- Chaux A, Peskoe SB, Gonzalez-Roibon N, Schultz L, Albadine R, et al. (2012) Loss of PTEN expression is associated with increased risk of recurrence after prostatectomy for clinically localized prostate cancer. Modern Pathol 25: 1543-1549.
- Zennami K, Choi SM, Liao R, Li Y, Dinalankara W, et al. (2019) PDCD4 Is an Androgen-Repressed Tumor Suppressor that Regulates Prostate Cancer Growth and Castration Resistance. Mol Cancer Res 17: 618-627.
- Avgeris M, Stravodimos K, Fragoulis EG, Scorilas A (2013) The loss of the tumour-suppressor miR-145 results in the shorter disease-free survival of prostate cancer patients. Brit J Cancer 108: 2573-2581.
- Zaman MS, Chen Y, Deng G, Shahryari V, Suh SO, et al. (2010) The functional significance of microRNA-145 in prostate cancer. Brit J Cancer 103: 256-264.
- Kent OA, McCall MN, Cornish TC, Halushka MK (2014) Lessons from miR-143/145: the importance of cell-type localization of miRNAs. Nucleic Acids Res 42: 7528-7538.
- Iscaife A, Reis ST, Morais DR, Viana NI, da Silva IA, et al. (2018) Treating metastatic prostate cancer with microRNA-145. Apoptosis 23: 388-395.
- Song CJ, Chen H, Chen LZ, Ru GM, Guo JJ, et al. (2018) The potential of microRNAs as human prostate cancer biomarkers: A meta-analysis of related studies. J Cell Biochem 119: 2763-2786.
- Melbo-Jorgensen C, Ness N, Andersen S, Valkov A, Donnem T, et al. (2014) Stromal expression of MiR-21 predicts biochemical failure in prostate cancer patients with Gleason score 6. PLoS One 9: e113039.
- Chen Y, Chen S, Zhang J, Wang Y, Jia Z, et al. (2018) Expression profile of microRNAs in expressed prostatic secretion of healthy men and patients with IIIA chronic prostatitis/chronic pelvic pain syndrome. Oncotarget 9: 12186-12200.
- Yang Y, Guo JX, Shao ZQ (2017) miR-21 targets and inhibits tumor suppressor gene PTEN to promote prostate cancer cell proliferation and invasion: An experimental study. Asian Psac J Trop Med 10: 87-91.
- Li JZ, Gao W, Ho WK, Lei WB, Wei WI, et al. (2016) The clinical association of programmed cell death protein 4 (PDCD4) with solid tumors and its prognostic significance: a meta-analysis. Chin J Cancer 35: 95.
- Peacock O, Lee AC, Cameron F, Tarbox R, Vafadar-Isfahani N, et al. (2014) Inflammation and MiR-21 pathways functionally interact to downregulate PDCD4 in colorectal cancer. PLoS One 9: e110267.
- Yuan H, Xin S, Huang Y, Bao Y, Jiang H, et al. (2017) Downregulation of PDCD4 by miR-21 suppresses tumor transformation and proliferation in a nude mouse renal cancer model. Oncol Lett 14: 3371-3378.
- Dong B, Shi Z, Wang J, Wu J, Yang Z, et al. (2015) IL-6 Inhibits the Targeted Modulation of PDCD4 by miR-21 in Prostate Cancer. PLoS One 10: e0134366.
- Mao B, Zhang Z, Wang G (2015) BTG2: a rising star of tumor suppressors (review). Int J Oncol 46: 459-464.
- Liu M, Wu H, Liu T, Li Y, Wang F, et al. (2009) Regulation of the cell cycle gene, BTG2, by miR-21 in human laryngeal carcinoma. Cell Res 19: 828-837.