Objective: Radiotherapy Treatment Planning (RTP) is a procedure to plan the irradiation treatment which is usually simulated on a conventional simulator before applying it on the patient. The main goal is to deliver the adequate irradiation dose to a tumour without causing severe damage to surrounding normal and health tissues.
Material and methods: The major weaknesses of current RTP systems come from their rendering methods since most of them use surface rendering rather than volume rendering. All target objects and other critical organs are required to be modelled with interactive contouring slice by slice. The sizes of the segmentation objects are not accurate and some of small but critical organs sometimes maybe neglected.
Results: Image segmentation is currently used into several medical imaging applications that involve diagnosis or treatment. Segmentation of volumes is an essential tool for the radiation therapy treatment of the cancer. One of the key organs that must be protected during the irradiation treatment is the brain. Nowadays, high resolution computed tomography (CT) data are required to perform accurate 3D treatment planning, and therefore there is the demand for quick but at the same time accurate segmentation tools. Inappropriate contours results have been performed for the cases where uncertain conditions are appeared (like position of the body in the table and metal material of the bed).
Conclusions: In this work we presented an algorithm that can be used for the accurate semi-automatic segmentation of the brain in three dimensions (3D) from CT images. Our method, which is currently in clinical use, is basically composed from an edge detection algorithm and statistical extreme values techniques (outliers).
radiotherapy treatment planning, segmentation, brain segmentation, boundary tracking, outlier analysis
A major field of application for volume visualization in medicine is the diagnostic radiology. One of the reasons is that radiologists are skilled in reading cross-sectional images. Another reason is that many diagnostic tasks such as tumour detection and classification can be done based on cross sectional images [1-4]. Furthermore, 3D visualization of these objects from CT requires robust segmentation algorithms, which are not yet available. A number of different applications, like craniofacial surgery, neurosurgical planning and radiotherapy planning could be note the importance of different segmentation techniques [5-12].
Especially for the radiotherapy planning, the object is to focus on the radiation as closely as possible to the target volume, while avoiding side effects in healthy tissues. 3D visualization of target volume, organs at risk and simulated radiation dose allows an interactive optimization of treatment planning [13-15].
Many segmentation methods for 3D medical images are developed, which may be roughly divided into three classes: thresholding, edge- and region- based methods. Principally the brain region is embedded in the regions where the grey level values are different compared with the surrounding area and in the regions with similar grey level values [5,6,7,20]. For the first case due to the lower contrast than the surrounding bones can be easily detected using thresholding-based methods [3,4,9]. For the second case, unsatisfactory segmentation results were found for different data sets in cases where gaps and bridges were introduced. The basis of our approach is the edge detection algorithm, one of the most common methods used in image segmentation [21-22]. In our case the process must be initiated and therefore the user must give the starting point for the algorithm manually. The greatest benefit of this method is its algorithmic simplicity. Therefore, we have to introduce a measure to compare the accuracy of the segmentation results, which allow us to sample the segmented region using statistical methods based on the outlier theory. False alarms contours may be introduced like extreme values. The acceptance or rejection of these contour values could be introduced based on a specific confidence region values.
Brain segmentation in computed tomography is the delineation of neuroanatomical structures; outlines of brain structures can be drawn on images to indicate the extents of those structures. In general, is a very difficult and time-consuming process [17,18].
General segmentation of the human brain involves defining anatomical structures by primary borders, corresponding to grey or white maters or by secondary borders, which are knowledge based anatomic sub-division within a grey or white matter. In this work an improved boundary tracking technique would be proposed for segmenting the organ [12,14,19,22]. There are two main cases: (i) the ordinal case where the brain grey pixels values are different of the table or the mask (in case of the radiotherapy) and (ii) the case where the head grey pixels values are similar with the other objects close to the brain pixel values [8,16]. In the last case the results, for some slices, are unsatisfactory giving false alarms segmentation results. To solve this problem, an improved segmentation method is proposed based on the outlier’s theory.
- For the simple case the only problem is when the algorithm extends the region of interest (Figure 1). In this situation a stopping criterion (red line) must be specified to control the segmentation process. Extending experiments suggests that a threshold of 5 cm², for the small area region until the spinal canal would be appropriate. After that measure the algorithm would be stopped. Similarly, the algorithm uses a constant threshold selection with levels 80 to 88 Hounsfield values for the brain area justification.
- For the second case, where different objects closed to the brain bones have similar grey values, an improved segmentation method would be proposed based on the outlier theory.
- The algorithmic steps for the procedure are:
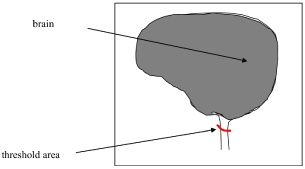
Figure 1. Thresholding method for brain segmentation
- Calculate the periphery measure for all the contours.
- Find the maximum value of the periphery measure from all the slices.
- Calculate the new measure
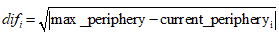 , where i is the contour number (Figure 2). The outliers that probably needed to be removed are presented into the graph.
- Calculate the average and the standard deviation of the measures difi.
- Calculate the confidence intervals
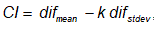 , where k is the acceptance rate. The choose of the k value is very important and many times difficult. It could be done by trial and error or by iteratively procedure, starting with a proposed value (for example 95%) and decreasing or increasing depending on the direction. In this work we use an iteratively approach; an approximate 49% of acceptance was found for this example (Figure 3).
- If a measure value is less than the CI value,
 , then this contour would be removed. Similar assumptions take place for the opposite direction.
- A linear interpolation takes place between the remained contours.
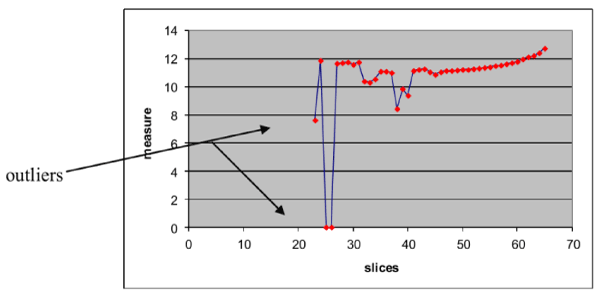
Figure 2. Graph of the proposed measure for every slice
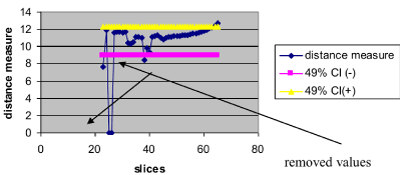
Figure 3. Illustration of the CI for a particular percentage. Values outside both CI lines would be removed
A CT tomographic sequence of 8 bit grey scale images of a size 512 × 512 in which change the shape, and the orientation of the objects was used. Figure 4 illustrates the 2D visual results from the false alarm segmentation method for different slices and figure 5 presents the results after applying the proposed method. Finally figure 6 presents the 3D visualisation of the segmentation method.
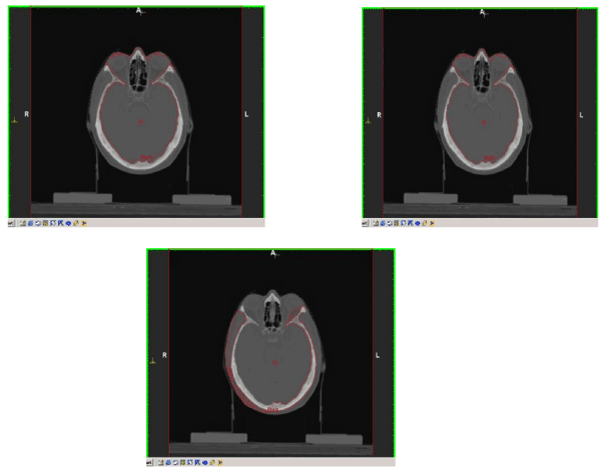
Figure 4. False brain segmentations for different slices. From left to right: 34, 35, 36
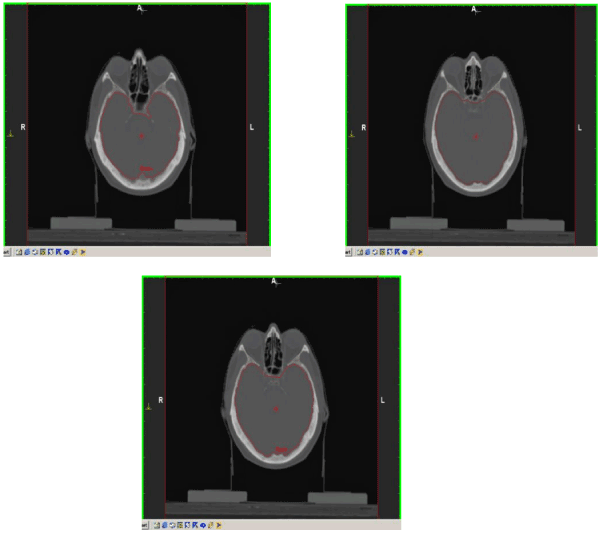
Figure 5. Improved brain segmentation results using the proposed method. From left to right: 34, 35, 36.
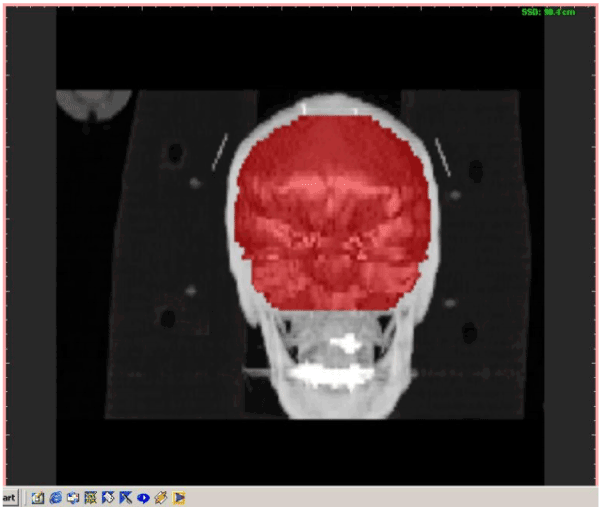
Figure 6. Visual results for 3D brain segmentation
Table problem
One of the main problems for the brain segmentation is the cases where the body touch the clinical table. The user manually can check different positions of the patient table; in some cases the body is not exactly at the centre of the table or the grey level values of the brain are close to those of the table (probably caused from the materials that the table has been made). In this situation the procedure segments both the body and the table giving false alarm results. To solve this problem, two methods have been proposed: (i) thresholding technique and (ii) linear point interpolation.
Thresholding
This method is a simple thresholding technique where the find threshold is the standard value of the table. If a contour point value is below the table value threshold is removed; otherwise it is remains (Figure 7).
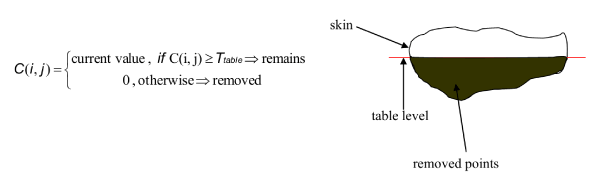
Figure 7. Thresholding technique. Where C(i,j) contour value and Ttable is the table value threshold
Linear point interpolation
The threshold methods work quite satisfactory for most of the cases. The only drawback in this method is that, in some cases the process over removed points giving as a result an approximate straight line. That result could be false alarm for the doctors in cases the whole body want to be presented.
To overcome this problem an alternatively method is proposed based on the linear point interpolation (Figure 8).
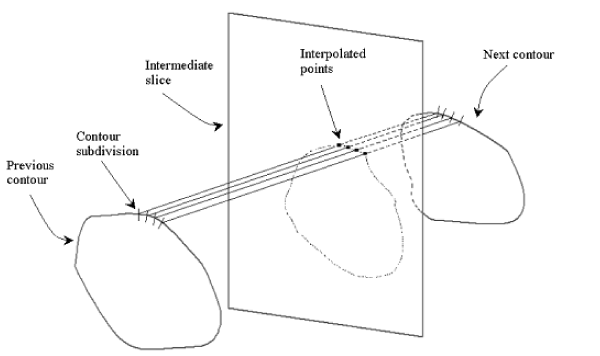
Figure 8. Intermediate slice interpolation.
- At the first stage the contours points are check in pairs (xprevious, xcurrent) to find which points are cross-checked with the defined table level. To find these points a linear point interpolation method would be applied where a slope factor A is calculated between the key slices. The value of this is given from the following equation:
Then a starting point is selected -- usually this is the point of the 12o’clock position of the contour. To calculate the X and Y pixel (or voxel) position of the interpolated point we use the following
- The algorithm investigates the positions of the points with respect of the table level value. If the table level value is between the two points (xprevious, xcurrent) then the xcurrent is erased and the value is replaced by the table level value. Graphically the process could be illustrated in figure 9. Finally, the remains points after the recalculation of the slices could be modified using discrete contouring. In discrete contouring the user selects manually (using the mouse) the area he wants to define. When the currently drawn contour is closed the temporary point, list is inserted into the contour list of the current contour object (Figure 10).
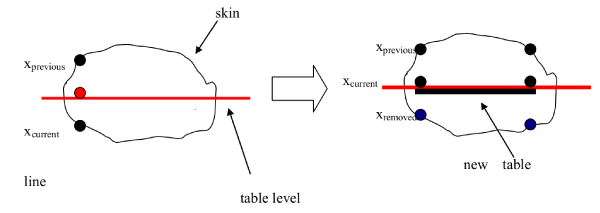
Figure 9. Presentation of the linear point interpolation
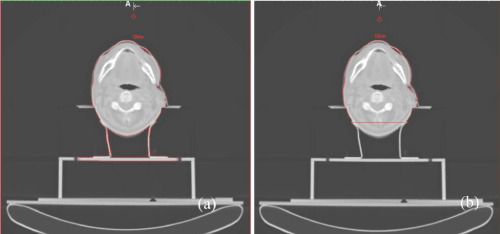
Figure 10. From left to right: False alarm segmentation; improved segmentation using the removed point process for the table. A) illustrates the 2D visual results from the false alarm segmentation results and B) the improvement using the above technique
Our method has been implemented into a virtual simulation system, which is used for the simulation of the external beam radiation therapy process. The system uses high resolution CT data with an average of 50 equally spaced slices. We apply our method to 20 CT data. The slice spacing varied between 3 and 5 mm.
The accuracy of detecting the brain region was found to be quite satisfactory (approx. 80-85%). The parameters used for the comparison were the total volume and the area of the contours at each level. The time required for the algorithm to segment even data sets with more than 50 slices was at sub-second, for a Pentium III at 800 MHz.
A novel approach for the segmentation of the brain is introduced in this work. The current method combines an edge detection algorithm, outlier techniques and an interpolation methodology. Our solution is integrated into a virtual simulation system and has been clinically validated and from our trials it is proven that the brain can be segmented with high accuracy in real time. However, there is still room for improvements especially on the propagation of the detection path as well as on the automatic detection of the starting point in order to eliminate the user’s manually intervention.
- Nagel RN, Rosenfield A (1972) Ordered search techniques in template matching. Proceeding IEEE 60: 242-244.
- Zimeras S, Karangelis G (2001) Semi-automatic Segmentation Techniques for CT Medical Data. 3rd caesarium Computer Aided Medicine November 12-13, Bonn, Germany.
- Karangelis G, Zimeras S (2002) An Accurate 3D Segmentation Method of the Spinal Canal Applied on CT Images. BVM 2002, Confedrence Proceedings, Springer-Verlag, Berlin, 366-369, Germany.
- Zimeras S, Karangelis G, Firle E (2002) Object segmentation and shape reconstruction using computer-assisted segmentation tools, Medical Imaging, San-Diego, USA.
- Haralick RM, Shapiro LG (1985) Image segmentation techniques. Comput Vis Graph Im Proc 29: 100-132.
- Gonzales RC, Woods RE (1992) Digital Image Processing. Addison-Wisley, Prentice Hall, Upper Saddle River, USA.
- Pal NR, Pal SK (1993) A review on image segmentation techniques. Patt Rec 26: 1277-1294.
- Haralick RM, Shapiro LG (1992) Computer and Robot Vision. Addison Wesley, New-York.
- Cagnoni S, Dobrzeniecki AB, Poli R, Yanch JC (1997) Segmentation of 3D medical images through genetically optimised contour tracking algorithms. Technical report CSRP-97-28, Whitaker College of Health Sciences and Technology, MIT.
- Zimeras S (2002) Real time segmentation tools for 3D CT medical data, Presentation. Extraordinary Annual General Meeting of the MCFA, Göttingen, Germany.
- Zimeras S (2012) An efficient 3D segmentation method for spinal canal applied to CT volume sequence data. Int J Reliable Quality e-Healthcare 1: 33-42.
- Zimeras S (2017) Surface Segmentation. The case of bronchus anatomical structure. Design, Development, and Integration of Reliable Electronic Healthcare Platforms. IGI Global: 150-159.
- Zimeras S, Gortzis L, Pylarinou CH (2013) Shape Analysis in Radiotherapy and Tumor Surgical Planning Using Segmentation Techniques. System-Level Design Methodologies for Telecommunication: 159-173.
- Zimeras S (2012) Segmentation Techniques of Anatomical Structures with Applications in Radiotherapy Treatment Planning, Radiation Therapy. InTech Publication: 41-58.
- Zimeras S, Gortzis LG (2012) Interactive telecardiological segmentation systems for treatment and diagnosis. Int J Telemed Appli: 713739.
- Boissonat J (1988). Shape Reconstruction from Planar Cross Sections. Computer Vision, Graphics and Image Processing 44:1-29.
- Raut S, Raghuvanshi M, Dharaskar R, Raut A (2009) Image Segmentation – A State- Of-Art Survey for Prediction. Proceedings of International Conference on Advanced Computer Control: 420-424.
- Dhanachandra N, Chanu YJ (2017) A Survey on Image Segmentation Methods using Clustering Techniques. Eur J Eng Res Sci 2: 15-20.
- Fischl B, Salat DH, Busa E, Albert M, Dieterich M, et al. (2002) Whole brain segmentation: automated labeling of neuroanatomical structures in the human brain. Neuron 33: 341-55. [Crossref]
- Roy S, Nag S, Maitra KK, Bandyopadhyay SK (2013) A Review on Automated Brain Tumor Detection and Segmentation from MRI of Brain. Int J Adv Res Comp Sci Software Engi 3: 6.
- Padole VB, Chaudhari DS (2011) A Review of Segmentation Methods for Detection of Brain Tumor in MRI. Int J Elec Commu Soft Coumpting Sci Engi 1: 1.
- Anandgaonkar G, Patil P, Sable GS (2013) An overview: Image segmentation Techniques for Brain Images. Int J Elec Commu Tech Elec Engi: 3.