Introduction: Data has shown that some progress in supplying quality blood to African populations has been accomplished in most countries in the region between 2006 and 2010. However, since 2010, no analysis has been conducted to assess the progress. Furthermore, the current difference in blood safety indicators between the main sub-regions, namely East and Southern, West and Central Africa, also remains unknown.
Methods: We conducted a cross-sectional survey on blood safety indicators for the year 2013 and compared the results between the three sub-regions. Data were collected using the questionnaire on the Global Database on Blood Safety, and analysis was done using Excel 2010.
Results: The average proportion of voluntary non-remunerated blood donations was 67%, ranging from 2.3% in South Sudan to 100% in 11 other countries. This was lower in Central Africa (34.4%). The median percentages of reactive blood units to transfusion transmitted infections were found to be as follows: 1.3% for HIV (ranging from 0% to 6.7%); 4.2% for hepatitis B virus (ranging from 0% to 17.4%); 1.0% for hepatitis C virus (ranging from 0% to 4.9%); and 0.8% for syphilis (ranging from 0% to 8.3%). Our results indicated that, the donation rate was lowest in West Africa (3.9/1000 inhabitants) compared to Central Africa (5.6/1000 inhabitants), and East & Southern Africa (5.1/1000 inhabitants)., The proportion of HIV reactive blood units was lowest in East & South African region (0.7%), which also had the highest proportion of whole blood units separated into components (75.6%).
Conclusion: Despite the progress made in the last few years, significant challenges remain and call for concrete action required to reach Universal Health Coverage and Sustainable Development Goals targets for blood safety and availability.
blood donor, donated blood, Africa, survey, transfusion
Abbreviations
AfSBT: African Society of Blood Transfusion, BTS: Blood Transfusion Services, CUB: Clinical use of blood, EQAS: External Quality Assessment Scheme, GDBS: Global Database for Blood Safety, HBV: Hepatitis B Virus, IVIG: Intravenous Immunoglobulin, NBTS: National Blood Transfusion Service, PDMP: Plasma-derived medicinal products, RCC: Red Cell Concentrate, SDG: Sustainable Development Goals, TTIs: Transfusion Transmitted Infections, UHC: Universal Health Coverage, VNRBD: Voluntary non-remunerated Blood Donors, WHA: World Health Assembly, WHO: World Health Organisation.
The mortality rates in the WHO African Region are the highest in the world, with average regional estimates of an under-five years old mortality rate of 81.3 per 1000 live births, and a neonatal mortality rate of 28 per 1000 live births [1,2]. On average, there are 2.6 new infections per 1000 population among adults aged between 15 and 49 years old. Malaria incidence is 210 cases per 1000 inhabitants. In terms of road traffic mortality, the incidence is 20 per 100000 inhabitants. Lastly, 42% of the population in the WHO African Region suffer from anaemia [1,2].
Majority of these patients require transfusion, but there is no timely access to safe blood or blood components. As a result, there are big differences regarding access to safe blood between developing and industrialized countries. Several WHO resolutions and strategies have been adopted to improve the safety of blood and blood products through promotion of the development of coordinated national blood transfusion services based on Voluntary Non-Remunerated Blood Donations (VNRBD). Additional strategies include implementation of effective legislation and national regulatory systems, establishment of sustainable blood safety programs, the administration and maintenance of quality control systems, and the strengthening of human resource capacity through the provision of initial and continuing training of staff [3-5]. Regarding the availability, safety, and quality of blood products in the WHO African Region, data showed that some progress had been made in most of the countries between 2006 and 2010. The two main areas that have registered some improvements include the reduction in transfusion transmitted infection (TTIs) seroprevalence in general, and an increase in the number of VNRBD [5-7]. These data helped to identify successes, gaps and constraining factors as well as priority actions to be undertaken in the coming years. Since 2010, several countries have launched new blood safety programs with technical and financial support from international funding agencies while others have faced the same challenges with limited resources. However, no situational analysis had, so far, been conducted to provide a status update on blood safety indicators in the main WHO AFRO sub-regions.
Our study aimed to assess the level of implementation of the resolutions made in the Regional Committee for Africa, and the World Health Assembly, by comparing data between the WHO AFRO sub-regions.
Study design and subjects
We conducted a cross-sectional survey on WHO blood safety indicators from the period covering October 2015 to February 2016 for the calendar year 2013 and compared the results in the three WHO AFRO sub-regions (Figure 1). All 47 countries of the WHO African Region were invited to complete the WHO global data on blood safety (GDBS) questionnaire online [8]. Forty-six out of 47 countries accepted to respond to the survey. Despite assiduous follow-up one country did not provide information. This could be due to limited capacity of the blood transfusion services in the country.
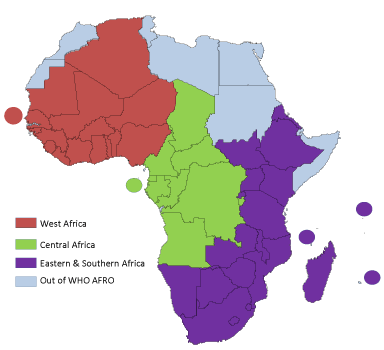
Figure 1. The 3 sub regions of the WHO African Region.
Data collection
The WHO GDBS questionnaire was developed by WHO and emailed to head of National Blood Transfusion Service (NBTS) or health care staff responsible for data collection within the NTBS or at the Ministry of Public Health through the WHO country offices. The survey was self-administered and structured to obtain the blood safety indicators related to achievement of targets set out by the regional strategy for blood safety. The WHO GDBS covers the following seven sections: Blood donors and blood collection; Screening for TTIs; Blood component preparation; Clinical use of blood and blood components; Administrative information; Organization and management and; Plasma-derived medicinal products (PDMP).
All submitted questionnaires were checked at country level and within Blood Safety Programmes at WHO Regional Office and WHO headquarters for completeness and accuracy prior to analysis. Finally, all checked data were endorsed by the countries.
Data analysis
Data were validated by each country through a final check table for accuracy and consistency. This allowed for the provision of any requisite clarification. Data rendered unavailable, invalid, or for other reasons unusable were excluded from the analysis. The data were analysed according to the following WHO AFRO sub regions: Central Africa (CA), East & Southern Africa (ESA), and West Africa (WA). For each country and/or sub region, variables reported or calculated were a number, rate, and percentage. The total population of the WHO African Region used for estimates was that defined by UNDP in 2013 [9]. Means and ranges of key blood safety indicators were calculated for each set of data where applicable and distributed according to the sub-regions. Data entry and analysis were performed using the Microsoft Excel and Microsoft Word 2010 applications from the Microsoft Office suite.
Ethical considerations
The study was waived from ethical approval by participating countries as no donor, patient, or investigator information was collected. Nevertheless, each participating blood service reviewed the protocols, the questionnaire itself, and subsequently provided written consent for sharing anonymised data.
With regards to administrative information, out of the 47 countries of the WHO African Region, 46 (97.9%) provided data in the questionnaire. Only one country did not provide any data and was excluded from the analysis. Based on countries estimates in the report, data of this survey are provided for the 926,613,705 inhabitants, representing 99.9% of the total population of the WHO African Region (927, 370,720 inhabitants).
Concerning organisation and management, out of the 46 countries that provided data, 41 countries (89.1%) had a nationally coordinated blood transfusion services (BTS). Thirty-eight (82.6%) countries had formulated and adopted national blood transfusion policies, and 33 countries (71.7%), had developed a strategic plan for the implementation of their blood transfusion policies including clinical use of blood and blood component. Only 13 countries had national guidelines on hemovigilance. Furthermore, transfusion legislation was prepared in 19 countries (41.3%). Regarding the quality management in BTS, 44 countries (95.6%) had established national standards for the collection, testing, processing, storage and distribution of blood and blood products. Data also revealed that 28 countries (60.8%) participated in a national external quality assessment scheme (EQAS) for TTIs laboratory screening, and 22 countries (47.8%) for blood group serology and compatibility testing. Concerning the funding for NBTS, 36 countries (78.3%) had a national government budget and had received funding and technical supports from international agencies and/or institutions, while 19 countries (41.3%) had a system of cost recovery (Table 1). WHO and CDC/PEPFAR provided support for 19 countries in the region (Table 2).
Table 1. Organization and management of the Blood services in the 46 countries of WHO Afro Region in 2013
|
Central Africa |
East &Southern Africa |
West Africa |
Total Region |
Countries (n) |
9 |
20 |
17 |
46 |
Having Blood policies (n) |
8 |
16 |
14 |
38 |
Having a Strategic plan (n) |
6 |
4 |
13 |
23 |
Having a Legislation (n) |
3 |
8 |
8 |
19 |
Having national standards (n) |
8 |
19 |
17 |
44 |
Performing EQAS TTIs (n) |
3 |
18 |
7 |
28 |
Performing EQAS Blood grouping (n) |
3 |
12 |
7 |
22 |
Accredited NBTS (n) |
1 |
3 |
0 |
4 |
Having national guidelines on CUB (n) |
3 |
18 |
13 |
34 |
Having national guidelines on Hemovigilance system (n) |
1 |
4 |
8 |
13 |
Number of Stand-alone Blood centre (n) |
24 |
97 |
71 |
192 |
Number of Hospital based blood centre (n) |
1.106 |
215 |
532 |
1.853 |
Mean proportion of funding from Government (%) |
49 |
7 |
49 |
12.0 |
Mean proportion of funding Cost recovery (%) |
13.4 |
83.8 |
9.0 |
75.0 |
Mean proportion of funding External funding (%) |
19.3 |
7.0 |
42.0 |
10.2 |
EQAS: External Quality Assessment Scheme
CUB: Clinical Use of Blood
Table 2. Agencies providing funding and/or technical assistance to Blood services in the 46 countries of WHO Afro Region in 2013
Agency/institution |
Countries supported(n) |
WHO |
19 |
CDC/PEPFAR |
19 |
Global Fund |
9 |
American Association of Blood Banks |
7 |
Safe Blood for Africa Foundation |
4 |
UNFPA |
3 |
Etablissement Français du Sang |
3 |
Swiss Red Cross |
2 |
European Union |
2 |
World Bank |
1 |
UNICEF |
1 |
UNDP |
1 |
Nordic Development Fund |
1 |
Lux Development |
1 |
Belgian Technical Cooperation |
1 |
African Society for Blood Transfusion |
1 |
Management Science for Health (MSH) |
1 |
NHS Blood and Transplant |
1 |
Regarding blood collection, a total of 4,402,680 units of blood were collected in the 46 countries in 2013, ranging from 919 to 947,890 units. Of the 4,402,680 donations in the 46 countries, 30,651 (0.7%) were collected by aphaeresis (Table 3).
Table 3. Characteristics of donations and transfusion transmitted infections in Blood services of the 46 countries of WHO Afro Region in 2013
Characteristics |
Central Africa |
East &Southern Africa |
West Africa |
Total Region |
Country (n) |
9 |
20 |
|
17 |
|
46 |
|
|
Country inhabitants* (n)
|
145,155,857 |
410,998,468 |
|
370,459,380 |
|
926,613,705 |
|
|
Donations |
Total blood donation reported (n (range) |
811.060 |
|
2,126,407 |
|
1,465,213 |
|
4,402,680 |
(919 -947, 890) |
Donation rate (units/1,000 inhabitants) |
5.6 |
|
5.1 |
|
3.9 |
|
4.7 |
|
Number (%) of VNRBD |
279.156 |
(34.4) |
1964685 |
(92.4) |
709.142 |
(48.4) |
2,952,983 |
(67.0) |
Number (%) of FRD |
503.889 |
(62.1) |
161.142 |
(7.6) |
755.443 |
(51.6) |
1,420,474 |
(32.2) |
Number (%) of PD |
27.254 |
(3.4) |
NA |
NA |
46 |
(0.0) |
27.3 |
(0.6) |
Number (%) of other type of donor |
761 |
(0.1) |
580 |
(0.02) |
582 |
(0.03) |
1.923 |
(0.04) |
Transfusion Transmitted infections |
Proportion (%) of units tested
HIV reactive (mean (range) |
2.2 |
[1.0-4.5] |
0.7 |
[0.0-5.5] |
1.9 |
[0.08-6.7] |
1.3 |
(0.0-6.7) |
Proportion (%) of units tested
HBV reactive (mean (range) |
6.3 |
[3.4-11.4] |
2.08 |
[0.08-11.9] |
7.7 |
[0.3-17.4] |
4.2 |
(0.0-17.4) |
Proportion (%) of units tested
HCV reactive (mean (range) |
1.8 |
[0.3-4.6] |
0.7 |
[0.0-4.3] |
1.2 |
[0.0-4.9] |
1.0 |
(0.0-4.9) |
Proportion (%) of units tested
Syphilis reactive (mean (range)) |
1.1 |
[0.0-2.0] |
0.3 |
[0.1-8.3] |
0.8 |
[0.1-4.2] |
0.8 |
(0.0-8.3) |
Donor deferral rate |
Low weight (%) |
0.05 |
|
1.4 |
|
1.3 |
|
1.3 |
|
Low haemoglobin (%) |
0.2 |
|
4.7 |
|
1.6 |
|
3.6 |
|
Other medical conditions (%) |
3.7 |
|
4.4 |
|
2.1 |
|
3.7 |
|
High risk behaviour (%) |
0.1 |
|
1.5 |
|
2.4 |
|
1.6 |
|
Travel (%) |
0.006 |
|
0.3 |
|
0.02 |
|
0.2 |
|
Other reason (%) |
1.3 |
|
3.0 |
|
1.4 |
|
2.4 |
|
All reasons (%) |
5.5 |
|
15.4 |
|
8.8 |
|
13.0 |
|
*UNDP. Human Development Report 2013 [14]. VNRBD: Voluntary Non-remunerated Blood Donations, FRD: Family Replacement Blood Donations, PD: Paid Donations
Figure 2 shows details of the average proportion of voluntary non-remunerated blood donations (VNRBDs) in the WHO AFR countries. The average proportion of VNRBDs was 67%, ranging from 2.3% in South Sudan to 100% in 11 other countries. The proportion of VNRBDs was lower in Central Africa (34.4%) than is Eastern and Southern Africa as well as West Africa. In most part of the countries, the proportion of VNRDB was less than 5%.
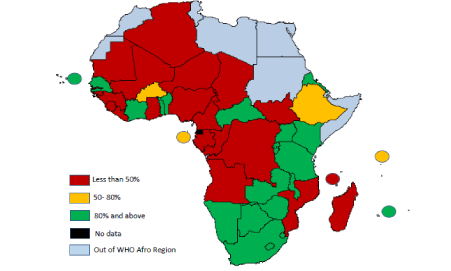
Figure 2. The average proportion of Voluntary non-remunerated blood donations in 46 countries of the WHO Afro Region in 2013.
About, screening, the median percentage of reactive blood units to TTIs was 1.3% for HIV (ranging from 0% to 6.7%), 4.2% for hepatitis B virus (HBV) (ranging from 0–17.4%), 1.0% for hepatitis C virus (HCV) (ranging from 0–4.9%), and 0.8% for syphilis (ranging from 0–8.3%).
As part of blood component preparation activities, red cell concentrate (RCC) was developed in 34 of the 39 countries, while platelets concentrate, fresh frozen plasma (FPP), and cryoprecipitate were prepared only in 28, 30 and 11 countries respectively. Out of 4,259,890 blood donations, 2,760,123 (64.8%) were separated into blood components.
Concerning clinical use of blood and blood components, of the 4,050,190 blood units collected in these countries, 4,151,127 were transfused as whole blood units or separated blood components units. The number of blood units transfused was 1,192,904 whole blood units (28.7%), 2,438,574 RCC (58.7%), 299,198 Platelets concentrate (7.2%) and 290,946 FFP (7%). The average deferral rate was 13.0%, ranging from 0.02% in Togo to 68.5% in The Seychelles. Out of the 4,013,814 blood donations collected, 280,164 (7.0%) were discarded.
Out of 45 countries, 20 (43.5%) had included the plasma-derived medicinal products (PDMP) in their national essential medicines list.
Comparison of blood safety indicators according to WHO Africa sub-Regions
The donation rate was lowest in West Africa, with 3.9/1,000 inhabitants. Central Africa had (5.6/1,000 inhabitants) and Eastern and Southern Africa (5.1/1,000 inhabitants). The proportion of VNRBDs was lowest in Central Africa (34.4%) than West Africa (48.4%) and Eastern and Southern Africa (92.4%). The proportion of HIV reactive blood units was the lowest in the Eastern and Southern African region (0.7%), and the same sub region had the highest proportion of whole blood separated into components (75.6%) (Table 4). The proportion of blood units discarded was the highest in Central Africa (9.3%) and the lowest in Eastern and Southern Africa (5.6%).
Table 4. Patterns of components preparation, blood discard and blood transfusion in Blood services of 39 countries of WHO Afro region in 2013
Patterns |
|
Central Africa |
East & Southern Africa |
West Africa |
Total Region |
Component preparation |
Countries preparing blood components (n) |
7 |
18 |
14 |
39 |
Countries preparing Red Cells concentrate (n) |
7 |
16 |
11 |
34 |
Countries preparing platelets concentrates(n) |
5 |
13 |
10 |
28 |
Countries preparing fresh frozen plasma(n) |
6 |
14 |
10 |
30 |
Countries preparing cryoprecipitate(n) |
1 |
7 |
3 |
11 |
Total donation (n) |
784.865 |
2,095,898 |
1,379,127 |
4,259,890 |
Number (%) of Whole blood separated |
430,906
(54.9) |
1,584,641 (75.6) |
744,576
(54.0) |
2,760,123
(64.8) |
Number (%) of Red cell preparation |
387,739
(49.4) |
1,333,107
(63.6) |
744,076
(53.9) |
2,464,922
(57.8) |
Number (%) of other preparations |
43,167
(5.5) |
1,437,841
(68.6) |
355,773
(25.8) |
1,836,781
(43.1) |
Proportion of discarded blood (%) |
Incomplete collection |
0.5 |
1.2 |
0.5 |
0.8 |
TTIs |
8.7 |
3.1 |
6.7 |
5.3 |
Expiry |
0.03 |
1.0 |
0.2 |
0.6 |
Storage problems |
0.1 |
0.1 |
0.1 |
0.07 |
Transportation problem |
0.002 |
0.02 |
0.01 |
0.01 |
Processing problem |
0.02 |
0.3 |
0.05 |
0.16 |
All reasons |
9.3 |
5.6 |
7.6 |
7.0 |
Transfusion |
Total blood donation (n) |
784.87 |
1,919,967 |
1,345,358 |
4,050,190 |
Total units transfused (n) |
398.53 |
2,497,678 |
1,254,920 |
4,151,127 |
Whole blood (%) |
52.1 |
22.4 |
33.9 |
28.7 |
RCC (%) |
42.9 |
55.0 |
54.6 |
58.7 |
Platelets concentrates from
apheresis donation (%) |
0.4 |
8.3 |
7.1 |
7.2 |
Platelets concentrates from
whole blood donation (%) |
0.00 |
1.3 |
0.3 |
0.8 |
Fresh frozen plasma (%) |
1.6 |
9.4 |
3.9 |
7.0 |
Plasma (%) |
3.0 |
2.0 |
0.01 |
1.5 |
Cryoprecipitate (%) |
0.0 |
1.4 |
0.03 |
0.9 |
Our survey shows that half of the countries analysed are yet to implement a full blood transfusion legislation and the donation rate is half of what is needed. Overall, TTIs seroprevalence is more than 6%, while only 2/3 of whole blood is separated into components. The Central African sub-region had the lowest levels of blood safety indicators, while the South & East African sub-region had the highest.
When comparing current data against previous WHO reports, the total number of blood donations in the WHO Africa Region increased between 2010 and 2013 [6,7]. The number of countries that collected at least 10 units per 1,000 population as recommended by WHO has also doubled in the same period. Therefore, the effects of national and international interventions are apparent in donor recruitment, education, and motivation campaigns. However, considering the WHO standard of collecting at least 10 units of blood per 1,000 population as the amount of blood required for blood transfusion needs per country per year, there was a shortfall of 4 million units of blood units compared to the target for the Region in 2013. Reliance VNRBR from low-risk populations is a WHO recommendation. There are however challenges in keeping sustainable blood supply programs from VNRBD since these should ideally contribute 20-40% of blood donors. The requisite levels of sensitization, education, recruitment, motivation, and mobile drives programs that must be in effect on a daily-basis have significant cost implications for majority of low income countries. Governments should increase and consolidate their support to blood services for sustainable blood supply as it is the case in Malawi and South Africa. Indeed, despite a continuous reduction in external funding mechanisms, the proportion of VNRBD has increased in the aforementioned countries [10].
The mean deferral rate in the WHO African Region has increased by 3% since 2010. The rate recorded in this study is the same reported in a multicentric study carried out in sub-Saharan Africa [11]. This is a high rate compared to developed countries [12]. This may be due to a more rigorous medical selection or low HIV prevalence in prospective blood donors in developed countries. African blood services also need to conduct appropriate studies, refine criteria for donor eligibility and design an efficient medical selection methodology. The small number of donors deferred for low haemoglobin is questionable since anaemia is often reported in 10–30% of cases among African blood donors. Using clinical signs rather than hemoglobinometers, it may be the case that some facilities underestimate anaemia [13].
Despite significant decrease in TTIs seroprevalences this last decade in Africa [14], the average proportion of blood units reactive to positive to TTIs markers has not changed in the WHO African Region between 2010 and 2013. This depends on several factors beyond the scope of this paper such as the algorithms used, the test kits available on the market, validation of the test kits, storage and lack of skilled human resources, among other factors. An assessment of each country is needed to provide a comprehensive understanding of the reasons for such outcomes. Irregular supply and unavailability of reagents in blood centres are reported as key elements that hamper systematic screening [15]. Furthermore, advocacy for the supply of reagents, development of rigorous screening procedures, and training of staff may increase the number of units screened for TTIs.
There has been a slight increase in the proportion of whole blood units separated into components, raising from 60% in 2010 to 64% in 2013. Increase in the proportion of VNRBD may explain this improvement in processing activities since it has been shown, in the previous survey, that countries whose blood programmes are organized along voluntary blood donations organize better component production programmes. This is due to the fact that their collections are not patient based, unplanned, and more often not centred around emergencies. Increased blood components production in countries should ensure improved availability and appropriate clinical use of blood. In this regard, countries need to use adequate processing technologies which will further enhance the production of more blood components in the region.
We emphasise that the countries of this region need to be supported to improve their blood component production, as well as the preparation of paediatric packs to improve appropriate clinical use of blood in order to avoid wastage of a scarce resource. Doing so will simultaneously reduce the risk of contamination associated with an open unit of blood. In this report, the leading cause for discarding blood was reactivity to markers of infections transmitted through blood transfusion as it was in 2006 and 2010. According to the countries that provided information on this issue, the proportion of blood units discarded for TTIs has been shown to decrease since 2006 [6]. This further underscore the need to invest in collecting blood from low-risk blood donors which remains the foundation of any safe blood supply system. The 2013 survey also reported a significant decrease in the proportion of expired and discarded blood units, revealing a decrease from 2.9% in 2010 to 1% in 2013. Shortage of supply is another substantial challenge in the region that can be remedied by the implementation of more rigorous practices concerning inventory and distribution management of blood and blood products.
We noted a significant difference in blood safety indicators between the WHO/AFRO Regions, such as the degree and quality of government support. It may be lower in Eastern and Southern Africa because funding of blood services in these regions is based on cost recovery through payment for blood units by patients or health insurance providers. In contrast, lower donation rates in West Africa could be explained by the low donation rate in some big countries compared to their large and rapidly increasing population. In the Central African sub-region, the mean seroprevalence of Syphilis dropped five-fold. However, the figure has increased in Eastern and Southern Africa for HBV and Syphilis, respectively. The accuracy of this data is reasonably dependable because the vast majority of blood unit screening was reported by the countries to have been screened in a quality assured manner, including use of documented standard operating procedures (SOPs), as well as procedural accountability to an external quality assurance scheme (EQAS). Based on observations in the field, the need for implementation of a higher quality management system is obvious in that it will help in providing more reliable data. Increase in seroprevalence in some countries and sub-regions results from inefficient TTIs screening of blood donors at the medical selection stage. Recently, the African Society of Blood Transfusion (AfSBT) developed a set of standards and quality reference documents adapted to resources-limited areas such as the African Region. Implementation of good practices using accreditation standards is a key strategy in improving blood donors and blood donation quality screening in the African Region [16].
Our analysis shows that there has been an increase in the number of countries that reported development, adoption, and implementation of a national blood safety policy, with 29 countries in 2010 compared to 38 countries in 2013 had a policy document. Similarly, 11 countries in 2010, compared to19 countries reported having a legislation in 2013. Despite this improvement, development and adoption of legislation remains the biggest issue in terms of the organization and management of blood services in the Region.
We also noted a significant increase in some blood centres in the African Region. This overview also shows that a significant number of countries had national standards, blood transfusion policies, and took part in EQAS as well. Thus, there is need for advocacy in countries for a coherent way to ensure a sustainable supply of safe blood through coordinated and unique national blood service that manages all blood centres in a univocally high-quality manner. For the first time in this regional report, countries provided an estimation of their needs and funding sources. The percentage of transfused RCC has increased in all the regions. with a 6% increase since 2010. Global reduction in number of transfused whole blood units is linked to improvements in techniques and methods for separation of whole blood into components. There was also an improvement in the proportion of hospitals having set-up a transfusion service committee in 2013. However, the arrangements required to implement a sound clinical interface were not well developed in many countries. Regarding hemovigilance, the frequency of severe incidents and reactions is estimated to be 10 to 20 times higher than in developed countries [14]. This data may be underestimated since it is based on the rate of reporting from clinical units that may not have registered or sent all cases to the requisite blood service centres. Indeed, very few staff from African clinical units are trained in reporting adverse events and appropriate clinical use of blood [15]. About half of the countries had included plasma-derived medicinal products (PDMP) in their essential medicines list. This is encouraging as some neurologic, hematologic, and immune diseases are only treated with intravenous immunoglobulin (IVIG), Factor VIII and IX, or anti-RhD immunoglobulin for intra muscular use. Immunization programs also require the regular provision of vaccines and sera such as Anti-Rabies IgG, Anti-Tetanus IgG, Anti-HBV-IgG, anti-RhD and all of which are PDMP. However, sustainability in the provision of some products such as F-VIII and IX for haemophilia care is not guaranteed since these are highly expensive blood products in and of themselves.
Only one country did not respond to the survey, hence the details of the status of their blood services could not be accurately or comprehensively assessed. As in the previous surveys, some answers did not reflect the situation on the ground in two countries when compared with observations made during other WHO missions to said countries. For example, one of the two countries provided the number of donations of a single hospital blood bank to be considered as representative of the total number of blood donation of the country for a year. Missing data could affect the overall assessment of blood services in some countries and the entire African Region more broadly. Likewise, the blood donations reported in the second country for this survey only cover approximately 10% of the actual collection. These two countries which may face challenges in data collection and reporting need to be given more attention and support to improve the reliability of their data sets in subsequent surveys. However, these limitations do not significantly change the quality of data sent by countries as they are limited to a small number of countries and few indicators. Indeed, this study covers 99.9% of the population and 46 out of the 47 countries of WHO African Region. Whenever data was lacking or inconsistent for a specific parameter, the corresponding countries were not considered in the analysis of that particular parameter. Since not all countries reported on every parameter, the number of countries, centres, or units of blood transfused for example, depended on the number of countries that responded to the particular question.
Governments and Development Partners have provided tremendous support at all levels of intervention in the blood safety value chain. However, this report shows that the African Region is still falling short of meeting its safe blood requirements. The year 2012 marked the end of the period for attaining the targets set out in the Regional Strategy for blood safety adopted by the WHO Regional Committee for Africa in 2001. The same causes frequently reported may explain the shortfalls in this regard including, but not limited to the following: lack of policy commitment in some countries despite the development and adoption of national policies, low government funding and reliance on external funding, lack of skilled human resources with competitive career prospects for BTS staff, lack of adequate infrastructures and equipment, as well as the absence of a sufficient quality management system at each section of the blood safety chain, from blood donors to recipients. Consequently, the prevention of the transmission of blood-borne infections is not yet entirely assured in some countries and the availability of safe blood for all transfused patients in the African Region is still compromised, especially in remote areas. Furthermore, as part of health Sustainable Development Goals (SDG) and Universal Health Coverage (UHC), the ineffective transfusion services do not contribute to the reduction of maternal and infantile mortality, as well as management of road traffic accidents and non-communicable diseases. That said, the status of blood safety in many countries of the WHO African Region is improving year after year in terms of its conformity with the guidelines elaborated by the World Health Assembly (WHA) and Regional resolutions on blood safety. The Central African region is the lowest performing region and needs particular attention and specific implementation of projects in order to attain the same level as other sub regions of the WHO AFR. The results of this survey should be used to identify gaps in each Member State and sub-regions’ blood transfusion policies, as well as to map out specific strategies and effective interventions that will help bridge gaps identified at country level while paying attention to the need to collect reliable and accurate data through improving the coordination of data collection between blood centres, hospitals, and their respective ministries of health. We also suggest that the following four elements should be considered in further strategic planning and implementing blood safety activities in the African Region: (1) whole blood and main blood components as essential medicines, (2) regulatory system for blood services and blood products, (3) pathogen inactivation of whole blood and, (4) convalescent whole blood or plasma collected from patients recovered from Ebola virus disease.
WHO would like to thank all Directors of National Blood Transfusion Services listed (NBTS) below and the designated senior staff of the Ministries of Health in the Member States of the WHO African Region, for their contribution in compiling the data from countries and filling the Blood Safety Indicator tool on line.
Ould Kablia Linda (Algeria), Anani Ludovic (Benin), Mukendi Kayembe (Botswana), Honorine Dahourou (Burkina Faso), Christine Nina Niyonsavye-Elias (Burundi), Noah Appolonie (Cameroon), Maria conceicao Ramos (Cabo Verde), N’Ndomackra Alain Blaise (Central African Republic), Mbanga Djimadoum (Chad), Said Fazul Ahamada (Comoros), Bokilo-Dzia Amelia (Republic of Congo), Konate Seidou (Cote d’Ivoire), Yuma Ramazani Sylvain (Democratic Republic of Congo), Ndemesogo Jean Manuel (Equatorial Guinea), Yifdeamlak Tesfamariam Bakari (Eritrea), Daniel G. Michael (Ethiopia), Ntsame ndong Mireille (Gabon), Mariama Jammeh (Gambia), Kordai Ansah Justina (Ghana), Nyankoye Haba (Guinea), Carlos da Costa (Guinea-Bissau), Oduor Margaret (Kenya), Maleqhoa Nyopa (Lesotho), Lwopu Bruce (Liberia), Fortunée Herisoa (Madagascar), Stephen E NJolomole (Malawi), Baby Mounirou (Mali), Ould Boulahy Mohamed Abdallahi (Mauritania), Sonoo Janaki (Mauritius), Dina Safina Ambasse Ibraimo (Mozambique), B. Von Finckenstein (Namibia), Seydou Maiguizo Seydou Maiguizo (Niger), Oluwotoyin Smith (Nigeria), Gatare Swaibu (Rwanda), Cristiano Almeida Pires de Santos (Sao Tome and Principe), Prosper Kinabo (Seychelles), Diop Saliou (Senegal), Baker Samuel H (Sierra Leone), Ingram Charlotte (South Africa), James Chitsva (South Sudan), Hosea M. Sukati (Swaziland), Efesper Nkya (Tanzania) Lochina Feteke (Togo), Kyeyune Byabazaire Dorothy (Uganda), Gabriel Muyinda (Zambia) Lucy Mary Marowa (Zimbabwe). We also thank the WHO Country Officers who facilitated the return process of the final Global Database on Blood Safety (GDBS) corrections from NBTS to the Regional Office.
We thank also Derege KEBEDE who read this document as WHO internal reviewer and Delanyo Yao Tsidi DOVLO, Director of HSS Cluster for his review and clearance. WHO wishes to thank all the international agencies and institutions that have tremendously contributed by supporting countries in the African Region in the improvement on access to safe blood, blood components and blood products.
- World health statistics: 2016 monitoring health for the SDGs indicators of overall progress [internet]. World Health Organization; 2016 [cited 2018 Jun 9]. Available from: http://www.who.int/gho/publications/world_health_statistics/2016/en/
- The global prevalence of anaemia in 2011 [internet]. World Health Organization: 2015 [cited 2018 Jun 9-. Available from: http://www.who.int/nutrition/publications/micronutrients/global_prevalence_anaemia_2011/en/. Geneva: World Health Organization; 2015.
- Twenty-eighth World Health Assembly (WHA28.72) Utilization and supply of human blood and blood products [internet]. World Health Organization; 1975 [cited 2018 Jun 9]. Report No.:4. Available from: http://www.who.int/bloodsafety/en/WHA28.72.pdf.
- Blood safety: A strategy for the African region [internet]. World Health Organization; 2001 [cited 2018 Jun 9]. Report No.: 5. Available from: http://www.who.int/bloodsafety/BTS_ResolutionsAdopted.pdf
- Status of blood safety in the WHO African Region: Report of the 2004 Survey. Brazzaville: World Health Organization; 2007.
- Tapko JB, Mainuka P, Diarra-Nama AJ (2014) Status of blood safety in the WHO African Region: Report of the 2006 Survey. Brazzaville: World Health Organization; 2009.
- Tapko JB, Toure B, Sambo LG. Status of blood safety in the WHO African Region: Report of the 2010 Survey. Brazzaville: World Health Organization; 2014.
- World Health Organization (2018) WHO/AFRO database on blood safety [internet]. Geneva: World Health Organization; [cited 2018 Jun 9]. Available from: http://www.who.int/bloodsafety/global_database/en/
- Malik K (2013) Human development report 2013: The rise of the south: human progress in a diverse world [internet]. UNDP; [cited 2018 Jun 9]. Available from:
http://hdr.undp.org/sites/default/files/reports/14/hdr2013_en_complete.pdf
- World Health Organization (2017) Current status on blood safety and availability in the WHO African Region [internet]. Geneva: World Health Organization; 2017 [cited 2018 Jun 9]. Available from: http://www.who.int/iris/handle/10665/254656.
- Tagny CT, Kouao MD, Touré H, Gargouri J, Fazul AS, et al. (2012) Transfusion safety in francophone African countries: an analysis of strategies for the medical selection of blood donors. Transfusion 52: 134–143. [Crossref]
- Global Status report on Blood safety and availability 2016 [internet]. World Health Organization [cited 2018 Jun 9]. Available from: http://apps.who.int/iris/bitstream/handle/10665/254987/9789241565431-eng.pdf?sequence=1
- Tayou Tagny C, Monny Lobe M, Mbanya D (2006) [Evaluation of two methods of haemoglobin measurements in Cameroonian blood donors]. Transfus Clin Biol 13: 331–334. [Crossref]
- Centers for Disease Control and Prevention (CDC) (2011) Progress toward strengthening national blood transfusion services – 14 Countries, 2008-2010. MMWR Morb Mortal Wkly Rep 60: 1578-1582. [Crossref]
- Bloch EM, Vermeulen M, Murphy E (2012) Blood transfusion safety in Africa: A literature review of infectious disease and organizational challenges. Transfus Med Rev 26: 164-180. [Crossref]
- Armstrong B. (AfSBT) Step-Wise Accreditation Standards [internet]. Africa society for blood Transfusion. [cited 2016 Aug 18]. Available from:
http://www.afsbt.org/images/accreditation_documents/AfSBT_Step_Wise_Accreditation_Standards.pdf
- Stainsby D, Russell J, Cohen H, Lilleyman J (2005) Reducing adverse events in blood transfusion. Br J Haematol 131: 8-12. [Crossref]
- Dahourou H, Tapko JB, Nébié Y, Kiénou K, Sanou M, et al. (2012) [Implementation of hemovigilance in Sub-Saharan Africa]. Transfus Clin Biol 19: 39-45. [Crossref]