This study aimed to perform bioinformatics analysis of differentially expressed NONHSAT089447, NONHSAT021545 and NONHSAT041499 and their co-expressed mRNAs in blood samples of patients with schizophrenia, to provide the theoretical basis for further research. We screened the peripheral blood mononuclear cells in 5 patients and 5 controls, 10 differentially expressed lncRNAs were selected and validated in 106 patients and 48 controls by qPCR. The co-expressed mRNAs of lncRNAs were identified by calculating Pearson correlation, and the result were analyzed by gene ontology and KEGG pathway analysis using DAVID. Then an lncRNA-transcription factor-gene network was performed. The co-expressed mRNAs of lncRNAs were participate in diverse GO biological processes, among which some terms have direct relationship with the central nervous system; The pathway analysis showed that a significant enrichment in ribosome, lysosome, amyotrophic lateral sclerosis, glycolysis/Gluconeogenesis, GnRH signaling pathway, hematopoietic cell lineage, leukocyte transendothelial migration, mTOR signaling pathway, insulin signaling pathway and apoptosis; LncRNA-transcription factor-gene network showed that TAF1、EBF1 and USF1 were important transcription factors and that 15 genes (RPL13A, RPL12, RPL10A, RPS2, CASC4, HIST1H4E, PTMA, RPL17, RPL26, RPL3, RPS18, SH2B3, SLC15A4, TPP1, TRAPPC2L) may play a key role in schizophrenia. Bioinformatics analysis indicates that NONHSAT089447, NONHSAT021545 and NONHSAT041499 and their co-expressed mRNAs are closely related to the mechanism and pathogenesis of schizophrenia.
LncRNA, schizophrenia, bioinformatics, transcription factor
Schizophrenia (SZ) has been one of the most disabling mental disorders with onset usually in early adulthood, imposing great social burden and paralyzing individuals’ life. To date, the pathomechanism of SZ is unclear, although current evidence demonstrated that interactions between environmental and genetic factors contribute to SZ development [1]. It has always been the major goal of investigators to understand the underlying pathophysiology of SZ and to determine effective treatment approaches for SZ patients [2]. The major obstacle in achieving this goal is the absence of reliable and simple biomarkers based on SZ diagnose and antipsychotic responses [3,4].
In recent years, noncoding RNAs (ncRNAs) has become the focus of study around the globe, among which microRNA has been fully tapped in a great variety of diseases. Unfortunately, inconsistent results have made it so difficult to yield significant conclusions. Therefore, more valid biomarkers for psychiatric diseases warrant notice. lncRNAs are noncoding transcripts longer than 200 nucleotides, that are increasingly appreciated as important regulators of gene expression. Previously, lncRNAs were often considered to be transcriptional ‘noise’ [5]. However, in recent years, accumulating evidences indicates that several lncRNAs may act as modular scaffolds, combining multiple nucleic acid and protein binding domains to interact functionally with the activity of multiple effector proteins [6-8]. This suggests that lncRNAs may have critical roles in a wide range of biological processes, including the regulation of gene expression, cell proliferation and differentiation, and disease [9]. Recent researches indicate that lncRNAs may play a potential role in neurodevelopmental, neurodegenerative and psychiatric disease and brain cancer [7]. lncRNAs are often expressed in a highly cell type-dependent or tissue-specific manner and can be detected in peripheral blood in many neuropsychiatric diseases [10]. Because its characteristics of noninvasive, easy accessibility, high measurement accuracy, and cost-effective, circulating lncRNAs may potentially serve as novel biomarkers of SZ [10,11]. However, there have been hardly any studies on the lncRNAs expression profile in peripheral blood of SZ patients and on investigating their response to antipsychotics medications have been conducted.
Altered expressions of lncRNAs have been demonstrated to contribute to genetic and biological basis of neuropsychiatric disorders, including Alzheimer’s disease (AD) Arisi et al. [12], major depressive disorder(MDD) Liu et al. [13], Parkinson’s disease (PD) Sai et al. [14], and amyotrophic lateral sclerosis (ALS) [15]. Using Logic Mining method, Arisi et al. analyzed the microarray expression dataset of antiNGF AD11 transgenic mouse model and foundSox2OT and 1810014B01Rik would serve as the best biomarkers of neurodegeneration in both early and late stages [12]. Mercer et al. found 849 ncRNAs expressed in the adult mouse brain, majorities were associatedwith specific neuroanatomical regions, cell types, or subcellularcompartments [16]. One recent study profiled the expression of 34834 lncRNAs and 39224 mRNAs in peripheral blood sampled from MDD patients as well as demographically-matched controls. The results revealed that 2007 lncRNAs and 1667 mRNAs were differentially expressed, 17 of which were documented as depression related gene in previous studies [17]. Although the association between aberrant lncRNAs expression and SZ has been investigated, the pharmacological effects of antipsychotic treatment on lncRNAs expression are largely unknown.
We already found out that there were three lncRNAs, namely NONHSAT089447, NONHSAT021545 and NONHSAT041499, which had differentially expressed in schizophrenia patients based upon microarray analysis and PCR verification. In this study, we used bioinformatics methodology to predict the target genes of lncRNA that were aberrantly expressed in the peripheral blood in SZ patients and GO functional enrichment analysis and KEGG pathways enrichment analysis were applied in an effort to explore further into the role of certain lncRNA involved in the molecular mechanism of schizophrenia.
Patients
A total of 106 SZ patients, 54 male and 52 female, who met the diagnostic criteria as defined by the Diagnostic and Statistical Manual of Mental Disorders, 4th Edition for SZ were enrolled from No.102 Hospital of the People’s Liberation Army from October 2012 to June 2014. All patients, aged from 15 to 80, were drug naive from any antipsychotic treatment, or in the absence of antipsychotic medication within at least 3 months before enrollment. The exclusion criteria were as follow: a personal history of severe medical diseases, other psychiatric disorders, structural brain disorders, cognitive disability, unstable psychiatric features and movement disorders. Also, patients who had brain injury causing traumatic amnesia longer than 24 hours, and who received blood transfusion within 1 month or electroconvulsive therapy within 6 months, were excluded from the study.
Forty-eight healthy controls, 25 male and 23 female, without any family history of major psychiatric disorders (SZ, bipolar disorder, and major depressive disorder) within the last three generations were recruited. Similarly, all healthy controls were without any history of blood transfusion or severe traumatic event within 1 month. Patients and healthy controls were matched in gender, age and ethnicity. The study was approved by the local Institutional Review Board. Written informed consent was obtained from all participants.
Blood collection and RNA extraction
Whole blood (5 ml) was collected in EDTA anticoagulant tube from each subject and processed within 1hour. PBMCs were isolated from the blood through density gradient centrifugation and stored at -80°C until use. Total RNAs were isolated from the PBMCs using Trizol (Invitrogen, Carlsbad, CA, USA) and the RNeasy kit (Qiagen, Hilden, Germany) according to the manufacturer’s protocol, quantified by NanoDrop (Thermo Scientific, Delaware, ME, USA), DNase treated (TurboDNase, Life Technologies) and reverse transcribed (Superscript III; Invitrogen). The integration of RNA was confirmed by gel electrophoresis.
lncRNA microarray expression profiling
RNA samples from 5 SZ patients (male, 23 years; male, 31years; male, 33 years; female, 28 years; female, 42 years) and 5 controls (male, 20 years; male, 33years; male, 34 years; female, 26 years; female, 43 years) were used for lncRNA microarray profiling. lncRNA expression was measured by Human lncRNA 3.0 array (Arraystar, Santa Clara, CA, USA). The sample labeling, microarray hybridization and washing were performed based on the manufacturer’s standard protocols. Afterwards, the labeled RNAs were hybridized onto the microarray. Having washed and stained the slides, the arrays were scanned by the Agilent Scanner G2505C (Agilent). The scanned images were analyzed using Feature Extraction software (version10.7.1.1, Agilent Technologies) and Gene spring software (version 12.5; Agilent Technologies).
Real-time quantitative reverse-transcription PCR (qRT-PCR)
According to microarray results, the top lncRNAs with the highest expression changes were chosen for further validation with qRT-PCR. Blood samples from 106 SZ patients and 48controls were used to validate the candidate lncRNAs. Total RNAs were isolated from the PBMCs using Trizol reagent (Invitrogen®, USA) for quantitative detection of lncRNA. Complementary DNA was synthesized using the Reverse Transcription TaqMan RNA Reverse Transcription Kit (Applied Biosystems, inc., USA) according to the manufacturer’s instructions. Real-time PCR was performed using Applied Biosystems 7900HT Real-Time PCR System (Applied Biosystems, Inc., USA). Data were collected using the SDS 2.3 software (Applied Biosystems, Inc.) and DataAssist v3.0 software. After normalized to β-Actin, the expression levels of lncRNAs were calculated using the 2-ΔΔCt method.
Statistical analysis
Statistical analyses were carried out using Statistical Package for Social Sciences (SPSS) for Windows 22.0, Data Assist 3.0, and Graph pad Prism 5.01. Mann-Whitney U test was performed to test the differences of 10 lncRNAs between SZ and healthy controls subjects. lncRNAs data were presented as fold change relative to the control group (control=1). Pearson correlation test was carried out for testing the correlation of lncRNAs expression level change with symptomatology scores changes. The difference in coping style between higher lncRNA expression subgroup and lower lncRNA expression subgroup were also measured by independent sample t test. All statistical tests were two-tailed and P-values of <0.05 was considered to indicate significant differences. The correlations between the expression of NONHSAT089447, NONHSAT021545 and NONHSAT041499 and the expression of differentially expressed mRNA in microarray analysis were made, and the mRNA co-expressed with lncRNA were identified by the criteria of P <0.05 and r>0.7.
GO and KEGG pathway enrichment analysis
We used the database for annotation, visualization and integrated discovery (DAVID) (http://david.abcc.ncifcrf.gov/) to make GO and KEGG pathway enrichment analysis of the three-mRNA co-expressed with lncRNA. A significant threshold of P value was set as 0.1 by readjusted Fisher exact probability test.
Correlation between lncRNA and transcription factors
The overlap between the coding gene set co-expressed with lncRNA and the target gene set of transcription factors was calculated. The enrichment of this overlap set was measured by hypergeometric distribution calculation, and the significant lncRNA-relevant transcription factors were identified, among which the ones that played a joint regulating role with lncRNA might be identified. We further used the Cytoscape software to construct topographical map of the interaction between lncRNAs and transcription factors and target genes.
LncRNA microarray expression profiling
Using ten blood samples (5 SZ patients and 5 controls) in microarray profiling, 125 lncRNAs were identified with significantly different expression levels in SZ patients compared with controls (fold change ≥ 2; P<0.05). Of these, 62 lncRNAs were up-regulated and 63 others were down-regulated. The list of the differentially expressed miRNAs identified by microarray analysis is shown in Table 1. In the 125 differentially expressed miRNAs, 5 up-regulated lncRNAs (NONHSAT021545, NONHSAT041499, NONHSAT089447, NONHSAT098126, NONHSAT104778) and 5 down-regulated lncRNAs (ENST00000394742, ENST00000521622, ENST00000563823, TCONS_l2_00021339 and TCONS_l2_00025502) were chosen for further validation in larger sample using the qRT-PCR method (Table 1). These 10 miRNAs were chosen based on the following criteria: miRNAs with higher fold change in microarray results; miRNAs that had been reported; miRNAs that could be detected in every sample.
Table 1. 10lncRNA differentially expressed in SZ patients by microarray analysis
TargetID |
FC (abs) |
Regulation |
p |
ENST00000394742 |
5.686522 |
down |
0.001366 |
ENST00000521622 |
3.558301 |
down |
0.003411 |
ENST00000563823 |
3.775364 |
down |
0.012859 |
NONHSAT021545 |
3.697919 |
up |
0.023714 |
NONHSAT041499 |
5.115068 |
up |
0.004037 |
NONHSAT089447 |
3.514152 |
up |
0.03892 |
NONHSAT098126 |
4.610542 |
up |
0.047744 |
NONHSAT104778 |
3.242618 |
up |
0.039281 |
TCONS_l2_00021339 |
3.405084 |
down |
0.010672 |
TCONS_l2_00025502 |
5.130027 |
down |
0.016325 |
Comparison of lncRNA expression between SZ patients and controls
As shown in the Table 2, altogether three lncRNAs (NONHSAT089447, NONHSAT021545 and NONHSAT041499) in SZ patients were up-regulated compared to healthy controls, like those determined by microarray analysis(P<0.05) (Table 2).
Table 2. comparison of ΔCt value between SZ group and control group
Probes |
NC (n=48) |
SZ (n=106) |
P value |
PR1 |
5.735±4.434 |
4.262±4.279 |
0.0615 |
PR2 |
6.497±5.112 |
5.245±4.775 |
0.1575 |
PR3 |
6.835±5.384 |
5.341±4.809 |
0.0996 |
PR4 |
6.284±5.373 |
4.362±4.828 |
0.0349 |
PR5 |
5.311±4.653 |
3.744±4.611 |
0.0627 |
PR6 |
6.475±4.499 |
4.627±4.619 |
0.0271 |
PR7 |
6.705±4.452 |
5.154±3.916 |
0.0373 |
PR8 |
7.460±5.334 |
6.010±4.899 |
0.1130 |
PR9 |
5.552±5.330 |
3.915±4.929 |
0.0751 |
PR10 |
7.299±5.104 |
5.875±4.768 |
0.1072 |
Note: PR1=ENST00000394742, PR2=TCONS_l2_00025502, PR3=NONHSAT098126, PR4=NONHSAT089447, PR5=ENST00000563823, PR6=NONHSAT021545, PR7=NONHSAT041499, PR8=ENST00000521622, PR9=TCONS_l2_00021339, PR10=NONHSAT104778
LncRNA co-expressed coding genes
We had three differentially expressed lncRNAs (NONHSAT089447, NONHSAT021545 and NONHSAT041499), and correspondingly, we identified 1773 mRNAs co-expressed with NONHSAT021545, 638 mRNAs co-expressed with NONHSAT041499 and 1602 mRNAs co-expressed with NONHSAT089447. There were 89 mRNAs that co-expressed simultaneously with three above-mentioned lncRNAs (Table 3). Figure 1~3 were the heat maps generated by the 30 most relevant mRNAs expression levels of the three lncRNAs by unsupervised hierarchical clustering analysis.
Table 3. Co-expressed genes with all three lncRNAs
EPHA3 |
IL6R |
EPHA4 |
PPTC7 |
PRELID1 |
ANKRD36 |
CT62 |
MGEA5 |
ZNF155 |
SEL1L3 |
MTRF1L |
LOC153811 |
REXO1L1 |
TRERF1 |
EIF4G3 |
RASGRP3 |
SH2D1A |
FZD1 |
LSM1 |
TRPS1 |
RD3 |
RNF220 |
ZNF550 |
FAM196B |
CD79A |
IFT46 |
SSB |
GCNT2 |
COL19A1 |
PAK1 |
RPL26 |
IL1RAP |
ARID5B |
PCDHB4 |
CTNNA1 |
ASCC3 |
BSDC1 |
TRMT5 |
ITGA1 |
OXCT1 |
KIAA0485 |
DIAPH3 |
psiTPTE22 |
FLT3 |
SIGLEC5 |
UPF2 |
MRPL9 |
RPL35 |
LOC100507650 |
EYA1 |
ROS1 |
LEUTX |
DOK7 |
RIMS3 |
MGC20647 |
ANO1 |
MAPK14 |
GJB3 |
MEX3D |
TMEM164 |
SLC9A1 |
DISC1 |
CCR2 |
KCNE1 |
LHFPL1 |
GYLTL1B |
CDCA7L |
PPP2CB |
RPL36A |
OR2L3 |
FCRL1 |
LBH |
HMGN2 |
WDFY3 |
LOC100505857 |
HNRNPA1L2 |
KCNJ15 |
RPL37A |
GPATCH3 |
FAM129C |
MCF2 |
PET117 |
MYL10 |
PIK3C2B |
RAB21 |
FAM190B |
RPS19 |
FMO5 |
AUTS2 |
|
|
|
|
|
|
|
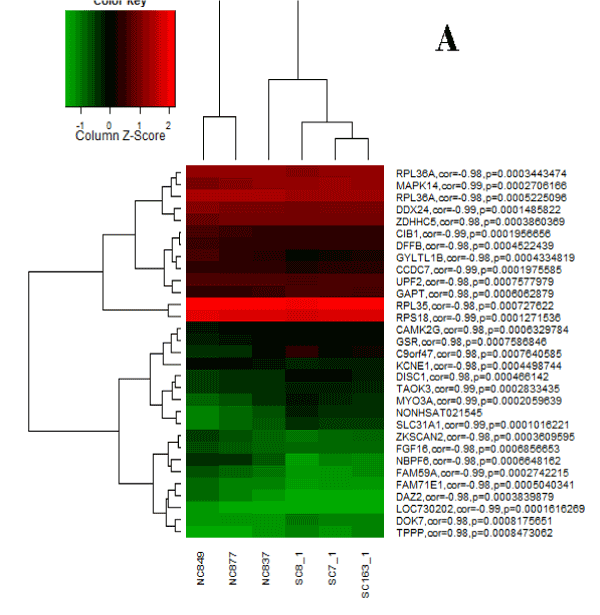
Figure 1. Heat map for NONHSAT021545.
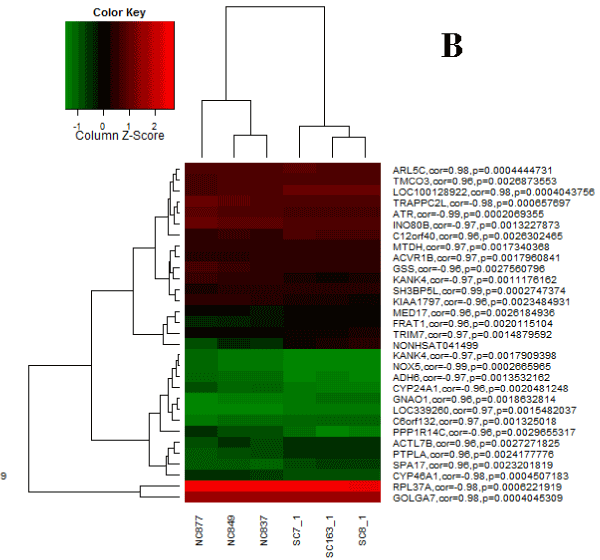
Figure 2. Heat map for NONHSAT041499.
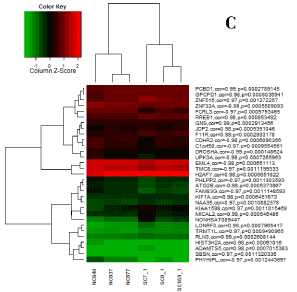
Figure 3. Heat map for NONHSAT089447.
GO enrichment analysis for lncRNA co-expressed genes
GO biological process enrichment analysis was carried out for those mRNA co-expressed with lncRNAs, and the results suggested that these genes have a wide variety of biological effects associated with signal transduction, multicellular organismal development, cell cycle, cell proliferation, differentiation, apoptosis, and metabolic process, etc. Notably, several important biological processes (pallium development, axon guidance and extension, synaptic transmission, synaptic transmission, learning, memory etc.) played a significant role in brain development and function (Table 4), which may be relevant to the pathophysiology of SZ.
Table 4. GO biological process items with significant enrichment relevant to central nervous system
GO number |
Biological process items |
P value |
FDR |
0051402 |
neuron apoptosis |
0.004 |
7.240738 |
0046578 |
regulation of Ras protein signal transduction |
0.004 |
7.854287 |
0046579 |
positive regulation of Ras protein signal transduction |
0.005 |
9.803511 |
0032496 |
response to lipopolysaccharide |
0.008 |
14.27691 |
0007254 |
JNK cascade |
0.011 |
18.9682 |
0070302 |
regulation of stress-activated protein kinase signaling pathway |
0.011 |
19.06017 |
0007611 |
learning or memory |
0.012 |
20.08509 |
0046328 |
regulation of JNK cascade |
0.013 |
21.97039 |
0050803 |
regulation of synapse structure and activity |
0.020 |
30.90909 |
0007265 |
Ras protein signal transduction |
0.020 |
31.94657 |
0031098 |
stress-activated protein kinase signaling pathway |
0.021 |
32.6278 |
0007610 |
behavior |
0.032 |
46.07315 |
0031175 |
neuron projection development |
0.039 |
52.61498 |
0007264 |
small GTPase mediated signal transduction |
0.042 |
55.32477 |
0043523 |
regulation of neuron apoptosis |
0.042 |
55.33304 |
0048812 |
neuron projection morphogenesis |
0.051 |
62.58074 |
0007612 |
learning |
0.057 |
66.421 |
0021819 |
layer formation in the cerebral cortex |
0.060 |
68.9358 |
0007409 |
axonogenesis |
0.064 |
71.271 |
0007219 |
Notch signaling pathway |
0.079 |
78.71841 |
0007605 |
sensory perception of sound |
0.081 |
79.65405 |
0050807 |
regulation of synapse organization |
0.082 |
79.83228 |
0000187 |
activation of MAPK activity |
0.098 |
85.58835 |
0043525 |
positive regulation of neuron apoptosis |
0.099 |
85.81547 |
KEGG signal pathway enrichment analysis for lncRNA co-expressed genes
Similarly, the KEGG pathway analysis showed that significant enrichment in 10 pathways related to neuronal brain function, such as ribosome signaling pathway, lysosome signaling pathway, GnRH signaling pathway, mTOR signaling pathway, insulin signaling pathway, apoptosis signaling pathway etc. (Figure 4).
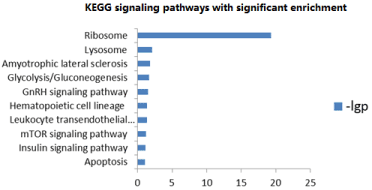
Figure 4. mRNA KEGG pathways with significant enrichment co-expressed with lncRNA
Association analysis between lncRNA and transcription factors
We identified 7 transcription factors that were significantly associated with NONHSAT021545, namely TAF1, USF1, CEBPB, BRCA1, EBF1, ZBTB33 and NFE2, 2 transcription factors that were significantly associated with NONHSAT041499, namely E2F6 and NFE2, and 7 transcription factors that were significantly associated with NONHSAT089447, namely JUND, TBP, TAF1, BATF, ELK4, EBF1 and ZBTB7A. A tophgraphical map of lncRNA, transcriptional factors and target genes was constructed as Figure 5.
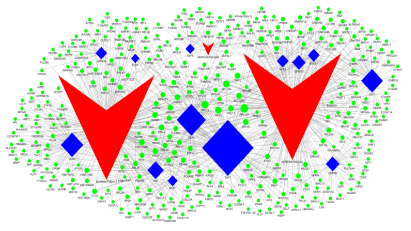
Figure 5. A topographical map of lncRNA, transcriptional factors and target genes. The red arrows represent lncRNA, the blue diamonds represent transcriptional factors, and the lineal lines represent regulating relationships
LncRNA might play a significant and complicated regulating role in gene expression at epigenetic, transcriptional and post-transcriptional levels [18] (2015), exerting important effects upon the onset and development of a great variety of diseases and disorders Zhao et al. [19], Uchida et al. [20], Su et al. [21], potentiating itself to be a new clinical marker and therapeutic target for diagnosis and prognosis. Currently, researches about lncRNA covering a wide range of diseases have been gradually taken off, but not yet in the field of psychiatry [17,22,23]. In our previous study, we found that three lncRNAs, namely NONHSAT089447, NONHSAT021545 and NONHSAT041499, were significantly up-regulated in the peripheral blood mononuclear cells in 5 SZ patients and 5 controls by microarray analysis and PCR verification. In order to further explore the role of lncRNA in the molecular mechanism of SZ, we carried out bioinformatics analysis in this study.
Firstly, we identified the differentially expressed mRNA by microarray analysis, and we further identified the mRNA closely relevant to the differentially expressed lncRNA (NONHSAT089447, NONHSAT021545 and NONHSAT041499) by Pearson association analysis, which numbered in hundred and thousand. This result might suggest that individual lncRNA regulate a multiple target gene, participating a wide range of biological processes. Among them, a total of 89 mRNAs co-expressed with all three aberrant lncRNAs, indicating that they be closely involved into the pathogenesis of SZ.
GO enrichment biological process analysis results demonstrated that mRNA co-expressed with lncRNA implicated a great variety of biological processes, among which there were several ones involving central nervous system, such as neuronal apoptosis and regulation, Ras signaling transduction, lipopolysaccharide reaction, JNK signaling pathway and regulation, stress-related protein kinase signaling pathway and regulation, learning and memory, regulation of synaptic structure and activity, the formation, development, cortical layering, axongensis of neural projection, and so on. These nervous biological processes in turn implicate multiple mechanism of SZ Glantz et al. [24], Stornetta et al. [25], Wischhof et al. [26], possibly in a way regulating multiple downstream gene expression, causing physiopathological changes leading to pathogenesis of SZ.
KEGG signaling pathway enrichment analysis results showed significant enrichment in ribosome pathway, lysosome pathway, Lou Gehrig's disease pathway, glucolysis/gluconeogenesis, GnRH signaling pathway, hemotopoietic cell system, white blood cell subcutaneous migration pathway, mTOR signaling pathway, insulin signaling pathway and apoptosis pathway. Among them, the mTOR signaling pathway and insulin signaling pathway demonstrated close involvement with the pathogenesis of SZ. One study indicated that mTOR could suppress the expression of DPYSL2, which in turn increases the risk of SZ [17]. Another study showed that elevated activity of mTOR could ameliorate or improve the cognitive disorder of SZ animal model [27]. A systematic review by Guruajan et al. elaborated on the close relationship between mTOR signaling pathway and SZ pathogenesis [28]. On the other hand, the insulin signaling pathway may play a significant role in the brain development and function. Impaired insulin pathway could be observed in SZ patients, and antipsychotics could restore this pathway [29].
Transcription factors are protein molecules with special structure and gene regulation function. They specifically and exclusively bind with certain up-stream sequence at 5’ end of target gene, thus guaranteeing that the target gene expression maintains a certain intensity at a certain time and site. We used graph theory to evaluate the contribution of lncRNA and relevant transcription factors to the interaction map with node frequency, which represented the interaction frequency. A higher node frequency indicates a bigger coverage of biological factors, and the highest node frequency may be the key lncRNA, transcription factor or target gene that exerts the key regulating effect. In Table 3, the node frequencies of NONHSAT021545 and NONHSAT089447 were 254 and 249 respectively, much higher than that of NONHSAT041499, which was 26, suggesting that the first two lncRNAs regulate much more target genes than the third one, thus probably exerting more important biological effects. Of the transcription factors, TAF1, EBF1 and USF1 had the highest node frequency, which were 130, 71 and 51 respectively. Among them, TAF1 Hansen et al. [30] and EBF1 Jajodia et al. [31] have been reported to be closely associated with SZ. Target genes with node frequency higher than 8 included RPL13A, RPL12, RPL10A, RPS2, CASC4, HIST1H4E, PTMA, RPL17, RPL26, RPL3, RPS18, SH2B3, SLC15A4, TPP1 and TRAPPC2L, suggesting these genes might play an important role in the pathomechanism of SZ, which warrants further investigation.
Bioinformatics methodology made functional annotation for lncRNA, facilitating efficiently the identification of target genes and signaling pathways from huge amount of microarray analysis results. In this study, we analyzed three lncRNA (NONHSAT089447, NONHSAT021545 and NONHSAT041499) and their co-expressed mRNAs, and found these mRNA-involved GO biological processes and KEGG signaling pathways and made predictions about the transcription factors and target genes implicating these lncRNAs. We will explore further into these data, in a bigger effort to the role of these lncRNA in the pathomechanism of SZ.


