Background: Beauty of the face agree to geometric figures that have got magnitudes of the gold mask. The resilience is a psychic function to protect against psychological distress.
Purpose: Aging and beauty over time change the self-image and its acceptance depends on level of resiliency. We studied the resilience in subjects with different beauty and age on the face and looked for its mechanism psychodynamics.
Methods: Eight groups (each 40♀, 40♂) were selected with two different range degrees of beauty (1-2 B beauty, 3-4 U ugliness) and skin aging (0-1 Y young aged 20-30 average 24.65 SD 3.08, 2-3 M mature aged 45-55 average 49.85 SD 3.39). YB were control groups. Beauty by golden mask, resilience by CD-RISK, skin aging by Glogau classification and ultrasound test, personality by MMPI-2 and one interview were defined. F, t, W and P tests were assessed in subjects-controls analysis by 14 Windows SPSS and p < 0.05 alpha level.
Results: Factors show higher resilience value in U and M groups than in B and Y, lower values in females than in men considering the individual groups BY, BM, UY, UM. F and t tests show high correlation and significance (0.0006 < p < 0.09).
Discussion: The lack of beauty and aging produce stressful conditions, traumatic lacerations. The aid application for the discomfort requires an adaptive response. The resilience is the dynamic mechanism of previous response that he subject, through a personal journey, learn to build. The resilience increases in mature age due to the acquisition of a greater experiential baggage and in ugly subjects by the continuous acceptance of their poor aesthetic.
Conclusions: Resilience grows after repeated discomfort as ugly and in progressively and continuous way, while it is low after an acute perception of physical or psychical damage as a wrinkle. A short-term psychotherapy could help subjects to accept aesthetic discomfort.
Background
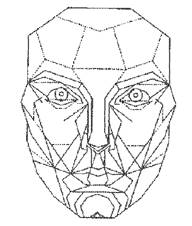
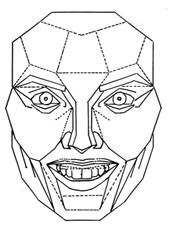
Beauty is a pleasant emotional content. The subject acquires it through senses compare it with a reference inner model acquired by educational process and social custom and he, finally, fix it and compare to concepts and objects, during his experimentation in living and after a quick comparison with a. The objective beauty must be distinguished from the subjective beauty. The last depends on self-aesthetic sense, while the former derives from harmonic properties of the object that induces attraction, affection, pleasure [1,2] in the observer. Harmonic ideal properties of beauty have been identified, throughout the history of aesthetic economic, with geometric figures that have got magnitudes of the golden section. This is defined by the mathematical ratio as described in table 1 and it is present in many works of art. The gold mask or ideal facial proportions are the application of the previous section to skin areas of the face (Table 1) [2–4]. The resilience is a psychic function, it includes: instinctive (survival needs), emotional (mechanisms of social relations), and cognitive (the employment of rational strategies or coping and behavioural techniques as response to stressors) factors [5–7]. It protects against psychological distress or psychophysical traumas of our lives and it increases its factors from living experiences [8].
A face more shows a pleasing aesthetic, more it corresponds to golden mask’s proportions
Purpose
Age and beauty are physiological bodily aspects. They appear or evolve with visible signs on facial skin over time. These can change the physical image of the self, its perception and the acceptance of this new perception. The intensity of this acceptance depends on the level of resiliency acquired. So, we studied the resilience in subjects with different beauty and age and looked for its mechanism psychodynamics.
Patients
The sample, with higher education (and informed consent), was enrolled among frequenters of penitentiary and university departments (see title). It includes eight groups, each of 40 females and 40 males, and was selected with two different degrees of beauty, named beauty (B) and ugliness (U), and skin aging, named young (Y) and mature (M), on the face, according to clinical background (Tables 1 and 2). Y groups were 20-30 years old (average 24.65, SD 3.0826) while M groups were 45-55 years old (average 49.85, SD 3.3915). Skin aging was 0-1 grade in Y and 2-3 in M groups, while face’s beauty was 1-2 grade in B and 3-4 in U groups (Table 2). YB groups were selected as control groups with a ratio of recruitment 1:3 (Table 3).
Table 2a: Assessment of tests
Skin aging on the face: correlation between Glogau signs and ultrasound findings |
Stage |
Glogau classification |
echogenicity |
thickness in mm |
|
|
D |
H |
D |
H |
0 |
no signs |
N |
N |
2,5±0,5 |
2,0±0,5 |
I Mild |
mild pigment changes, minimal wrinkles |
↑ |
N |
2,0±0,5 |
2,0±1,5 |
II Moderate |
early brown spots visible, palpable keratosis
parallel smile lines, wrinkles in motion |
↑↓ |
N |
1,5±0,5 |
2,0±0,5 |
III
Advanced |
obvious discolorations, visible keratosis
visible telangiectasias, wrinkles at rest |
↓ |
↓ |
1,0±0,5 |
1,5±0,5 |
IV
Severe |
yellow-gray skin color
prior skin malignancies, only wrinkles |
↓↓ |
↓↓ |
1,0±0,5 |
1,0±0,5 |
D dermis, H Hypodermis, N normal, ↑ increase, ↓ reduction
Table 2b: Likert Scale
Likert scale |
very low |
low |
medium |
high |
very high |
stages of the golden mask |
1 |
2 |
3 |
4 |
5 |
clinical degrees of skin aging |
0 |
1 |
2 |
3 |
4 |
CD-RISC
Factors |
Hardness |
0-6 |
06-12 |
12-16 |
17-23 |
23-28 |
Optimism |
0-6 |
06-12 |
12-16 |
17-23 |
23-28 |
Resource – Fullness |
0-4 |
04-08 |
10-12-14 |
14-19 |
19-24 |
Purpose |
0-4 |
04-08 |
08-12 |
12-16 |
16-20 |
total score |
0-20 |
20-40 |
40-60 |
60-80 |
80-100 |
Table 3a. Results of 4 factors of the CD-RISC scale
Groups |
Hardness |
Optimism |
Resource-Fullness |
Purpose |
|
average |
DS |
average |
DS |
average |
DS |
Average |
DS |
BY ♀ |
06.05 |
00.60 |
05.95 |
00.60 |
05.10 |
00.55 |
03.35 |
00.58 |
BY ♂ |
08.90 |
00.64 |
08.85 |
00.58 |
07.35 |
00.58 |
05.15 |
00.67 |
BM ♀ |
16.15 |
00.67 |
15.95 |
00.60 |
13.30 |
00.65 |
10.40 |
00.50 |
BM ♂ |
20.50 |
00.60 |
20.35 |
00.48 |
16.40 |
00.50 |
14.50 |
00.51 |
UY ♀ |
10.60 |
00.50 |
10.35 |
00.48 |
08.40 |
00.50 |
07.45 |
00.51 |
UY ♂ |
12.55 |
00.51 |
12.30 |
00.47 |
09.40 |
00.50 |
07.35 |
00.48 |
UM ♀ |
23.45 |
00.51 |
23.20 |
00.41 |
19.45 |
00.51 |
15.50 |
00.51 |
UM ♂ |
24.65 |
00.48 |
24.35 |
00.48 |
19.60 |
00.50 |
17.60 |
00.50 |
B beautiful, U ugly, Y young, M mature, ♀ female, ♂ male
Table 3b. Statistical analysis
Groups |
t Student test |
F Fisher test |
W Wilcoxon |
n° |
correlation |
value |
p |
value |
p |
value |
p |
01 |
♀ BY-BM |
11.96 |
0.0012 |
35.29 |
0.0012 |
02.16 |
0.0303 |
02 |
♀ BY-UY |
14.66 |
0.0006 |
17.17 |
0.0063 |
01.64 |
0.1003 |
03 |
♀ BY-UM |
12.13 |
0.0012 |
59.99 |
0.0003 |
01.64 |
0.1003 |
04 |
♂ BY-BM |
15.22 |
0.0006 |
36.00 |
0.0012 |
01.64 |
0.1003 |
05 |
♂ BY-UY |
06.84 |
0.0063 |
03.46 |
0.1098 |
01.64 |
0.1003 |
06 |
♂ BY-UM |
14.75 |
0.0006 |
50.85 |
0.0005 |
01.64 |
0.1003 |
07 |
♀- ♂ BY |
09.34 |
0.0026 |
05.14 |
0.0625 |
01.64 |
0.1003 |
08 |
♀- ♂ BM |
13.15 |
0.0009 |
03.93 |
0.0926 |
01.64 |
0.1003 |
09 |
♀- ♂ UY |
02.46 |
0.0908 |
00.67 |
0.4461 |
01.27 |
0.2012 |
10 |
♀- ♂ UM |
02.88 |
0.0632 |
00.20 |
0.6702 |
01.64 |
0.1003 |
Exclusion criteria were dermatological or systemic disease(s), use to smock, alcohol and factors causing, according to DSM-IV, the diagnosis of personality disturb, Post Traumatic Stress Disorder and/or Avoiding and/or Passive-Aggressive Personality, family or occupational distress.
Instruments
Connor-Davidson Resilience Scale (CR-RISC) measures the ability to cope with stress and adversity in healthy or pathological population, in anxiety and depression’ management, it is indicated in the clinical setting and it is subsequent to the introduction of the DSM diagnostic criteria [9,10]. CD-RISC scale, in individual way, studies 4 factors (Khoshouei’s exploratory factor analysis: harness, optimism, resource fullness, purpose) and it is a 25-item scale with 5 respondent rate items (Likert scale) from 0 (‘‘not true at all’’) to 4 (‘‘true nearly all the time’’). So, range is 0-100 and high score lead to high resilience (Table 2). Resilience Scale has got: alpha reliability .69–.80 ranged (xx) and alpha Cronbach .82–.93 ranged, it is positively correlated with hardness (Kobasa’s r = 0.83 and p < .001), social support (Sheehan Social Support Scale’s r = 0.36, p < .001), self-esteem, life-satisfaction and negatively with perceived stress (Perceived Stress Scale’s r = -0.76, p < .001) and vulnerability (Sheehan Stress Vunnerability Scale’s r = - 0.32, p < .001) [11,12].
Glogau classification by clinical signs describes the skin aging in 5 stages (Table 2), while findings of the ultrasound test measure the skin aging by the increase or the reduction in echogenicity (qualitative sign) and thickness (quantitative sign) of the dermis and hypodermis [13–15] (Table 2).
Procedure
Face’s beauty by Golden mask, resilience by CD-RISK, face’s skin aging by Glogau classification and ultrasound test, personality disturb by Minnesota Multiphasic Personality Inventory 2 (MMPI-2) and interview psychologist-subject were defined. CD-RISC was recorded (the first author reds and the latter administers tests) in the random sample (each patient has 2 sealed envelopes with his encrypted data: the former with B or U and Y or M diagnosis and the latter with results of scale). At the end of the study only one interview of 45m’ in each subject developed the judgment of the scale allowing us to understand the adaptation’s process to the resilience. Results are distributed in 8 groups (BY, BM, UY, UM females and males) (Table 3). The average of 4 resilience factors was calculated in each group to facilitate the statistical correlations.
Statistical analysis
The Statistical Package for Social Sciences software, version 14 for Windows (SPSS, Inc., Chicago, II, USA) in data analysis, the parametric elementary analysis in the evaluation of demographic variables and alpha level of p < 0.05 were employed. Comparison among medium by t (Student) test in independent samples, comparison among variances by the F (Fisher) test with one factor, comparison among medians (to study the demographic origin of the sample) by W (Wilcoxon) test (this one united to t test has got a power - efficiency of 95%) and correlations by P (Pearson) coefficient, were assessed in patients-controls analysis (table 3).
Resilience
No personality disturbance appeared in subjects by MMPI-2 test. Results are described in table 3.
CD-RISC
The factors show higher resilience values in M groups than in Y groups, in U groups then in B groups - lower values in females than in men considering the individual groups BY, BM, UY and UM. The lowest values are in the BY ♀ group and highest in UM ♂ group (Table 3).
Statistical analysis
T and F tests show correlation and significance - high (0.0006 < p < 0.0063) in 1,2,3,4 and 6th groups - sufficient in 7 and 8th groups (0.0026 < p < 0.09) - low in 5,9 and 10th groups (Table 3). The effect size of comparisons registers mild-large values (from 0.30 to > 0.50) in 1,2,3,4 and 6th groups. Comparisons between beauty and ugliness, so as young and old show significant differences for each CD-RISC factor: the ugliness and old record higher scores than beauty and young (Table 3). Also, the actual size of these differences records a large value with index h2 = 1.4 in all factors. W test show the same values (1.64) in 2,3,4,5,6,7,8,10 groups and similar in 1 and 9 groups, but its specificity is low (0.03 < p < 0.20) (Table 3). P test does not show correlation and significance.
2021 Copyright OAT. All rights reserv
Statistical observations
Correlations t and F between Y and M groups of the same sex are significant except the correlation ♂ BY-UY (Table 3). Interviews showed young males are not very sensitive to the model of beauty. There is no correlation t and F between sexes in UY and UM groups due to a too high p value (Table 3). Interviews showed similar values, recorded by the CD-RISC, in the both sexes of the U groups, correspond to overlapping and valid adaptive responses. Values of W and P tests could suggest the independence of each group (Table 3).
Resilience
The "resilient" subject has got an integrated development of instinctive, emotional, affective and cognitive factors and judgment. In the literature, the resilience has been studied in healthy subjects or with various diseases [5,6]. Resilience appears low in acute diseases and high in chronic, where, there is a gradual acquisition of resistance factors. Interviews showed: more a person has skills and functions and less he is exposed to failure (causing frustration and inconvenience) and less he requires protection or resilience and otherwise. The beauty of a body is an important mean of acceptance and relationship. It may satisfy, in an immediate, affective demands and so it stimulates instinctive responses and the search for cognitive ones. An object associated with it needs few defences and so it produces a low resilience. The lack of beauty and, above all, aging produce stressful conditions, traumatic lacerations [16]. The aid application for the discomfort requires an adaptive response. This is into the resulting emotional and cognitive development that enables the psyche to reach a new psychosocial well-being. The resilience is the dynamic mechanism of previous response. The subject, through a personal journey, learn - to build healthy relationships and realistic goals - to do not live crises as insurmountable difficulties - to compensate and to project painful events into the future - to embrace change - to act decisively - to cultivate trust, the spiritual side and rewarding activities [16]. Interview showed resilience is an aspect of character that people can increase. For these reasons, the resilience increases in mature age due to the acquisition of a greater experiential baggage and in ugly subjects by the continuous acceptance of their poor aesthetic. The acquisition and acceptance are cognitive processes that require just the time of aging (age) or the habit to repeated discomfort (ugliness). Resilience is greater in men than in women because in the collective imagination the former is more associated with a model of strength rather than beauty itself.
Conclusions
The aging and beauty - resilience grows after repeated discomfort as ugly and in progressively and continuous way, while it is low after an acute perception of physical or psychical damage as a wrinkle. The habit in the time, in spontaneous way, or a short-term psychotherapy (cognitive or family) could help to overcame distress or traumas and to increase resilience factors.
- Broer PN, Juran S, Liu YJ, Weichman K, Tanna N, et al. (2014) The impact of geographic, ethnic, and demographic dynamics on the perception of beauty. J Craniofac Surg 25: e157-161. [Crossref]
- Harrar H, Myers S, Ghanem AM (2018) Art or Science? An Evidence-Based Approach to Human Facial Beauty a Quantitative Analysis Towards an Informed Clinical Aesthetic Practice. Aesthetic Plast Surg 42: 137-146. [Crossref]
- Hashim PW, Nia JK, Taliercio M, Goldenberg G (2017) Ideals of facial beauty. Cutis 100: 222-224. [Crossref]
- Prokopakis EP, Vlastos IM, Picavet VA, Nolst Trenite G, Thomas R, et al. (2013) The golden ratio in facial symmetry. Rhinology 51: 18-21. [Crossref]
- Haglund ME, Nestadt PS, Cooper NS, Southwick SM, Charney DS (2007) Psycho-biological mechanisms of resilience: Relevance to prevention and treatment of stress-related psychopathology. Dev Psychopathol 19: 889-920. [Crossref]
- Kalisch R, Müller MB, Tüscher O (2015) A conceptual framework for the neurobiological study of resilience. Behav Brain Sci 38: e92. [Crossref]
- Benzies K, Mychasiuk R (2009) Fostering family resiliency: a review of the key protective factors. Child Fam Soc Work 14: 103-114.
- Szwajca K (2014) [Resilience and responses to the experience of trauma--a fascinating but difficult study area]. Psychiatr Pol 48: 563-572. [Crossref]
- Connor KM, Davidson JR (2003) Development of a new resilience scale: The Connor-Davidson Resilience Scale (CD-RISC). Depress Anxiety 18: 76-82. [Crossref]
- Campbell-Sills L, Stein MB (2007) Psychometric Analysis and Refinement of the Connor–Davidson Resilience Scale (CD-RISC): Validation of a 10-Item Measure of Resilience. J Trauma Stress 20: 1019-1028. [Crossref]
- Wagnild GM, Collins JA (2009) Assessing resilience. J Psychosoc Nurs Ment Health Serv 47: 28-33. [Crossref]
- Singh K, Yu X (2010) Psychometric evaluation of the Connor-Davidson Resilience Scale (CD-RISC) in a sample of Indian students. J Psychology 1: 23-30.
- Iurassich S (2007) L’invecchiamento della cute: una stadiazione clinico-ecografica. G Gerontol 55: 218-225.
- Iurassich S, Goione S (2008) La pelle attraverso il sole, il fumo e il tempo. Journal of Plastic Dermatology 4: 191-196.
- Iurassich S, Iannaccone A.M (2009) Stress psicologico e stress fisico nell’invecchiamento della cute. Derm Clin 4: 120-127.
- Iannaccone AM, Iurassich S. Se... la Psiche parla dalla Cute e se... la Cute agisce nella Psiche: osservazioni ed esperienze... Ed.Coperativa Libraria Universitaria, Genova 2011.