Abstract
Background: The aim of this study was to determine the association between chewing difficulty and the health-related quality of life using the EQ-5D index in representative Korean elders.
Materials and Methods: A cross-sectional study was conducted on 3,819 participants ≥ 65 years of age using the 2008-2010 Korea National Health and Nutrition Examination Survey data. The self-reported presence of chewing problems was evaluated using a structured questionnaire. We used the Korean version of the EQ-5D questionnaire to assess the health-related quality of life. The association between chewing difficulty and EQ-5D index was determined using a multivariable linear regression models with adjustment for age, gender, education, income, spouse status, private health insurance, state of dentition, number of teeth, periodontitis, toothbrushing frequency, dental visits, smoking, alcohol consumption, physical activity, stress, depression, body mass index, hypertension, and diabetes mellitus.
Results: The EQ-5D index scores decreased as chewing difficulty worsened. The adjusted EQ-5D index mean scores were lowest in the very poor group compared to the other four groups (ANCOVA, P = 0.001). The chewing difficulty was independently associated with the EQ-5D index scores throughout the adjustment process in the model (β coefficient = -0.040; P = 0.001).
Conclusion: The present study demonstrated that chewing difficulty is associated with the EQ-5D index in Korean elders.
Keywords
chewing difficulty, EQ-5D index, epidemiology, KNHANES, korean elders
Introduction
A deterioration in oral health can lead to poor food selection and nutritional status and result in an increased prevalence of chronic disease and risk of mortality [1]. The gradual decline in chewing ability has been shown to be associated with negative effects, such as physical disability, mental impairment, and mortality [2,3].
Indeed, the elderly population tends to experience a higher frequency of root caries, periodontal disease, and tooth loss [4]. The prevalence of chewing difficulty has increased in Korean elders. The Fourth Korean National Health and Nutrition Examination Survey (KNHANES) reported that the prevalence of chewing difficulty is 58.0% among elderly Korean participants [5]. According to the Korean Health Plan 2020, chewing difficulty is expected to be a significant public health problem [6].
Oral health is considered a fundamental and integral part of general health status. Consequently, oral health problems affect general health and health-related quality of life (HRQoL). In dentistry, measurement instruments which assess the oral health-related quality of life (OHRQoL) have been developed and used for assessing treatment needs, making clinical decisions, and evaluating interventions services and programs [7]. Many researchers have studied the relationship between OHRQoL and oral health status, oral health behaviors, dental treatment needs in the general population, and patients with specific disease or disorders [8,9]. Measuring the impact of oral health on the HRQoL has lagged behind in dentistry.
Instruments to assess HRQoL include the Health Utility Index (HUI), the 36-item Short Form Health Survey (SF-36), the Quality of Well-Being (QWB) Scale, the Short-Form-6 Dimension (SF-6D), and the EuroQoL-5 Dimension (EQ-5D). The EQ-5D index is the most widely used instrument to HRQoL in many countries [10,11]. Most studies have reported a relationship between general chronic conditions and the EQ-5D index [11,12]. To date, a few studies have reported an association between oral health status and the EQ-5D index [13,14]. Although there is only one existing study involving the association between chewing difficulty and the HRQoL using the EQ-5D index in Koreans, the study did not assess general health status variables that are closely related to the HRQoL [14].
It is hypothesized that chewing difficulty is associated with the EQ-5D index in the general population. Due to insufficient evidence in support of an association between chewing difficulty and the EQ-5D index in Koreans, we evaluated this possible association in the KNHANES data from 2008-2010.
The aim of this study was to determine the association between chewing difficulty and the HRQoL using the EQ-5D index in representative Korean elders. Our findings will provide a better understanding for planning and implementing health promotion and policies within the scope of medicine and dentistry.
Methods
Study design and subjects
Data were acquired from a subset of the KNHANES, which was carried out from 2008-2010. The KNHANES is a cross-sectional and nationally-representative survey based on stratified, multi-stage probability samples of Korean households representing the non-institutionalized civilian population by the Korea Ministry of Health and Welfare. The KNHANES consists of a health interview questionnaire, health examination, and nutrition survey. Written informed consent was obtained from participants in the KNHANES. A total of 29,235 subjects participated in the KNHANES. We included participants > 65 years of age (n=5,044). Among the participants, we excluded participants with missing values in the oral and health examinations and health interview questionnaire (n=1,225). The final sample was comprised of 3,819 participants.
Assessment of chewing difficulty
The subjects were interviewed using a structured questionnaire by trained staff members. The self-reported presence of chewing problems was confirmed with an oral health examination.
The question was worded as follows: “Do you have difficulties or discomfort with chewing food due to intra-oral problems, including teeth, dentures, or gums? (If you use dentures, please describe your experience with respect to wearing dentures.)” The questions used a 5-point rating scale and the responses were as follows: ‘very much’ (code=1); ‘quite a lot’ (code=2); ‘fair’ (code=3); ‘very little’ (code=4); and ‘not at all’ (code=5). For the analysis, chewing difficulty was dichotomized into no problems (very little or not at all) and a problem exists (very much, quite a lot, or fair).
Assessment of HRQoL using the EQ-5D index
The EuroQoL five-dimension (EQ-5D) index is a generic, preference-based measure of health status developed by the EuroQol Group [15]. The EQ-5D index is one of the most widely used instruments for assessing quality of life, and has been validated in both the general population and patient studies [16].
We used the Korean version of the EQ-5D questionnaire to assess the HRQoL [17]. The EQ-5D index is a descriptive system with five domains, including mobility, self-care, usual activities, pain/discomfort, and anxiety/depression [18]. The participants responded to his/her health state for each domain by selecting the most appropriate answer. The response options were “No problems,” “Some problems,” and “Severe problems.” An individual’s EQ-5D health status is shown as a five-digit health profile by combining the standards from each of the five domain levels [18]. These define a 243 unique health status. A single index score can be displayed for each health state by applying preference weights. The EQ-5D unique preference weights were generated using the time trade-off method in the Korean general population [18]. The EQ-5D scores are calculated depending on the responses to the 5-item questionnaire. The score ranges from 0-1, with 0 indicating the worst health state equivalent to death and 1 representing the optimal health state. A higher EQ-5D index is consistent with a better HRQoL.
Assessment of potential confounders
The confounders in this study were demographic factors (age and gender), socio-economic factors (income, education, spouse status, and private health insurance), oral health status, behaviors (state of dentition, number of teeth, periodontitis, toothbrushing frequency, and dental visits), health behaviors (smoking, alcohol consumption, and physical activity), and general health status (stress, depression, body mass index [BMI), hypertension, and diabetes).
Monthly household income was the monthly average family income, categorized into quartiles. The educational level was categorized into the following four groups: less than primary school; middle school; high school; and beyond college. Spouse status was categorized into two groups (yes and no [died or divorced]). Questions on private health insurance coverage were categorized into two groups (yes and no). The status of upper and lower jaw dentition was classified into the following three categories: natural dentition; removable dentures (RPDs); and complete dentures (CDs). Oral health status was evaluated based on the oral health examination by trained dentists. The Community Periodontal Index of Treatment Needs (CPITN) was measured using a community periodontal index (CPI) probe that met WHO guidelines [19]. The CPI was scored from 0-4, as follows: 0 (healthy); 1 (bleeding following probing); 2 (presence of dental calculus); 3 (probing pocket depth 4 and 5 mm); and 4 (probing pocket depth ≥ 6 mm) [19]. Periodontal status was dichotomized into two groups (no [CPI score = 0–2] and yes [CPI score = 3–4]). Periodontitis was defined as a CPI ‘code 3’ or greater. The existing number of teeth was defined as healthy teeth, carious teeth, or treated teeth with the exception of the third molars, categorized into the following 3 groups: 0-9; 1019; and 20-28. Daily toothbrushing frequency was dichotomized into two groups (< 2 times/day and ≥ 2 times/day). Questions regarding dental clinic visits during the past year and answers were dichotomized into two groups (yes and no).
Smoking status was assessed by questioning the participants about current smoking status. The responses were classified as never/former smoker and current smoker.
The frequency of alcohol consumption was assessed by questioning the participants about the average alcohol consumption frequency (days per month or week). The response options were categorized into the following 5 groups: non-drinker (≤ 1 day/month); almost non-drinker (≤ 1 day/month); light drinker (2–4 days/month); moderate drinker (2–3 days/week); and heavy drinker (≥ 4 days/week). Further, we grouped the answers regarding alcohol consumption into two categories (non-drinker/almost non-drinker/light drinker and moderate/heavy drinker). Physical activity was defined as the frequency of regular exercise, such as vigorous, moderate, and walking activity. Those participants who performed vigorous physical activity for at least 20 min/day on 3 days/week, and/or moderate physical activity for at least 30 min/day on 5 days/week, and/or walking activity for 30 min/day on 5 days/week were defined as the regular physical activity group.
To assess perceived stress in daily life, the subjects were classified into two groups (yes and no). Those participants who were diagnosed with depression by medical doctors were defined as the depression group. The BMI was calculated by dividing the weight in kilograms by the square of the height in meters [20]. Hypertension was defined as having an average SBP > 140 mmHg or a DBP > 90 mmHg or prescribed an anti-hypertensive medication [21]. Diabetes mellitus was defined as a fasting plasma glucose (FPG) > 126 mg/dl or prescribed a diabetic medication [22].
Statistical analyses
The complex sampling design was applied to analyze the national data.
The distribution of the EQ-5D index (outcome variable) according to chewing difficulty (main explanatory variable) and confounders were expressed as the mean and standard error (SE). Independent t-tests and analysis of variance (ANOVA) were applied to assess the associations of covariates with the EQ-5D index. To assess differences in the distribution of the adjusted EQ-5D index mean scores according to the extension of chewing difficulty, analysis of covariance (ANCOVA) were used. The extension of chewing difficulty was categorized into five groups in all participants. For evaluating the main association, the adjusted relationship between the chewing difficulty and the EQ-5D index was determined using multivariable linear regression models that were adjusted for possible confounders. Model 1 was adjusted for demographic and socio-economic factors, such as age group, gender, income, educational, spouse status, and private health insurance. Model 2 was adjusted for demographic and socio-economic factors, and oral health status and behavior variables, such as the state of dentition, number of teeth, periodontitis, toothbrushing frequency, and dental visits. Model 3 was additionally adjusted for health behaviors, such as smoking, alcohol consumption, and physical activity. Model 4 was constructed by adding additional general health status variables, such as stress, depression, BMI, hypertension, and diabetes.
Results
Table 1 demonstrates the distribution of the EQ-5D index levels according to confounder and main explanatory variables. Based on univariate analysis, the EQ-5D index scores were lower in participants with the following characteristics: 65-74 year old age; females; lower income; lower education; no spouse; and no private health insurance (P < 0.001 for all comparison). Elders with > 20 teeth (p < 0.001) and natural dentition had the highest EQ-5D index scores Elders with natural dentition (P = 0.009) had the highest EQ-5D index scores The EQ-5D index scores according to the periodontitis was not significantly different (P = 0.496). The EQ-5D index scores were lower in elders who brushed their teeth less often (P = 0.002) and who did not regularly visit the dentist (P = 0.001). The EQ-5D index scores were higher in current smokers, alcohol consumers, and those who engaged in regular physical activity (P < 0.001) and lower in those with increased stress, depression, obesity, and hypertension (P < 0.001 for all comparison). There were also significant differences in the EQ-5D index scores with respect to diabetes (P = 0.002). Elders who reported chewing difficulty had significantly lower EQ-5D index scores than elders who reported no discomfort in chewing (P < 0.001).
Table 1. Distribution of EQ-5D Index levels according to confounder and main explanatory variables (N=3,819)
Characteristics |
Category |
EQ-5D |
|
|
n |
Mean‡ (SE) |
P |
Age group |
65-74 |
2642 |
0.87 (0.004) |
<0.001* |
| |
75-93 |
1177 |
0.79 (0.008) |
|
Sex |
Male |
1646 |
0.89 (0.005) |
<0.001* |
| |
Female |
2173 |
0.81 (0.005) |
|
Household income |
Ⅰ(lowest) |
925 |
0.82 (0.010) |
<0.001† |
| |
Ⅱ |
964 |
0.83 (0.007) |
|
| |
Ⅲ |
952 |
0.84 (0.007) |
|
| |
Ⅳ (highest) |
978 |
0.89 (0.005) |
|
Education level |
Primary school |
2687 |
0.82 (0.005) |
<0.001† |
| |
Middle school |
450 |
0.90 (0.007) |
|
| |
High school |
436 |
0.91 (0.007) |
|
| |
College |
246 |
0.94 (0.009) |
|
Spouse status |
Yes |
2617 |
0.87 (0.004) |
<0.001* |
| |
No |
1202 |
0.80 (0.007) |
|
Private Health Insurance |
No |
2817 |
0.83 (0.005) |
<0.001* |
| |
Yes |
1002 |
0.89 (0.005) |
|
State of dentition |
Dentate |
2275 |
0.86 (0.005) |
0.009 † |
| |
RPD |
1036 |
0.83 (0.008) |
|
| |
CD |
508 |
0.83 (0.011) |
|
Number of teeth |
0 to 9 |
735 |
0.81 (0.011) |
<0.001† |
| |
10 to 19 |
1103 |
0.83 (0.008) |
|
| |
20 to 28 |
1981 |
0.87 (0.004) |
|
CPI (Community Periodontal Index) |
No |
2028 |
0.84 (0.006) |
0.496* |
| |
Yes |
1791 |
0.85 (0.005) |
|
Daily toothbrushing frequency |
<2 |
979 |
0.83 (0.007) |
0.002* |
| |
≥2 |
2840 |
0.85 (0.004) |
|
Dental visits |
No |
3113 |
0.84 (0.004) |
0.001* |
| |
Yes |
706 |
0.87 (0.008) |
|
Smoking |
No |
2578 |
0.83 (0.005) |
<0.001* |
| |
Yes |
1241 |
0.88 (0.006) |
|
Drinking |
No |
2708 |
0.83 (0.005) |
<0.001* |
| |
Yes |
1111 |
0.89 (0.006) |
|
Regular physical activity |
No |
1691 |
0.82 (0.007) |
<0.001* |
| |
Yes |
2128 |
0.87 (0.004) |
|
Stress |
No |
2959 |
0.87 (0.004) |
<0.001* |
| |
Yes |
860 |
0.76 (0.010) |
|
Depression |
No |
3618 |
0.85 (0.004) |
<0.001* |
| |
Yes |
201 |
0.78 (0.015) |
|
BMI (Body Mass Index) |
<25 |
2525 |
0.86 (0.005) |
<0.001* |
| |
≥25 |
1294 |
0.83 (0.006) |
|
Hypertension |
No |
1782 |
0.86 (0.005) |
<0.001* |
| |
Yes |
2037 |
0.83 (0.006) |
|
Diabetes |
No |
3142 |
0.85 (0.004) |
0.002* |
| |
Yes |
677 |
0.82 (0.010) |
|
Chewing difficulty |
No |
1328 |
0.89 (0.005) |
<0.001* |
|
Yes |
2491 |
0.82 (0.005) |
|
* Obtained from independent t-test.
† Obtained from ANOVA.
‡ Weighted mean (standard error) was calculated based on the complex sample design and weights.
The adjusted EQ-5D index scores according to the extension of chewing difficulty are shown in Figure 1. The mean ± SE scores were 0.79±0.008 for the very poor group, 0.84 ± 0.006 for the poor group, 0.87±0.008 for the fair group, 0.87 ± 0.007 for the good group, and 0.88 ± 0.008 for the very good group. The EQ-5D index scores decreased as chewing difficulty worsened. The adjusted EQ-5D index mean scores were lowest in the very poor group compared to the other four groups (ANCOVA, P = 0.001).
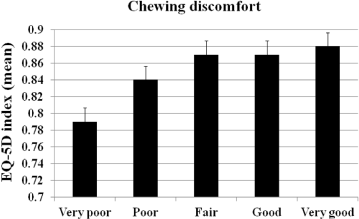
Figure 1. Adjusted EQ-5D index scores according to the chewing difficulty and EQ-5D index (n=3,819).Box and whisker plots denote the mean and standard error. All values of EQ-5D index were obtained from ANCOVA adjusted for age, sex, education level, income, spouse status,private health insurance, state of dentition, number of teeth, CPI, daily toothbrushing frequency, dental visits, smoking, drinking, regular physical activity, stress, depression,BMI, hypertension, and diabetes mellitus.
Based on the linear regression models, the chewing difficulty was independently associated with the EQ-5D index scores after adjusting for various confounders (Table 2). Although the beta coefficient of chewing difficulty decreased slightly from -0.047 to -0.040 throughout the sequential adjustment process, the association remained significant (P = 0.001).
Table 2. Linear relationship between the chewing difficulty and EQ-5D index (n=3,819)
| |
Model 1 |
Model 2 |
Model 3 |
Model 4 |
variables |
β |
SE |
P |
β |
SE |
P |
β |
SE |
P |
β |
SE |
P |
Chewing difficulty |
-0.047 |
0.007 |
<0.001 |
-0.046 |
0.007 |
<0.001 |
-0.045 |
0.007 |
<0.001 |
-0.040 |
0.007 |
<0.001 |
Age group |
-0.007 |
0.001 |
<0.001 |
-0.007 |
0.001 |
<0.001 |
-0.006 |
0.001 |
<0.001 |
-0.007 |
0.001 |
<0.001 |
Sex |
-0.059 |
0.007 |
<0.001 |
-0.062 |
0.008 |
<0.001 |
-0.052 |
0.011 |
<0.001 |
-0.032 |
0.011 |
0.004 |
Income |
0.014 |
0.003 |
<0.001 |
0.014 |
0.003 |
<0.001 |
0.013 |
0.003 |
<0.001 |
0.012 |
0.003 |
<0.001 |
Education level |
0.022 |
0.003 |
<0.001 |
0.020 |
0.003 |
<0.001 |
0.020 |
0.003 |
<0.001 |
0.019 |
0.003 |
<0.001 |
Spouse status |
-0.002 |
0.008 |
0.802 |
-0.002 |
0.008 |
0.799 |
-0.002 |
0.006 |
0.769 |
0.000 |
0.008 |
0.976 |
Private health insurance |
-0.012 |
0.006 |
0.062 |
-0.011 |
0.006 |
0.086 |
-0.010 |
0.006 |
0.101 |
-0.006 |
0.003 |
0.364 |
State of dentition |
|
|
0.015 |
0.015 |
0.009 |
0.080 |
0.015 |
0.009 |
0.078 |
0.016 |
0.008 |
0.053 |
Number of teeth |
|
|
|
0.003 |
0.007 |
0.051 |
0.017 |
0.008 |
0.048 |
0.018 |
0.008 |
0.021 |
CPI |
|
|
|
0.003 |
0.007 |
0.633 |
0.003 |
0.007 |
0.672 |
0.005 |
0.007 |
0.404 |
Daily toothbrushing frequency |
|
|
0.015 |
0.008 |
0.060 |
0.013 |
0.008 |
0.099 |
0.013 |
0.007 |
0.070 |
Dental visits |
|
|
|
0.004 |
0.008 |
0.602 |
0.004 |
0.008 |
0.639 |
0.005 |
0.008 |
0.550 |
Smoking |
|
|
|
|
|
|
0.002 |
0.010 |
0.870 |
0.004 |
0.010 |
0.720 |
Drinking |
|
|
|
|
|
|
0.014 |
0.007 |
0.061 |
0.013 |
0.007 |
0.074 |
Regular physical activity |
|
|
|
|
|
|
0.028 |
0.007 |
<0.001 |
0.024 |
0.007 |
<0.001 |
Stress |
|
|
|
|
|
|
|
|
|
-0.084 |
0.010 |
<0.001 |
Depression |
|
|
|
|
|
|
|
|
|
-0.042 |
0.015 |
0.005 |
BMI |
|
|
|
|
|
|
|
|
|
-0.022 |
0.006 |
<0.001 |
Hyptertension |
|
|
|
|
|
|
|
|
|
-0.020 |
0.007 |
0.003 |
Diabetes mellitus |
|
|
|
|
|
|
|
|
|
-0.025 |
0.010 |
0.011 |
Adjusted R2 |
0.149 |
0.153 |
0.159 |
0.206 |
Model 1: Unadjusted association.
Model 2: adjusted for demographic, socio-economic factors including age group, gender, monthly Household income, education.
Model 3: Model 2 and oral health status and behaviors including existing number of teeth, DMFT, periodontitis, state of dentition. toothbrushing frequencies, Dental visit
Model 4: Model 3 and general health status and behaviors including smoking, drinking, hypertension, diabetes mellitus.
Bold denotes statistical significance at P<0.05.
Discussion
The objectives of this research were to determine the association between chewing difficulty and the quality of life using the EQ-5D index. Our study demonstrated an association between chewing difficulty and HRQoL in a large nationwide elderly population, and the association was independently significant, even after controlling for confounders, including, age, gender, education level, income, spouse status, private health insurance, state of dentition, number of teeth, periodontitis, toothbrushing frequency, dental visits, smoking cigarettes, alcohol consumption, regular physical activity, stress, depression, BMI, hypertension, and diabetes mellitus.
The EQ-5D index scores were lower in elders, females, those with a lower income, and those with lower education, which is in agreement with a previous study [23]. Although the EQ-5D index scores were significantly higher in smokers and alcohol consumers, there is no consensus regarding this finding [12,24]. The EQ-5D index scores were lower in the participants with the following characteristics, which is consistent with previous evidence:13,14 irregular physical activity; exercise regularly; increased stress; increased depression; obesity; hypertension; and diabetes.,
Recently, there have been a few reports on the association between oral health status and QoL. Hugo et al. [25] demonstrated that dissatisfaction on chewing ability among elderly is independently associated with the WHO Quality of Life Questionnaire-Brief (WHOQOL-BREF). Brennan, et al. [26] reported that oral health is associated with lower general health status in older adults using the EQ-5D index. Kimura, et al. [5,27] assessed the quantitative QoL using a visual analog scale and presented the distribution of QoL according to the chewing ability in community-dwelling older people. Takata, et al. [27] evaluated the brief QoL questionnaire, including physical condition, mood, satisfaction with daily life, social interaction, and face-scale score. The results of these studies are consistent with the findings of this study that linked oral health deterioration to poorer QOL. In contrast, Fontanive, et al. [28] showed that clinical oral health variables, such as dental caries and use and need of prosthesis were not associated with general QoL in southern Brazil. Sim [29] showed that periodontitis was not associated with the EQ-5D index among Korean adults. It is difficult to compare other results because no reports have studied the relationship between chewing difficulty and the EQ-5D index.
Although previous studies showed an association between chewing ability and QoL, such a link is not fully understood. Therefore, we conducted this study to provide additional evidence of an association between chewing difficulty and QoL measured by the EQ-5D index among elderly population [13,14].
Although our study was assessed on a self-rated questionnaire, subjective chewing difficulty is a very important indicator. Ohara, et al. [30] asserted that chewing problems are a stronger factor associated with poor self-rated oral health compared with other oral complaints. Subjective oral health status is convenient as an instrument of oral health and perceptions of overall general health [31]. As chewing ability affects self-rated ability to chew various foods, chewing ability may be more highly related to the comprehensive satisfaction with everyday life, social interactive communication, and quality of life measures than objective measurement, such as the number of teeth [27]. Specifically, oral health problems among elders can result in pain and discomfort and can affect problems in eating, communication, and appearance, and consequently lead to awkwardness, social problems, and low self-esteem32. Self-reported chewing difficulty is especially related to quality of life among elders. Therefore, chewing difficult should be taken into account with respect to assessing the health status of an older population. Therefore, the data suggest that health professionals in dentistry and medicine should not overlook the link between chewing difficulty and QoL.
The major strengths of this study included several factors. This report was a study to identify the effects of chewing difficulty and the EQ-5D index scores with adjustment for all potential confounders. A previous study did not adjust well-known confounders of HRQoL in Korean elderly [14]. The results were obtained from a large general Korean population sample. The oral examination and general health status measurements were conducted by dentists and calibrated examiners. Thus, we produced more reliable information regarding oral and general health status. Finally, various confounders, such as demographic factors, socio-economic factors, oral health status and behavior factors, and general health status and behavior factors, were included.
There was a limitation to this study. Because this study had a cross-sectional design, it is difficult to determine the causality of the relationship between chewing difficulty and the EQ-5D index. Further longitudinal studies are needed to determine the causal relationship. Notwithstanding some limitations, the present study demonstrated that chewing difficulty is associated with the EQ-5D index in Korean elders.
Acknowledgments
The author reports no conflict of interest related to this study. This work was not supported by any source of funding.
References
- Ansai T, Takata Y, Soh I, Yoshida A, Hamasaki T, et al. (2008) Association of chewing ability with cardiovascular disease mortality in the 80-year-old Japanese population. Eur J Cardiovasc Prev Rehabil 15: 104-106. [Crossref]
- Shimazaki Y, Soh I, Saito T, Yamashita T, Koga T, et al. (2001) Influence of dentition status on physical disability, mental impairment, and mortality in institutionalized elderly people. J Dent Res 80: 340-345. [Crossref]
- Kimura Y, Ogawa H, Yoshihara A, Yamaga T, Takiguchi T, et al. (2013) Evaluation of chewing ability and its relationship with activities of daily living, depression, cognitive status and food intake in the community-dwelling elderly. Geriatr Gerontol Int 13:718-725. [Crossref]
- Petersen PE, Yamamoto T (2005) Improving the oral health of older people: the approach of the WHO Global Oral Health Programme. Community Dent Oral Epidemiol 33: 81-92. [crossref]
- Korea Center for Disease Control and Prevention. Korean National Health and Nutirion Examination Survey 2007-2009. Osong: Ministry of Health and Welfare.
- Korea Center for Disease Control and Prevention. The third health plan (2011-2020) in Korea. Ministry of Health and Welfare.
- Slade GD, Spencer AJ (1994) Development and evaluation of the Oral Health Impact Profile. Community Dent Health 11: 3-11. [Crossref]
- Carlsson V, Hakeberg M, Wide Boman U (2015) Associations between dental anxiety, sense of coherence, oral health-related quality of life and health behavior--a national Swedish cross-sectional survey. BMC Oral Health 15: 100. [Crossref]
2021 Copyright OAT. All rights reserv
- Meredith P, Strong J, Ford P, Branjerdporn G (2016) Associations between adult attachment and: oral health-related quality of life, oral health behaviour, and self-rated oral health. Qual Life Res 25: 423-433. [Crossref]
- Han MA, Ryu SY, Park J, Kang MG, Park JK, et al. (2008) [Health-related quality of life assessment by the EuroQol-5D in some rural adults]. J Prev Med Public Health 41: 173-180. [Crossref]
- Ko Y, Coons SJ (2006) Self-reported chronic conditions and EQ-5D index scores in the US adult population. Curr Med Res Opin 22: 2065-2071. [Crossref]
- Burström K, Johannesson M, Diderichsen F (2001) Swedish population health-related quality of life results using the EQ-5D. Qual Life Res 10: 621-635. [Crossref]
- Brennan DS, Spencer AJ, Roberts-Thomson KF (2008) Tooth loss, chewing ability and quality of life. Qual Life Res 17: 227-235. [Crossref]
- Choi1 HS, Kwon MH (2016) Impacting factors of oral health status on EQ-5D among the elderly: The 6th Korea National Health and Nutrition Examination Survey. India J Sci Tech 9: 1-4.
- EuroQol G (1990) EuroQol-a new facility for the measurement of health-related quality of life. Health policy 16: 199-208. [Crossref]
- Rabin R, de Charro F (2001) EQ-5D: a measure of health status from the EuroQol Group. Ann Med 33: 337-343. [Crossref]
- Kim MH, Cho YS, Uhm WS, Kim S, Bae SC (2005) Cross-cultural adaptation and validation of the Korean version of the EQ-5D in patients with rheumatic diseases. Qual Life Res 14: 1401-1406. [Crossref]
- Korea Center for Disease Control and Prevention (2007) EQ-5D Korean valuation study using time trade off method.
- Ainamo J, Barmes D, Beagrie G, Cutress T, Martin J, et al. (1982) Development of the World Health Organization (WHO) community periodontal index of treatment needs (CPITN). Int Dent J 32: 281-291. [Crossref]
- World Health Organization (2004) Appropriate body-mass index for Asian populations and its implications for policy and intervention strategies. Lancet 363:157-163. [Crossref]
- Alderman MH (2004) JNC 7: brief summary and critique. Clin Exp Hypertens 26: 753-761. [Crossref]
- World Health Organization (2006) World Health Organization and International Diabets Federation: Definition and Diagnosis of Diabetes Mellitus and Intermediate Hyperglycaemia: Report of a WHO/IDF Consultation. Geneva: World Health Organization.
- Kim JI (2013) Levels of health-related quality of life (EQ-5D) and its related factors among vulnerable elders receiving home visiting health care services in some rural areas. J Korean Acad Community Health Nurs 24: 99.
- Kim SY, Sohn SY (2012) Factors related to health related quality of life in rural elderly women. J Korean Gerontol Nurs 14.
- Hugo FN, Hilgert JB, de Sousa Mda L (2009) Oral status and its association with general quality of life in older independent-living south-Brazilians. Community Dent Oral Epidemiol 37: 231-240. [Crossref]
- Brennan DS, Singh KA (2011) General health and oral health self-ratings, and impact of oral problems among older adults. Eur J Oral Sci 119: 469-473. [Crossref]
- Takata Y, Ansai T, Awano S, Fukuhara M, Sonoki K, et al. (2006) Chewing ability and quality of life in an 80-year-old population. J Oral Rehabil 33: 330-334. [Crossref]
- Fontanive V, Abegg C, Tsakos G, Oliveira M (2013) The association between clinical oral health and general quality of life: a population-based study of individuals aged 50-74 in Southern Brazil. Community Dent Oral Epidemiology 41: 154-162. [Crossref]
- Sim SJ (2014) Association between oral health status and perceived general health (EuriQol-5D). J Dent Hyg Sci 14: 364-370.
- Ohara Y, Hirano H, Watanabe Y, Obuchi S, Yoshida H, et al. (2015) Factors associated with self-rated oral health among community-dwelling older Japanese: A cross-sectional study. Geriat Gerontol Int 15:755-761. [Crossref]
- Benyamini Y, Leventhal H, Leventhal EA (2004) Self-rated oral health as an independent predictor of self-rated general health, self-esteem and life satisfaction. Soc Sci Med 59: 1109-1116. [Crossref]
- Locker D, Matear D, Stephens M, Jokovic A (2002) Oral health-related quality of life of a population of medically compromised elderly people. Community Dental health 19:90-97. [Crossref]