Background: Gallbladder ejection fraction (GBEF) from sincalide cholescintigraphy is frequently used as an index for referring patients with gallbladder dyskinesia for cholecystectomy. However, a significant number of patients who undergo cholecystectomy on the basis of the widely accepted criteria (GBEFmax < 35%) remain symptomatic even after surgery. The aim of this study is to examine alternative parameters for quantification of sincalide cholescintigraphy.
Methods: Eighty-one (81) patients were investigated with sincalide cholescintigraphy (including GBEFmax estimation). GBEF at 10 minutes (GBEF10), peak emptying rate, time to peak emptying rate and area under the curve (AUC) were calculated. These parameters were compared between the groups of patients remaining symptomatic and asymptomatic post-operatively and in those who did not undergo surgery. Student’s t-test was used to compare group means.
Results: Among 81 patients 40 patients had abnormal GBEFmax (< 35%), 31/40 patients underwent laproscopic cholecystectomy along with 10/41 patients with a normal GBEFmax and12/41 patients (29%) remained symptomatic post-operatively. There were significant differences between symptomatic and asymptomatic patients of the surgery group for GBEF10 (13% vs. 22%, p = 0.03), peak emptying rate (-0.03 cpm2 vs. -0.05 cpm2, p = 0.01) and AUC (0.88 counts vs. 0.81 counts. p = 0.047). These parameters were more “normal” in those patients who benefited from surgery.
Conclusion: The alternative parameters mentioned above were as ambiguous as the currently used parameter i.e. GBEF. Patients who remain symptomatic after laparoscopic cholecystectomy for gall bladder dyskinesia have more abnormal values in the above-mentioned alternative parameters implying an inherent abnormality in biliary tract function.
gall bladder dyskinesia, gall bladder ejection fraction, alternative parameters, sincalide cholescintigraphy
Gall bladder dyskinesia is a common under diagnosed functional motility disorder of the gall bladder contributing to significant surgical morbidity. This disorder is also known by various names, including chronic acalculous gallbladder disease, chronic acalculous cholecystitis, gallbladder dyskinesia, cystic duct syndrome, gallbladder spasm, and functional gallbladder disease [1]. Since the pathophysiology is uncertain, it is essentially a diagnosis of exclusion. Multiple possible hypothesis has been proposed and these include abnormalities of cholecystokinin (CCK) release, reduced gallbladder CCK receptor sensitivity/density, increased cystic duct receptor CCK sensitivity, and impaired smooth muscle contractility [2]. The prevalence reported in literature varies from 6-8 % in men and 12-25 % in women [3-6]. The Rome III criteria define functional gall bladder pain as 1) an episode of pain lasting 30 minutes or longer; 2) recurrent symptoms occurring at different intervals (not daily); 3) pain that builds up to a steady level; 4) pain that is moderate to severe enough to interrupt daily activities or lead to an emergency department visit; 5) pain that is not relieved by bowel movements; 6) pain that is not relieved by postural change; 7) pain that is not relieved by antacids; and 8) exclusion of other structural disease that would explain symptoms [7].
Cholecystokinin-stimulated cholescintigraphy was first described three decades ago as a method to accurately quantify gallbladder emptying [8,9]. Sincalide (Kinevac; Bracco Diagnostics, Inc.) is the widely used, commercially available form of cholecystokinin. Sincalide cholescintigraphy is a non-invasive nuclear medicine imaging technique employing the administration of [99Tcm]-labelled hepato-imino diacetic acid (HIDA-mebrofenin) to patients to assess the hepatic uptake and gallbladder function. Patients with suspected gall bladder dyskinesia as the cause for recurrent upper abdominal pain are commonly referred for sincalide-stimulated cholescintigraphy for calculation of the gallbladder ejection fraction (GBEF); a parameter derived from the imaging technique.
An arbitrary cut off value of GBEF < 35 % is universally adopted for the diagnosis of gall bladder dyskinesia and patients are referred for surgical intervention on the basis of this parameter. This modality of patient selection is unsatisfactory as patients with GBEF > 35% present with symptoms typical of biliary dyskinesia and may be denied surgery if this parameter is rigidly followed. Hence, the primary aim of this study was to investigate whether a new set of alternative quantitative parameters based on the curve derived from the sincalide cholescintigraphy study such as GBEF max (Maximum GBEF), GBEF10 (GBEF @ 10 m), peak emptying rate (PER), time to reach peak emptying rate and area under the curve would be useful to identify a group of patients that are most likely to benefit from surgical intervention.
Patient population
A retrospective case note review of all patients (between 2005–2010) with right upper quadrant pain who did not have gall stones on trans-abdominal ultrasonography and who were further investigated by sincalide cholescintigraphy was undertaken.
Imaging
Patients were imaged immediately after the administration of a mean activity of 150 ± 6 MBq (mean ± SD) of 99Tcm-mebrofenin (GE Healthcare, Milwaukee, WI, USA); the range of administered activities was between 138-163 MBq. Imaging was performed on an Infinia Hawkeye gamma camera (GE Healthcare, Milwaukee, WI, USA) equipped with low energy, general purpose parallel-hole collimation. Energy discrimination was accomplished by using an energy window of 20% centered around the 140 keV photopeak of 99Tcm. Dynamic acquisition of images over 30 frames at 120 seconds per frame was performed using 1282 matrices. Immediately following the acquisition of the dynamic frames, a 0.02 μg per patient weight (kg) sincalide® (cholecystokinin octrapeptide or CCK-8) infusion was commenced over a duration of 10 minutes with simultaneous dynamic imaging; in total, 30 frames of 60 seconds were acquired using 1282 matrices (Figure 1-3).
Figure 1. To determine the gallbladder ejection fraction (GBEF), regions of interest are drawn around the gallbladder (G) and liver background (B) and a time-activity curve is generated. The green and yellow lines correspond to the maximum and minimum activity points of the gallbladder required to calculate the GBEFmax. The gallbladder ejection fraction at 10, 20- and 30-minutes post sincalide infusion is illustrated.
Figure 2. Hepatobiliary scan showing biliary excretion of the radiopharmaceutical post sincalide infusion. GBEF = 77% which is normal.
Figure 3. Hepatobiliary scan showing persistent gallbladder activity despite washout of the radiopharmaceutical from liver and remainder of the biliary tree suggestive of biliary dyskinesia. The GBEFmax was calculated to be equal to 25% which is abnormal.
Patient referral/follow-up
Patients found to have an abnormal GBEF on the basis of the current criteria (GBEF ≤ 35% with CCK-8) were offered cholecystectomy, whereas patients with a normal scan were referred to medical gastroenterology and were only re-assessed by the surgical team if their symptoms failed to resolve. All patients had clinical or telephone follow up over a period ranging from 6 - 18 months (mean - 13 months) and their symptoms assessed at follow up. All gall bladder specimens after surgery were subjected to histopathological examination.
Image analysis/interpretation
All images were retrieved from archive and re-analysed using in-house written software. A region of interest (ROI) was delineated around the gallbladder on the sincalide images and the count-rate within the ROI was plotted as a function of time. From the produced curves, the following quantitative parameters were calculated for each patient:
- the maximum GBEF (i.e. GBEFmax) between the frames with the maximum and minimum count-rates of the gallbladder (i.e. GBEFmax); the GBEFmax was calculated using the following equation:
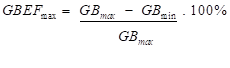
where GBmax and GBmin are the maximum and minimum gallbladder count-rates respectively.
- the GBEF between the frame with the maximum count-rate of the gallbladder and the frame at 10 minutes post maximum gallbladder count-rate (i.e. GBEF10); the GBEF10 was calculated using the following equation:
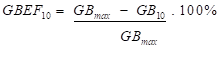
where GB10 is the gallbladder count-rate 10 minutes post GBmax.
- the peak emptying rate (PER) of the gallbladder; a [1 2 1] filter was used to smooth the raw count-rate data and iterated for 10 times. The PER was calculated as the minimum point of the differentiated gallbladder curve.
- the time to reach the PER of the gallbladder was calculated as the time to reach the PER from the maximum count-rate point.
- the area under the time-activity curve (AUC) was calculated by summing the counts within each frame between the maximum and minimum activity points of the gallbladder ROI. The AUC was expressed as a proportion of the area which would have been obtained had no emptying occurred.
Statistical analysis
The significance of differences between the mean values of all the functional parameters derived from the dynamic images of various patient groups (classified according to whether they had surgery or not and also based on their symptom status at follow up) was analysed (Figure 4). First, the mean values of patient group A1 were compared against those from patient group A2 using the Student’s t-test; accordingly, patient groups B1 and B2 were also compared. Patients who were asymptomatic after surgery (A2) were compared with patients who became asymptomatic on follow up without surgery (B2). The Student’s t-test was used to assess the significance of differences between the mean values of the various parameters investigated.
Figure 4. Classification of patients on the basis of whether they were referred for surgery (Group A) or not (Group B). Each group is then subdivided between symptomatic (Groups A1 and B1) and asymptomatic patients (Groups A2 and B2) according to their post-operative/follow-up symptoms.
Eighty one (81) patients (M:F = 22:59) with a mean age of 54 (range: 24–87 years) underwent sincalide cholescintigraphy for typical symptoms after negative trans abdominal ultrasound scan for gall stones.
Imaging and GBEF
Thirty two of 41 patients who underwent laparoscopic cholecystectomy had GBEF < 35 %. Nine patients had GBEF > 35% and underwent surgery at the discretion of the surgeon as these patients had classical symptoms of biliary dyskinesia. Eight of the 40 patients who had GBEF < 35% did not undergo surgery as they declined surgical intervention (Table 1).
Table 1. Patient numbers and outcomes for normal and abnormal GBEF
Outcome |
GBEF ≤ 35% |
GBEF > 35% |
Total |
Surgery |
32 |
9 |
41 (51%) |
No surgery |
8 |
32 |
40 (49%) |
Total |
40 (49%) |
41 (51%) |
81 |
Clinical and histological follow-up data
Histological and clinical follow-up data were obtained for all patients (Table 2). These are divided into four groups: (i) GBEF ≤ 35% that did undergo surgery; (ii) GBEF ≤ 35% who declined surgery; (iii) GBEF > 35% that underwent surgery and (iv) GBEF > 35% that did not undergo cholecystectomy. 29/41 (71%) patients who underwent laparoscopic cholecystectomy were asymptomatic at follow up. 12/41 (29%) patients continued to be symptomatic even after surgery. 24/40 (60%) patients who did not undergo surgery became asymptomatic at last clinical review.
Table 2. Histological and clinical follow-up findings. The numbers in brackets denote the number of patients who remained symptomatic post-surgery for each patient category
Findings |
GBEF ≤ 35% |
GBEF > 35% |
Surgery |
No surgery |
Surgery |
No surgery |
Total |
32 (80%) |
8 (20%) |
9 (22%) |
32 (78%) |
Histological data |
|
|
|
|
Normal histology |
7 (6) |
|
3 (0) |
|
Chronic cholecystitis |
23 (3) |
|
5 (1) |
|
Cholesterolosis |
1 (1) |
|
|
|
Mild inflammation |
1 (1) |
|
1 (0) |
|
Clinical follow-up |
|
|
|
|
Improvement |
21 (66%) |
4 (50%) |
8 (89%) |
20 (63%) |
No change |
11 (34%) |
4 (50%) |
1 (11%) |
12 (37%) |
Patients with GBEF ≤ 35%: 20/25 (80%) of patients with abnormal histology had complete relief of their symptoms. Seven patients had normal histology with only one reporting relief of symptoms. Hence 21/32 (66%) patients were completely asymptomatic at last clinic review. Of the 8 patients who declined surgery, 50% became asymptomatic at follow up.
Patients with GBEF > 35%: 19/41 (46%) patients were asymptomatic at follow up. 8/9 (89%) patients with a normal scan who underwent surgery at the discretion of the surgeon were asymptomatic at follow up. 3/9 (33%) of these patients had normal histology (Table 2).
Correlation with histology
The mean values of all the alternative functional parameters under investigation of patients with normal histology were compared with those patients who had abnormal histology. There was no statistically significant difference found for any of the parameters examined (Table 3).
Table 3. Mean values and standard deviation of the parameters examined for the group of patients who underwent surgery; patients assessed to have normal histological findings were compared against those with abnormal histological data
Parameter |
Patient Group A
(41 patients) |
p-value |
Normal Histology
(10 patients) |
Abnormal Histology
(31 patients) |
GBEFmax (%) |
36 ± 30 |
26 ± 22 |
0.19 |
GBEF10 (%) |
27 ± 27 |
17 ± 17 |
0.14 |
Peak Emptying Rate (cpm2) |
-0.05 ± 0.05 |
-0.04 ± 0.04 |
0.24 |
Time to peak emptying rate (min) |
7 ± 4 |
7 ± 5 |
0.49 |
Area under the curve (counts) |
0.81 ± 0.15 |
0.86 ± 0.14 |
0.19 |
Correlation with outcome after surgery
There was a statistically significant difference for all the new alternative functional parameters under investigation between the patients who became symptom-free and those who remained symptomatic after surgery (Table 4).
Table 4. Comparison of mean values and standard deviation of the new parameters between patients asymptomatic after surgery and those who remain symptomatic after surgery at follow up
Parameter |
Patient Group A
(41 patients) |
p-value |
Symptomatic
(12 patients) |
Asymptomatic
(29 patients) |
GBEFmax (%) |
22 ± 13 |
32 ± 27 |
0.05 |
GBEF10 (%) |
13 ± 8 |
22 ± 13 |
0.03 |
Peak Emptying Rate (cpm2) |
-0.03 ± 0.01 |
-0.05 ± 0.05 |
0.01 |
Time to peak emptying rate (min) |
8 ± 4 |
6 ± 4 |
0.05 |
Area under the curve (counts) |
0.88 ± 0.08 |
0.81 ± 0.19 |
0.05 |
Correlation in patients who did not undergo surgery
There were no statistically significant differences for any of the new functional parameters being assessed between symptomatic and asymptomatic patients who did not undergo surgery at last clinic review (Table 5).
Table 5. Mean values and standard deviation of the parameters examined for the group of patients who did not undergo surgery; patients who became asymptomatic were compared against those who remained symptomatic
Parameter |
Patient Group B
(40 patients) |
p-value |
Symptomatic
(16 patients) |
Asymptomatic
(24 patients) |
GBEFmax (%) |
63 ± 32 |
60 ± 26 |
0.37 |
GBEF10 (%) |
53 ± 34 |
46 ± 29 |
0.23 |
Peak Emptying Rate (cpm2) |
-0.12 ± 0.08 |
-0.09 ± 0.06 |
0.11 |
Time to peak emptying rate (min) |
5 ± 3 |
6 ± 4 |
0.33 |
Area under the curve (counts) |
0.54 ± 0.26 |
0.60 ± 0.20 |
0.29 |
Comparing the group of patients who became symptom-free with no surgical intervention (group B2) against those who became asymptomatic post-surgery (group A2), there were statistically significant differences in the GBEFmax, GBEF10, PER, and the AUC (Table 6).
Table 6. Mean values and standard deviation of the parameters examined between the post-surgery (group A2) and non-surgical (group B2) groups of patients
Parameter |
Post surgery
(29 patients) |
No surgery
(24 patients) |
p-value |
GBEFmax (%) |
32 ± 27 |
60 ± 26 |
< 0.01 |
GBEF10 (%) |
22 ± 23 |
46 ± 29 |
< 0.01 |
Peak Emptying Rate (cpm2) |
-0.05 ± 0.05 |
-0.09 ± 0.06 |
< 0.01 |
Time to peak emptying rate (min) |
6 ± 4 |
6 ± 4 |
NS |
Area under the curve (counts) |
0.83 ± 0.16 |
0.66 ± 0.18 |
< 0.01 |
HIDA scan is generally accepted as an accurate and reproducible method of demonstrating gallbladder dysfunction or dyskinesia. However, there is currently no consensus regarding the cut off value for level of dysfunction (indicated by the ejection fraction or GBEF) at which cholecystectomy is beneficial. Clinical improvement after cholecystectomy in patients with gallbladder dysfunction has been reported by a number of studies, but the variability in doses and administration regimes of CCK makes comparison between these studies difficult to interpret and subsequent definitions of abnormal GBEF vary between 35 and 65% [10].
The current accepted abnormal cut off value for gall bladder ejection fraction (GBEF) is controversial. The concept of CCK provocation with calculation of an ejection fraction (EF) was first reported in 1981 by Krishnamurthy et al. [9]. In Krishnamuthy’s original study, the six asymptomatic patients had EFs varying from 0–78%. The cut off value of EF < 40% used in the Rome III criteria, was calculated on the basis of an assessment of only 40 asymptomatic individuals [11]. Furthermore, Zeissman et al. [12] noted in their own study that 35% of asymptomatic patients had an EF < 45%. Despite a body of evidence in support of CCK HIDA, a number of authors have claimed that the EF is poor in predicting symptomatic outcome following cholecystectomy [13–17]. In addition to the variation in dose and administration, many of the current studies are of poor methodology and there is currently only one randomised controlled trial addressing this topic [18–20].
Almost a third of patients (29%) in this study who underwent laparoscopic cholecystectomy were symptomatic post-surgery. This was lower than the rate reported from previous studies (i.e. 34–40 %) [2–4]. This finding is suggestive of the possible inadequacy of the gallbladder ejection fraction as a parameter for the referral of patients for laparoscopic cholecystectomy. A small number of patients who had a normal GBEF on the basis of the current criteria (GBEF > 35%; n = 9) were offered laparoscopic cholecystectomy. This was done as the type and severity of the presenting symptoms were perceived to be indicative of gallbladder dysfunction. 8/9 of these patients had symptomatic improvement at follow up indicating that a surgeon’s clinical assessment after due clinical review is helpful in making surgical decision making regarding surgical intervention.
The histology of the resected gall bladder specimens revealed that abnormalities can be present in a significant percentage of “normal” patients (67% in this series); thereby calling into question the reliability of the current criteria of GBEF < 35% as the cut off value for considering the surgical option. In addition, 33% of “normal” patients who were referred for surgery became symptom-free post operatively; however, the pain might not have been attributable to gallbladder dysfunction as histology was found to be normal. Thus, hypothetically these patients might have become asymptomatic at follow up without undergoing laparoscopic cholecystectomy.
29/41 patients who had abnormal histology showed clinical improvement at follow up. However, there was no correlation between abnormal histology and GBEF abnormality. Hence a more accurate sonographic assessment to determine structural abnormalities which might impede gall bladder function such as thickening, cholesterolosis and inflammation may help in patient selection for surgical intervention.
There was statistically significant difference for all the new parameters between the symptomatic and asymptomatic patients (at follow up) in the surgical group. The new parameters that were assessed were more abnormal in the symptomatic patients when compared to those who were asymptomatic at follow up. For example, the ejection fraction was more normal in the group of patients who became asymptomatic post-surgery. This finding suggests that patients who have functional parameters with values that possibly signify impaired gallbladder function (i.e. lower GBEFmax, GBEF10, higher AUC, PER and time to reach the PER) have a lower probability of benefiting from the surgical intervention. This may be reflective of the widely held view that gall bladder dyskinesia may be a component of the global biliary dyskinesia and hence the more abnormal values in patients who remain symptomatic after cholecystectomy may be due to underlying abnormality in biliary tree motility [21]. Hence these new parameters may be used to further select patients after sincalide cholescintigraphy when surgical intervention is considered. Patients with more abnormal values maybe warned that there is a high chance of persistence of symptoms even after surgery attributable to the inherent biliary dysmotility. Such patients may be further investigated with biliary manometry to see whether they have sphincter of Oddi dysfunction and if so may benefit from sphincteroplasty. However, larger studies will have to be done to first confirm this finding and then for corroboration of the sphincter of Oddi pressures by biliary manometry.
From the statistical comparison between the symptomatic and asymptomatic patients of the non-surgery group, there was no statistically significant difference for all the quantitative parameters under investigation. There was statistically significant difference for all the new parameters under investigation between patients who became asymptomatic after surgical intervention compared with patients who became asymptomatic on follow up in the non-surgical group who had normal GBEF. This again reinforces the view that patients with abnormal GBEF have inherently abnormal biliary motility.
The new functional parameters investigated in this study offer some exciting new alternatives which merit further investigation. Though they could not help refining the value of GBEF in assessing patients who might benefit from cholecystectomy, they were found to be more abnormal in patients who remained symptomatic after surgery. The majority of patients who had abnormal histology were asymptomatic at follow up. Hence imaging modalities other than ultrasound may be useful in picking up structural abnormalities which may influence gall bladder function. We also propose that gall bladder dyskinesia is a piece in the jig saw puzzle of biliary dyskinesia and patients with a diagnosis of gall bladder dyskinesia who remain symptomatic after surgery may benefit from investigations for sphincter of Oddi dysfunction. In the context of an unreliable parameter such as GBEF, a surgeon’s clinical assessment after a reasonable clinical review may ultimately be beneficial for the patient.
- Ziessman HA (2006) Functional hepatobiliary disease: chronic acalculous gallbladder and chronic acalculous biliary disease. Semin Nucl Med 36: 119-132. [Crossref]
- Merg AR, Kalinowski SE, Hinkhouse MM, Mitros FA, Ephgrave KS, et al. (2002) Mechanisms of impaired gallbladder contractile response in chronic acalculous cholecystitis. J Gastrointest Surg 6: 432-437. [Crossref]
- Bainton D, Davies GT, Evans KT, Gravelle IH (1976) Gallbladder disease. Prevalence in a South Wales industrial town. N Engl J Med 294: 1147–1149. [Crossref]
- Rome Group for the Epidemiology and Prevention of Cholelithiasis (GREPCO) (1984) Prevalence of gallstone disease in an Italian adult female population. Am J Epidemiol 119: 796–805. [Crossref]
- Janzon L, Aspelin P, Eriksson S, Hildell J, Trell E, et al. (1985) Ultrasonographic screening for gallstone disease in middle-aged women. Detection rate, symptoms, and biochemical features. Scand J Gastroenterol 20: 706–710. [Crossref]
- Jorgensen T (1989) Abdominal symptoms and gallstone disease: an epidemiological investigation. Hepatology 9: 856–600. [Crossref]
- Drossman DA (2006) The functional gastrointestinal disorders and the Rome III process. Gastroenterology 130: 1377–1390. [Crossref]
- Spellman SJ, Shaffer EA, Rosenthall L (1979) Gallbladder emptying in response to cholecystokinin. A cholescintigraphic study. Gastroenterology 77: 115-120. [Crossref]
- Krishnamurthy GT, Bobba VR, Kingston E (1981) Radionuclide ejection fraction: a technique for quantitative analysis of motor function of the human gallbladder. Gastroenterology 80: 482–490. [Crossref]
- Rastogi A, Slivka A, Moser AJ, Wald A (2005) Controversies concerning pathophysiology and management of acalculous biliary-type abdominal pain. Dig Dis Sci 50: 1391–1401. [Crossref]
- Yap L, Wycherley AG, Morphett AD, Toouli J (1991) Acalculous biliary pain: cholecystectomy alleviates symptoms in patients with abnormal cholescintigraphy. Gastroenterology 101: 786–793. [Crossref]
- Ziessman HA, Fahey FH, Hixson DJ (1992) Calculation of a gallbladder ejection fraction: advantage of continuous sincalide infusion over the three-minute infusion method. J Nucl Med 33: 537–541. [Crossref]
- Misra DC Jr, Blossom GB, Fink-Bennett D, Glover JL (1991) Results of surgical therapy for biliary dyskinesia. Arch Surg 126: 957-960. [Crossref]
- Reed DN Jr, Fernandez M, Hicks RD (1993) Kinevac-assisted choles- cintigraphy as an accurate predictor of chronic acalcalous gallbladder disease and the likelihood of symptom relief with cholecystectomy. Am Surg 59: 273–277. [Crossref]
- Canfield AJ, Hetz SP, Schriver JP, Servis HT, Hovenga TL, et al. (1998) Biliary dyskinesis: a study of more than 200 patients and review of the literature. J Gastrointest Surg 2: 443–448. [Crossref]
- Yost F, Margenthaler J, Presti M, Burton F, Murayama K (1999) Cholecystectomy is an effective treatment for biliary dyskinesia. Am J Surg 178: 462-465. [Crossref]
- Skipper K, Sligh S, Dunn E, Schwartz A (2000) Laparoscopic cholecystectomy for an abnormal hepato-iminodiacetic acid scan: a worthwhile procedure? Am Surg 66: 30–32. [Crossref]
- Poynter MT, Saba AK, Evans RA, Johnson WM, Hasl DM (2002) Chronic acalculous biliary disease: cholecystokinin cholescintigraphy is useful in formulating treatment strategy and predicting success after cholecystectomy. Am Surg 68: 382–384. [Crossref]
- Ponsky TA, DeSagun R, Brody F (2005) Surgical therapy for biliary dyskinesia: a meta-analysis and review of the literature. J Laparoendosc Adv Surg Tech A 15: 239–242. [Crossref]
- Sabbaghian MS, Rich BS, Rothberger GD, Cohen J, Batash S, et al. (2008) Evaluation of surgical outcomes and gallbladder characteristics in patients with biliary dyskinesia. J Gastrointest Surg 12: 1224–1230. [Crossref]
- George J, Baillie J (2007) Biliary and gall bladder dyskinesia. Curr Treat Options Gastroenterol 10: 322-327. [Crossref]