Aortic dissection is the most common acute emergency condition of the aorta. Early diagnosis and treatment are essential for improving the prognosis. It is recommended that the scanning field include the entire aorta and pelvic vessels to help determine the type and extent of dissection. We presented a case in imagen of acute aortic dissection and showed the most representative TC findings.
Abbreviations
AAS: Acute aortic syndrome; IH: Intramural hematoma; AD: Aortic dissection; PU: Penetrating ulcer; CT: Computed tomography; RESA: Registro español de sindrome aortico (aortic syndrome spanish registry)
aortic dissection, acute aortic syndrome, cardiac arrest, blood vessel, portal pneumatosis, intestinal ischemia
An 81-year-old woman presented in Accident & Emergency in Marina Baixa Hospital, Villajoyosa, Alicante,complaining of severe abdominal pain for last two previous days and hypotension. In the emergency department, she had a cardiorespiratory arrest and was resuscitated. The patient was initially diagnosed with pericardial blood vessel following an emergency eco-cardio test and a CT scan, which was immediately performed to discard aortic dissection. The patient died 10 minutes later.
Acute aortic dissection is caused by the rupture of the intima that causes blood to enter the aortic wall separating the middle layers, thus forming a defined false duct between the outer middle layer and the adventitia outside and the intimate complex, medial or "flap" inside. The new formed channel shows flow in its intervention that returns distally to the light of the vessel through the re-entry hole [1].
Aortic dissection is included in the Acute Aortic Syndrome (AAS), along with intramuralhematoma and penetrating ulcer 1. These are characterized by:
-Intramural hematoma (IH) is a hemorrhage that affects the media layer of the aortic wall. This generates a tear of the vasa vasorum, which is also known as aortic dissection without intimal flap formation [2].
-Aortic dissection (AD) is a tear in the inner layer of aortic wall generating an intimal flap formation, which allows blood to enter into the aortic wall, creating a new passage for blood called false lumen differentiated from the true lumen (also called aortic channel) by a flap [3].
-Penetrating ulcer (PU) refers to an ulcerating atherosclerotic lesion that penetrates the elastic lamina and is associated with hematoma formation within the media of the aortic wall [4].
Two classifications are most commonly used for aortic dissection. The DeBakey system is classified into three types (types I, II, and III) according to the location of the first entry of dissection. Type I has the first entry in the ascending aorta and propagates distally to the descending aorta. Type II has the first entry in the ascending aorta and does not propagate to the aortic arch. Type III has the first entry in the descending aorta and propagates distally above (type IIIa) or below (type IIIb) the diaphragm. The Stanford system is classified into two types (types A and B) based on the involvement of the ascending aorta. Type A includes dissection in the ascending aorta regardless of the site of first entry. Type B does not include dissection in the ascending aorta [5].
It is estimated that in Spain the AAS shows an incidence rate of 20-40 cases per million habitant per year and it is more prevalent in males (80%) that it is in females. Of the AAS subtypes, the most prevalent are AD (80%), followed by IH (15%) and PU (5%). With regards to the location of the first entry of dissection, 68% affects the ascending aorta (type A) and 32% to the descending aorta (type B) [6].
The mortality rate is high in type A and requires urgent surgery. Type B requires antihypertensive treatment 1.
Aortic dissection debuts with chest or abdominal pain that radiates to the back, simulating other pathologies. Up to 20% present with a syncopal picture due to cardiac tamponade or obstruction of supraaortic trunks. Abdominal pain appears by compromise of the abdominal branches.
According to RESA files 6, Computed Tomography (CT) scan is the most frequently used imaging technique to diagnose patients with AD suspicion. Its multi-slice CT capacity of imaging reconstruction allows for almost 90% sentitivity and 85% specificity [6].
Non-enhanced phase
CT does not provide dynamic information. For instance, it does not provide information on neither the systolic function of the left ventricle or the aortic valve behaviour, which are both key to distinguish between an Intramural Hematoma and an aortic dissection diagnosis. To be able to differentiate between Intramural Hematoma and Aortic Dissection in the presence of active bleeding it would be advisable to obtain images without contrast, because they are clinically indistinguishable.
As we see in figures 1 and 2 no intramural hematoma signs are detectable. Instead we observe a pericardial blood vessel previously shown in the emergency echocardiogram that lead us to request the CT scan. We can also observe the aortic flap, indicative of a dissection.
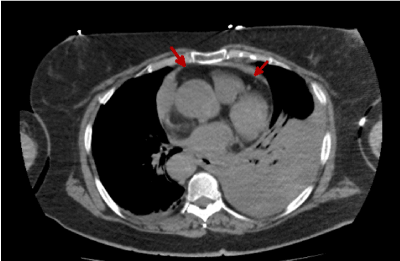
Figure 1. Thoracic CT image without i.v.c. showing pericardial blood vessel (red arrows)
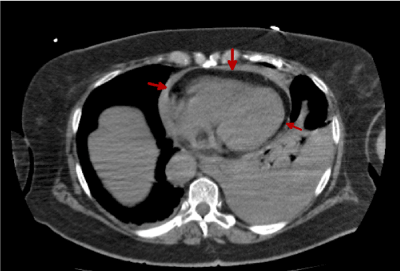
Figure 2. Thoracic CT image without i.v.c. Blood vessel in a more caudal image can be seen(red arrows)
Arterial phase
The CT Scan sequences are taken with intravenous contrast. The aim of this is to assess the morphology of the aortic channel, the true lumen and be able to observe the new passages of the blood to the false lumen.
The protocol used includes the whole aorta and its main branches, from subclavian artery to the beginning of femoral artery.
In Figure 3, we can clearly observe the aortic flap and how it divides the trajectory of the blood in the aortic channel (red arrow).
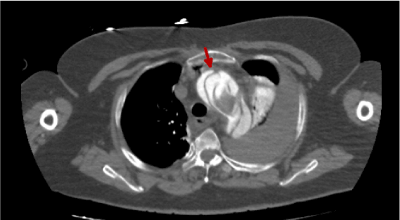
Figure 3. Thoracic CT image with i.v.c. in arterial phase in which we observe the Type A aortic dissection (red arrow)
Figure 4, shows additional information. This includes; (i) a hypo-enhanced aortic flap present in the descending aorta (green arrow); (ii) the dissection of the entire intima allows us to observe a circumferential intimal flap and a narrow true lumen in a filiform shape (green arrow)7; (iii) the red arrow also shows a typical cobweb sign distribution. The appearance of this distribution is a clear sign of false lumen [8]; (iv) hiperenhanced pulmonary artery (blue arrow).
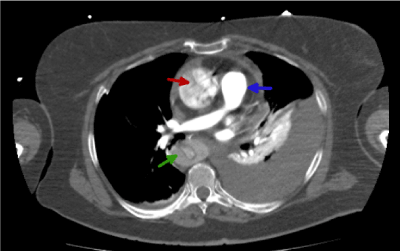
Figure 4. Thoracic CT image with i.v.c. in arterial phase that shows the dissection and the false lumen (green arrow)
Following the aortal channel we reach the abdominal aorta:
Figures 4 and 5 show a still aortic flap abdominal level (red arrow). This is produced by the dissection, and even though we injected intravenous contrast we see the aortic channel hypo-enhanced. However, we observe both hepatic veins and renal veins as hiper-enhanced (green arrow), when, in theory, the venous flow comes after the arterial flow, in a late phase [9].
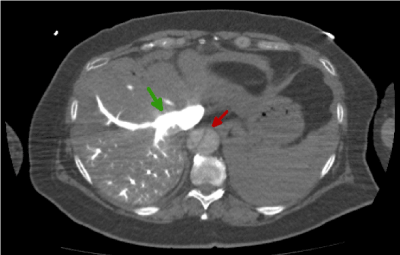
Figure 5. Abdominal CT image with i.v.c. in arterial phase that shows the dissection at abdominal level(red arrow)
Additionally, it is evident that the contrast tends to accumulate in the body’s dorsal section (blue arrow). Figures 5 and 6 show a liver with no contrast in the ventral area. Instead, the contrast tends to accumulate in the dorsal area. This erratic distribution of the intravenous contrast is also compatible with the asystolic blood pumping idea mentioned earlier.
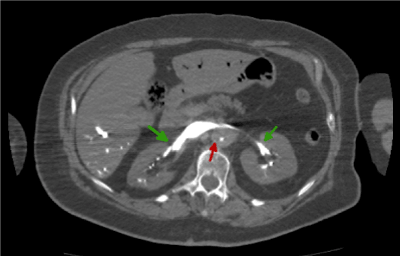
Figure 6. Abdominal CT image with i.v.c. in arterial phase where we observe hiper-enhanced renal veins
When cardiac arrest occurs, the blood flow slows down, the blood and venous pressure drop dramatically to undetectable levels and normal pressure gradients between different vascular systems are lost. Therefore, the distribution of the contrast medium injected at this time will be determined by the pressure generated by the injection pump and by the hydrostatic pressure.
In this way, forced contrast reflux accumulates in the declining areas of the right part of the body, especially in the abdominal venous structures (inferior vena cava, hepatic and renal veins) (Figures 5-8) as well as in the hepatic parenchyma (right hepatic lobe) and renal area. Because there is no dilution of contrast with circulating blood, a markedly dense appearance of these structures is observed. As the blood flow is slowed, the dissection
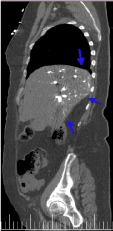
Figure 7. Sagital plane reconstruction of thoracic-abdominal CT image with i.v.c. in arterial phase. Accumulation of the contrast is evident in the dorsal part of the body (blue arrow).
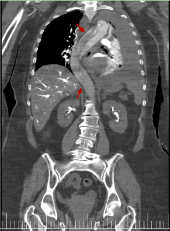
Figure 8. Coronal reconstruction image from thoracic-abdominal CT with i.v.c. in arterial phase. It shows the aortic flap in the entire aortic trajectory (red arrow)
in the portal phase is better visualized [10].
Figure 9 shows internal displacement of intimal calcification.
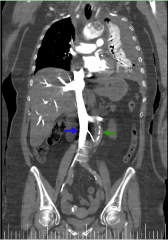
Figure 9. Coronal reconstruction imagen from thoracic-abdominal CT with i.v.c. in arterial phase.It shows the difference of enhancement between abdominal aorta (green arrow) and cava vein (blue arrow)
Late phase
Due to the irregular distribution of the intravenous contrast, we decided to make a late sequence that matches a portal phase.
The difference of enhancements amongst phases are shown in figures 10-13. The flap is visible in both images but is better visualized at portal phase.
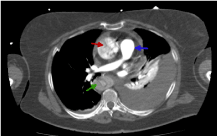
Figure 10. Thoracic CT image with i.v.c. in arterial phase where we distinguish different enhancements
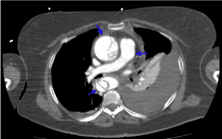
Figure 11. Same image as in figure 10 but in a late portal phase. It shows how the enhancements have been balanced in each zone (blue arrow)
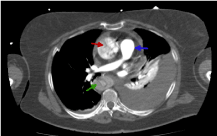
Figure 12. Abdominal CT image with i.v.c. in arterial phase where we observe the abdominal aorta hypo-enhanced
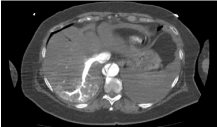
Figure 13. Same image as in figure 12 but with i.v.c. in late portal phase. We see now the aorta enhancement is at the same intensity as the one in the porta vein
Figure 14 shows that flap is still present at the end of the aortic artery, just before the aortic bifurcation.
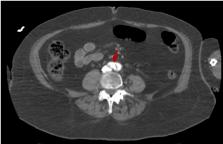
Figure 14. Abdominal CT image with i.v.c. in late portal phase that shows how the dissection continues to the very end of the aorta artery (red arrow)
However, figure 15 shows a downward trajectory of the flap immediately after the flap bifurcation inside the right iliac common artery. We can therefore confirm that the aortic dissection in this patient is complete and includes all the trajectory of the aortic artery, from the ascending section to the aortic bifurcation and even further in the right iliac common artery.
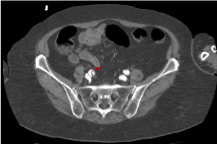
Figure 15. Abdominal CT image with i.v.c. in late portal phase that shows the aortic dissection has reached even the right iliac common artery (red arrow)
We can see in figures 16 and 17 almost the entire trajectory of the aortic dissection, including the common iliac arteries.
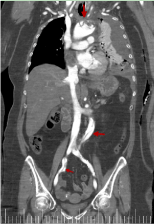
Figure 16. Coronal reconstruction from thoracic-abdominal CT with i.v.c. in late portal phase that shows the range of the aortic dissection (red arrow)
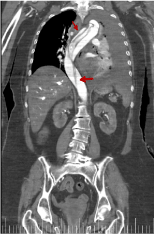
Figure 17. Coronal reconstruction from thoracic-abdominal CT with i.v.c. in late portal phase that shows the range of the aortic dissection (red arrow)
Figures 18-22 shows air in portal system. Its main etiology is the intestinal ischemia. This is generally considered a predictor of intestinal perforation and it may lead to a erroneous prognosis [11-14]. In our case study, portal pneumatosis suggests intestinal ischemia due to low cardiac output as a result of aortic insufficiency, previous cardiac arrest and/or involvement of abdominal arterial branches by dissection. The abdominal pain presented by our patient could be due to intestinal ischemia [1].
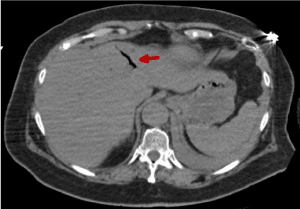
Figure 18. Abdominal CT image that shows air presence in portal system (red arrow)
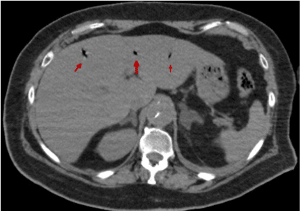
Figure 19. Abdominal CT image that shows air presence in portal system (red arrow)
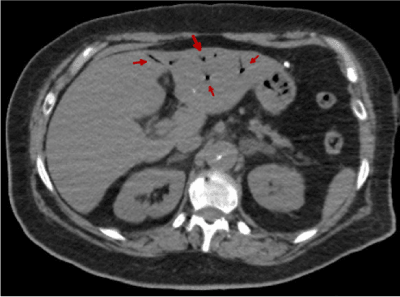
Figure 20. Abdominal CT image that shows air presence in portal system (red arrow)
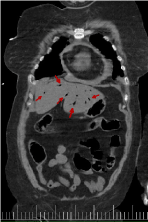
Figure 21. Coronal reconstruction from CT scan with air presence in portal system(red arrow)
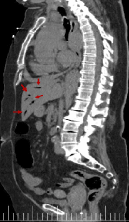
Figure 22. Sagittal reconstruction from CT scan with air presence in portal system(red arrow)
Aortic dissection is the most frequent cause of aortic emergency and as such should always be suspected in these situations. As demonstrated by this case study and in order to avoid future preventable deaths, this must be diagnosed and treated urgently. For, he appropriate diagnosis of aortic dissection, we highly recommend the use of CT imaging with the following sequences: (i) Non-enhanced phase, in order to differentiate between IH and AD; (ii) Arterial phase with intravenous contrast; (iii) Late phase with intravenous contrast matching portal phase; (iv)
- Michelle A. McMahon, FRCR, Christopher A (2010) Multidetector CT of aortic dissection: A pictorial review. Squirrell, FRCR; Radiographics 30(2):445-460.
- Ihab B, Alomari Yasmin S, Hamirani George Madera, Cyril TabeNila Akhtar, Veena Raizada (2014) Aortic intramural hematoma and its complications. Circulation 129:711-716.
- Derek Juang, Alan C Braverman, Kim Eagle (2008) Aortic Dissection. Circulation 118:e507-e510.
- Hideyuki Hayashi, Yohjiro Matsuoka, Ichiro Sakamoto, Eijun Sueyoshi, Tomoaki Okimoto, et al. (2000) Penetrating atherosclerotic ulcer of the aorta: Imaging features and disease concept. RadioGraphics 20:995-1005.
- Fukui T (2018) Management of acute aortic dissection and thoracic aortic rupture. Journal of Intensive Care 6(15).
- A Evangelista, F Padilla, J López-Ayerbe, F Calvo, JM López-Pérez, et al. (2009) Segun datos del Registro Español de SAA (RESA). Rev Esp Cardiol 62(3):255-262.
- Hospitals participating in the Spanish Acute Aortic Syndrome Study. Spanish Acute Aortic Syndrome Study (RESA). Better Diagnosis Is Not Reflected in Reduced Mortality. Rev Esp Cardiol (Engl Ed) 62:255-262.
- Hallinan JTPD, Anil G (2014) Multi-detector computed tomography in the diagnosis and management of acute aortic syndromes. World Journal of Radiology 6(6):355-365.
- Consenso de Patologia de la Aorta. Revista Argentina de Cardiología. 2014; Volumen 72 n.º 5. Septiembre-Octubre 393.
- Bae KT (2010) Intravenous contrast medium administration and scan timing at CT: Considerations and Approaches. Radiology 256.
- Ko Sheung-Fat, Ng Shu-Hang, Chen Min-Chi, Lee Tze-Yu, Huang Chung-Cheng, et al. Sudden cardiac arrest during computed tomography examination: Clinical finding and "Dense Abdominal Veins" on computed tomography. Journal of Computer Assisted Tomography 27(1):93-97.
- Laura Morales C, Jorge Carrillo B, Juan Sebastián Ojeda G, Germán Torres A (2018) Portograma aéreo y neumatosis intestinal como hallazgos incidentales en postoperatorio de cirugía abdominal. Revista Chilena de Radiología 24;40-43.
- Mario ML, Andrés GM, Carmen NR, Susana PB, Soliveres S (2014) Neumatosis portomesentérica e intestinal: no siempre es lo que parece. Acta Gastroenterológica Latinoamericana 44(3):246-251.
- Reoyo-Pascual JF, León-Miranda R, Valero-Cerrato X, Rosa M (2013) Portal pneumatosis: Sign of alert or casual discovery? Revista española de enfermedades digestivas 105(5).


