Abstract
Objectives: Mothers play a pivotal role in adolescent development, but do the impacts of biological and non-biological mothers differ? Using two different model specifications, this study evaluates the correlation between biological/non-biological mothers and body mass index (BMI) growth and tests for changes in these correlations as adolescents age into young adults. Growth trajectory estimation projects growth differences among respondents with/without a biological mother.
Methods: Using 15 years of longitudinal data, analysis explores the correlation between maternal status and BMI growth with both simple and generalized models. The sample is then divided into adolescents and young adults and re-estimated to explore differences in the two groups. Finally, projected BMI trajectories test for variation in BMI growth for respondents with/without a biological mother.
Results: Results suggest that race/ethnicity and age are highly correlated with BMI. Maternal and respondent are directly, but not proportionally related. The impact of non-biological mothers is much smaller than that biological mothers particularly at older ages. BMI trajectories reveal distinctly different growth for males and females and their maternal relationship.
Conclusion: Analysis suggests large racial/ethnic and gender differences in BMI growth. Maternal BMI is highly correlated with adolescents’ BMI growth irrespective of the mothers’ biological status, but the strength of the relationship varies by age and model specification. The presence of a biological mother in the household shapes the BMI trajectory differently for males and females.
Keywords
BMI, adolescent, overweight, maternal
Introduction
During adolescence and young adulthood, important health and social problems either begin or peak. Research shows that weight trends established in adolescence perpetuate throughout life. By examining and identifying the primary correlates of high weight in adolescence, the ability to treat and prevent weight-related health maladies as adults increases.
Using 15 years of panel data from the National Longitudinal Survey of Youth 1997 (NLSY97), this study assesses the genetic, environmental and household correlates of body mass index (BMI). Analysis focuses on the impact of maternal BMI on youth BMI growth as they age into young adults questioning the relative influence of the biological and non-biological mothers. Two different model specifications—an ordinary least squares (OLS) dummy variable and disaggregated generalized linear model (GLM)—evaluate the influence of maternal, environmental, demographic and household factors on BMI. Growth trajectories show the differential developmental pattern of respondents with biological and non-biological mothers.
This paper begins by discussing what is known about BMI and BMI growth in Section 1. Section 2 describes the data, methodology and estimation strategy. Section 3 presents the empirical and Section 4 discusses implications. In Section 5, major conclusions and areas for future research are discussed.
Evidence from related literature
BMI growth varies by genetic and environmental characteristics with studies showing significant heterogeneity [1]. Rates vary by racial/ethnic group both before and after achievement of full growth [2]. Freedman, et al[3] concluded that black youth experience higher BMI growth, but Markowitz and Cosminsky[4] found the highest rates among Hispanics [5]. Ethnic and racial effects can manifest through environmental characteristics. Neighborhoods perceived to be unsafe lead to restrictions on children's outdoor activities thus steepening the trajectories [6]. High BMI has been associated with major technological, life style, eating and activity characteristics [7-9].
Research exploring the impacts of parental behavior on adolescent weight found extensive variation by educational level and employment status1,2[7,10-15]. Exposure to maternal overweight increases adolescent obesity rates as did low education and certain demographics [10].
Results summary
Results show that age, race/ethnicity and maternal BMI significantly impact BMI growth. Hispanic and black males and females, respectively, have significantly higher BMI growth than other groups (consistent with Kline and Tobias) [2]. Maternal BMI has a large, positive correlation with adolescent BMI growth, also seen by Classen and Hokayem[10], but the relationship is smaller for non-biological mothers than that biological mothers. Females without a biological mother and males with a biological mother have higher projected growth—supported by literature citing different parental relationships for males and females and varying parental interactions by the sex of the child and parent [16,17].
[1]Maternal education is used in this study as a proxy for income rather than employment status.
[2]Sources also cite poor dietary habits, nutrition label use and health production.
Methods
Empirical models
BMI growth is analyzed using an OLS dummy variable regression, a generalized linear model and a multi-level growth estimation. The OLS model uses independent variable controls for demographic and environmental characteristics and distinguishes biological and non-biological mothers using a dummy variable equaling one for non-biological mothers and zero otherwise. This dummy variable is also interacted with the log of mother’s BMI variable as seen in Equation 1.


BMIitand BMIit-1represent BMI in the current year (t) and the previous year (t-1)for individual i.  is the rate of BMI change while
  is age in the previous period. They are interacted,
  , to account for time related growth effects of BMI. Finally, μitis the error term. Equation 1 is estimated separately for males and females then it is re-estimate dividing males and females into two age groups—12-20 and 21-32.
The GLM (Equality 2) fits the longitudinal panel by accounting for repeated measures with time dependency. By specifying an initial working correlation structure, GLM iteratively re-fits the residuals with maximum likelihood. Biological and non-biological relationships are analyzed separately then re-estimated separately for adolescents and adults. (Equation 2).


Finally, Multi-level change models estimate the BMI growth trajectories for black, white and Hispanic males and females with biological and non-biological.
Data
Data for both models comes from the first 15 rounds of the NLSY97—a longitudinal panel that follows a sample of 8,984 American youth—from 1997 to 2011. After 2011, the survey became biennial. While, 2013 and 2015 are available, the sample focuses only on those consecutive survey years.
BMI
BMI is calculated from self-reported height and weight in each consecutive survey year. BMI is highly correlated with body fat and can be used to classify individuals into weight categories [18]. Among adults, BMI is a satisfactory measure of body fat when compared to other measures of body fatness particularly accurate when measurements are compared to values of similar race/ethnicity (ie, skin-fold tests)3[3]. Among adolescents, however, the Centers for Disease Control (CDC) recommends interpreting child and adolescent BMI as percentiles representing where BMI falls in a distribution of other adolescents of similar sex and age4. For example, a 10-year-old boy who is 56 inches tall and weighs 102 pounds would have a BMI of 22.9 kg/m2, placing him in the 95th BMI percentile—obese.
Prior to age 20, normal or healthy weight is defined as a BMI between the 5th and 85th percentile, while later in life BMI is interpreted as a value using standard weight status categories. The adult categories are the same for men and women of all ages and correspond to the adolescent percentiles (Table 1).
Table 1.Sample Distribution Before and After Data Cleaning.
|
NLSY97: Number of Respondents in each Subgroup Before and After Cleaning
|
|
Subgroup
|
N
|
Percent
|
Cum Frequency
|
Cum Percent
|
|
Pre-Cleaning
|
|
Total
|
8,984
|
100
|
8,984
|
100
|
|
Missing
|
83
|
1
|
83
|
0.92
|
|
Black Female
|
1,166
|
13
|
1,249
|
13.9
|
|
Black Male
|
1,169
|
13
|
2,418
|
26.91
|
|
Hispanic Female
|
924
|
10
|
3,342
|
37.2
|
|
Hispanic Male
|
977
|
11
|
4,319
|
48.07
|
|
White Female
|
2,252
|
25
|
6,571
|
73.14
|
|
White Male
|
2,413
|
27
|
8,984
|
100
|
|
Total Male
|
4,599
|
51.19
|
4,599
|
51.19
|
|
Total Female
|
4,385
|
48.81
|
8,984
|
100
|
|
Post-Cleaning
|
|
Total
|
4,205
|
100
|
4,205
|
100
|
|
Missing
|
44
|
1.05
|
44
|
1.05
|
|
Black Female
|
524
|
12.46
|
568
|
13.51
|
|
Black Male
|
475
|
11.29
|
1,043
|
24.8
|
|
Hispanic Female
|
399
|
9.49
|
1,442
|
34.29
|
|
Hispanic Male
|
398
|
9.47
|
1,840
|
43.76
|
|
White Female
|
1,144
|
27.21
|
2,984
|
70.97
|
|
White Male
|
1,221
|
29.04
|
4,205
|
100
|
|
Total Male
|
2,121
|
50.44
|
2,121
|
50.44
|
|
Total Female
|
1,084
|
49.56
|
4,205
|
100
|
Sample
Figure 1 shows average BMI for white, black, and Hispanic males and females. BMI increases over the panel. As expected, increases are steeper at young ages due biological growth and maturity and the slopedecreases with age, but BMI continues to increase—likely due to increases in body weight unrelated to skeletal or muscular growth. Figure 2 shows thatHispanic males and black females shower steeper BMI growth than other groups and they continue to have the highest BMI in all panel years [Figure 1 and 2].
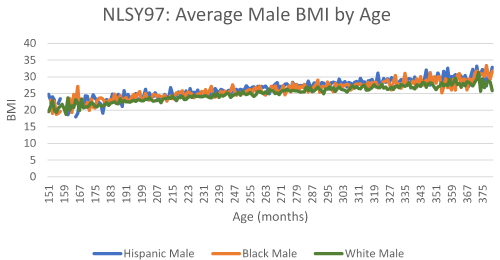
Figure 1. Average Male BMI by Age.
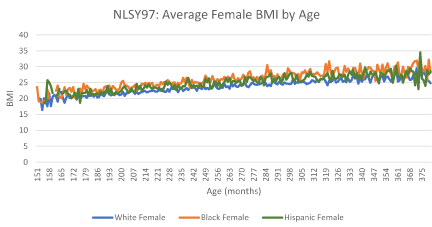
Figure 2.Average Female BMI by Age.
To calculate BMI, respondents need a height and weight value. To maintain a panel balance, respondents without a BMI in each year were removed. Remaining data was cleaned using a series of flags to indicate errant, inconsistent or illogical height and weight values. If height was missing, it was imputed from nearby observations whenever possible5. Summing the flags and removing errant values, left 4,205 respondents with a distribution similar to the original (Table 1). Minimum BMI is 12.5—underweight—and maximum BMI value is 55—overweight or obese (Table 2). Average BMI is 25 and 26 for men and women respectively while BMI growth averages between 0.7 and 0.1 annually [Table 1 and 2].
Table 2.Sample Distribution Before and After Data Cleaning.
|
NLSY97: Covariate Means 1997-2011 by Gender
|
|
Variable
|
N
|
Mean
|
Std Dev
|
Minimum
|
Maximum
|
|
Male
|
|
BMIt
|
29,786
|
25.829
|
5.207
|
14.100
|
54.800
|
|
BMI Growtht
|
29,786
|
0.010
|
0.084
|
-0.860
|
0.385
|
|
Aget (mon)
|
29,786
|
272.637
|
51.947
|
146.000
|
387.000
|
|
Black
|
29,786
|
0.220
|
0.415
|
0.000
|
1.000
|
|
Hispanic
|
29,786
|
0.188
|
0.391
|
0.000
|
1.000
|
|
HH Sizet
|
29,783
|
3.509
|
1.668
|
1.000
|
19.000
|
|
Income/Poverty Ratiot
|
21,341
|
380.971
|
376.917
|
0.000
|
3227.000
|
|
Urbant
|
29,786
|
0.746
|
0.435
|
0.000
|
1.000
|
|
Northeastt
|
29,786
|
0.159
|
0.366
|
0.000
|
1.000
|
|
Southt
|
29,786
|
0.361
|
0.480
|
0.000
|
1.000
|
|
Mom Edu Less then HS1997
|
27,738
|
0.189
|
0.391
|
0.000
|
1.000
|
|
Mom Edu HS1997
|
27,738
|
0.357
|
0.479
|
0.000
|
1.000
|
|
Mother's BMI1997
|
22,200
|
27.039
|
6.240
|
15.114
|
53.701
|
|
Non-biological Mother1997
|
25,738
|
0.046
|
0.210
|
0.000
|
1.000
|
|
Female
|
|
BMIt
|
27,830
|
24.859
|
5.724
|
12.500
|
54.900
|
|
BMI Growtht
|
27,830
|
0.007
|
0.089
|
-0.978
|
0.801
|
|
Aget (mon)
|
27,830
|
271.814
|
52.098
|
147.000
|
385.000
|
|
Black
|
27,830
|
0.247
|
0.431
|
0.000
|
1.000
|
|
Hispanic
|
27,830
|
0.191
|
0.393
|
0.000
|
1.000
|
|
HHSizet
|
27,829
|
3.636
|
1.719
|
1.000
|
15.000
|
|
Income/Poverty Ratiot
|
19,950
|
348.019
|
359.689
|
0.000
|
3227.000
|
|
Urbant
|
27,830
|
0.765
|
0.424
|
0.000
|
1.000
|
|
Northeastt
|
27,830
|
0.158
|
0.365
|
0.000
|
1.000
|
|
Southt
|
27,830
|
0.384
|
0.486
|
0.000
|
1.000
|
|
Mom Edu Less then HS1997
|
26,393
|
0.203
|
0.402
|
0.000
|
1.000
|
|
Mom Edu HS1997
|
26,393
|
0.337
|
0.473
|
0.000
|
1.000
|
|
Mother's BMI1997
|
21,822
|
26.605
|
5.720
|
16.306
|
53.246
|
|
Non-biological Mother1997
|
24,922
|
0.051
|
0.220
|
0.000
|
1.000
|
3Racial and ethnic differentials are reduced but not eliminated.
4CDC Data Tables for BMI by Age Charts,http://www.cdc.gov/growthcharts/html_charts/bmiagerev.htm.
5Since full height is likely achieved early in the sample for most respondents, imputations would not likely bias data.
Covariates
Age is age in the prevailing survey year measured in months. Respondents range in age from 146 to 204 (12 to 17 years) in the first year of the survey and 300 to 387 (25 to 32 years) in 2011. BMI increases with both natural growth with age and weight gain; however, rates differ by race and gender [19]. Household size quantifies the number of household members with an average of 3.5. Household characteristics have been shown to influence BMI through food availability, expenditure and behavior [20]. Participation in food programs, nutrient intake and income also vary by household [21].
Higher weights are found among adults in rural areas of the south, but race vary by race/ethnicity [22] While moving to a dense area often results in weight loss, high BMI individuals are unlikely to choose these areas [23]. Urban residence comprises 75 percent of the sample while region is translated into dummy variables for south and northeastern residence.
While environmental effects are generally small, state and local level price effects can impact adolescent weight [24-26]. Income/poverty ratio compares the gross household income to the federal poverty level in the previous year, taking household size into account. A ratio below one indicates income below poverty, while a ratio above one indicates income above poverty. The average ratio is between five and six—above the poverty threshold. While socioeconomic disparities in overweight have diminished overtime, they vary considerably by race, sex and age [27].
In the first year of the survey, 1997, a parental figure in the household (most often the biological mother) fills out the extensive Parent Questionnaire. In this questionnaire, the responding parents classify their relationship with the respondent and provides information on themselves, their health, family history, relationship with the respondent, household circumstances and their height and weight. This information enables maternal BMI to be calculated. While this information is only available in a single year, the important genetic andmaternal influences it captures makes it valid for inclusion in the model. Presence of biological and non-biological mothers in the sample allows the impact of both to be analyzed.
Maternal education is also obtained in the Parent Questionnaire and is translated into two dummy variables: less than high school and high school completion. Less than 20 percent of mothers in the sample have less than a high school education, while 35 percent have completed high school.
Limitations
While care was taken in data cleaning and model selection, this work is not without limitations. First, including a lagged dependent variable often raises concerns of estimation bias. The decision to include previous BMI ([lnBMI]_(it-1)) in the model was theoretical as studies have shown that it is the most import predictor of current BMI [28] and controls for heteroscedasticity [29]. Robustness tests were performed to ensure that results were not biased by inclusion and results were unchanged.
Second, the data itself has several limitations. Only six percent of mothers in the sample are non-biological providing only a small comparison group and maternal BMI is only available in 1997. Additionally, the data contains no indicator of how often, if at all, children without a biological mother in the household interact with their biological mothers. Periodic contact could influence findings.
Finally, biological maternal status raises endogeneity concerns— frequently a problem in growth studies. In the absence of a viable instrument, the model controls for individual fixed-effects by specifying BMI in period t as a function of family and contextual effects, unmeasured parent and respondent variables that are constant over time, unmeasured impacts that vary over time and an error term [30]. Fixed-effects models are still subject to bias from time-varying respondent-level unmeasured variables, but the sufficiently long panel combined with random effects and age controls help account for unmeasured variables whose values change over time in specific ways [31].
Results
OLS growth model
Full sample OLS results (Table 3) show that BMI growth is age dependent—higher growth observed at younger ages—and correlates primarily with lagged BMI level, race, ethnicity and maternal BMI. Being black, for women, and being Hispanic, for men, increases BMI growth, and estimates are unaffected by environmental and socioeconomic characteristics (consistent with Cawley 2004) [11]. The maternal BMI impact on respondent BMI growth is positive, significant [Table 3].
Table 3. OLS Regression by Gender NLSY 1997-2011.
|
NLSY97: Pooled Regression Model by Gender
|
|
|
Male
|
Female
|
|
|
Model Fit
|
|
QIC
|
14201.08
|
|
14985.73
|
|
|
N
|
29,974
|
|
29,361
|
|
|
Results
|
|
Variable
|
Parameter
|
Std Err
|
Parameter
|
Std Err
|
|
Intercept
|
0.2723***
|
0.0721
|
0.1694***
|
0.0642
|
|
lnBMIt-1
|
-0.1088***
|
0.0227
|
-0.0703***
|
0.0206
|
|
Aget-1
|
-0.0035
|
0.0029
|
-0.0018
|
0.0026
|
|
lnBMIt-1*Aget-1
|
0.0011
|
0.0009
|
0.0005
|
0.0008
|
|
Hispanic
|
0.005***
|
0.0016
|
0.0006
|
0.0018
|
|
Black
|
-0.003*
|
0.0017
|
0.0033**
|
0.0016
|
|
Household Sizet-1
|
0.0006*
|
0.0004
|
-0.0011***
|
0.0004
|
|
Income/Poverty Ratiot-1
|
0.001*
|
0.0006
|
0.0007
|
0.0006
|
|
Urbant-1
|
-0.0028**
|
0.0013
|
0.0005
|
0.0015
|
|
Northeastt-1
|
0.0022
|
0.0017
|
0.0012
|
0.0019
|
|
Southt-1
|
-0.001
|
0.0013
|
0.0013
|
0.0013
|
|
Mothers Education Less than High School1997
|
0.002
|
0.0017
|
0.0019
|
0.0019
|
|
Mothers Education High School1997
|
0.0022*
|
0.0013
|
0.0008
|
0.0013
|
|
lnMothersBMI1997
|
0.026***
|
0.0031
|
0.0213***
|
0.0034
|
|
Non BiologicalMom1997
|
0.0549
|
0.0443
|
0.0465
|
0.0393
|
|
lnMothersBMI1997*Non BiologicalMom1997
|
-0.0182
|
0.0137
|
-0.0141
|
0.0119
|
|
Dependent Variable: lnBMIt-lnBMIt-1=BMI Growth Rate
|
|
Source: NLSY 1997
|
|
|
|
|
Statistical Significance: * (0.10),** (0.05), *** (0.01)
|
GLM Growth Model: More sophisticated empirical work shows slightly different results when respondents with biological and non-biological mothers are estimated separately (Table 4). Previous BMI and race/ethnicity remain significant. Maternal BMI is significant but only for biological mothers, not non-biological mothers [Table 4].
Table 4.GLM Regression by Gender: Separate Analysis for Biological and Non-Biological Mothers.
|
Singular Regression with Covariates by Gender NLSY 1997-2011
|
|
|
Male
|
Female
|
Male
|
Female
|
|
|
Model Fit
|
Model Fit
|
|
QIC
|
13575.284
|
|
14357.067
|
|
633.5786
|
|
637.078
|
|
|
N
|
22098
|
|
22603
|
|
1497
|
|
1441
|
|
|
|
Biological Mother
|
Non-biological Mother
|
|
Variable
|
Parameter
|
Std Err
|
Parameter
|
Std Err
|
Parameter
|
Std Err
|
Parameter
|
Std Err
|
|
Intercept
|
0.2642***
|
0.0735
|
0.1779***
|
0.0657
|
0.5449
|
0.3683
|
0.0104
|
0.2952
|
|
lnBMIt-1
|
-0.1062***
|
0.0231
|
-0.0723***
|
0.0211
|
-0.1909*
|
0.1132
|
-0.0233
|
0.0983
|
|
Aget-1
|
-0.003
|
0.003
|
-0.0023
|
0.0027
|
-0.0131
|
0.0143
|
0.0098
|
0.0129
|
|
lnBMIt-1*Aget-1
|
0.001
|
0.0009
|
0.0007
|
0.0009
|
0.0042
|
0.0045
|
-0.003
|
0.0042
|
|
Hispanic
|
0.0046***
|
0.0016
|
0.0007
|
0.0018
|
0.0154*
|
0.0085
|
0.0032
|
0.0154
|
|
Black
|
-0.0026
|
0.0017
|
0.0034**
|
0.0017
|
-0.0107
|
0.0071
|
0.0013
|
0.0068
|
|
Household Sizet-1
|
0.0007*
|
0.0004
|
-0.0011***
|
0.0004
|
-0.0011
|
0.0014
|
-0.0028
|
0.0017
|
|
Income/Poverty Ratiot-1
|
0.0009
|
0.0006
|
0.0007
|
0.0006
|
0.0027
|
0.0033
|
0.0022
|
0.0029
|
|
Urbant-1
|
-0.0024*
|
0.0013
|
0.0006
|
0.0015
|
-0.0091*
|
0.0056
|
-0.0028
|
0.0089
|
|
Northeastt-1
|
0.0029*
|
0.0017
|
0.0011
|
0.0019
|
-0.0246
|
0.0108
|
-0.0007
|
0.0145
|
|
Southt-1
|
-0.001
|
0.0013
|
0.0011
|
0.0013
|
-0.0064
|
0.0058
|
0.0092
|
0.0078
|
|
Mothers Education Less than High School1997
|
0.0023
|
0.0017
|
0.0016
|
0.002
|
0.0001
|
0.0062
|
0.0053
|
0.01
|
|
Mothers Education High School1997
|
0.0021
|
0.0013
|
0.0008
|
0.0014
|
0.0023
|
0.0059
|
0.0008
|
0.0078
|
|
lnMothersBMI1997
|
0.0259***
|
0.0032
|
0.0208***
|
0.0034
|
0.0219*
|
0.0118
|
0.0205
|
0.015
|
|
Dependent Variable: lnBMIt-lnBMIt-1=BMI Growth Rate
|
|
Source: NLSY 1997
|
|
Statistical Significance: * (0.10), ** (0.05), *** (0.01)
|
Tables 5 and 6 show the OLS and GLM models disaggregated into adolescents—age 12 to 20—and adults—age 21 to 20. Both suggest positive, significant maternal BMI correlations at younger ages, but as respondents age, non-biological maternal impact loses significance, while the biological maternal impact remains strong.
Table 5. OLS Regression by Gender and Age NLSY 1997-2011.
|
Panel Regression with Covariates by Gender NLSY 1997-2011
|
|
|
Male
|
Female
|
Male
|
Female
|
|
|
Model Fit
|
Model Fit
|
|
QIC
|
2854.9456
|
|
3120.8015
|
|
11352.015
|
|
11876.648
|
|
|
N
|
10,712
|
|
10,409
|
|
19,262
|
|
18,952
|
|
|
|
Results Age 12-20
|
Results Age 21-32
|
|
Variable
|
Parameter
|
Std Err
|
Parameter
|
Std Err
|
Parameter
|
Std Err
|
Parameter
|
Std Err
|
|
Intercept
|
0.2152*
|
0.1231
|
-0.0955
|
0.1237
|
0.4466***
|
0.0904
|
0.4128***
|
0.0906
|
|
lnBMIt-1
|
-0.0944**
|
0.0399
|
0.0049
|
0.041
|
-0.1489***
|
0.0281
|
-0.1347***
|
0.0283
|
|
Aget-1
|
0.0074
|
0.0057
|
0.0181***
|
0.006
|
-0.0159***
|
0.0037
|
-0.015***
|
0.0037
|
|
lnBMIt-1*Aget-1
|
-0.0022
|
0.0019
|
-0.0059***
|
0.002
|
0.0047***
|
0.0011
|
0.0045***
|
0.0012
|
|
Hispanic
|
0.0086**
|
0.0041
|
0.0001
|
0.0044
|
0.0027**
|
0.0014
|
0.0006
|
0.0017
|
|
Black
|
-0.0025
|
0.0045
|
0.007*
|
0.004
|
-0.0027*
|
0.0014
|
0.0011
|
0.0015
|
|
Household Sizet-1
|
0.0021**
|
0.001
|
-0.0008
|
0.001
|
0
|
0.0003
|
-0.0011**
|
0.0004
|
|
lnIncome/Poverty Ratiot-1
|
0.001
|
0.0017
|
0.0001
|
0.0013
|
0.0009
|
0.0006
|
0.0008
|
0.0006
|
|
Urbant-1
|
-0.0009
|
0.0032
|
-0.0075**
|
0.0034
|
-0.0028**
|
0.0011
|
0.0027*
|
0.0015
|
|
Northeastt-1
|
0.0034
|
0.0037
|
-0.0029
|
0.0044
|
0.002
|
0.0015
|
0.0016
|
0.0018
|
|
Southt-1
|
-0.0046
|
0.0035
|
0.0015
|
0.0032
|
0.0004
|
0.0011
|
0.0009
|
0.0012
|
|
Mothers Education Less than High School1997
|
-0.0004
|
0.0044
|
0.0037
|
0.0046
|
0.0022
|
0.0014
|
0.0005
|
0.0018
|
|
Mothers Education High School1997
|
0.0004
|
0.0033
|
-0.0049
|
0.0033
|
0.0018*
|
0.0011
|
0.0024**
|
0.0012
|
|
lnMothers BMI1997
|
0.0258***
|
0.0081
|
0.0357***
|
0.0085
|
0.019***
|
0.0024
|
0.0122***
|
0.003
|
|
Non BiologicalMom1997
|
-0.0012
|
0.0712
|
0.0521
|
0.0993
|
0.0603
|
0.0501
|
0.0302
|
0.0353
|
|
lnMothersBMI1997*Non BiologicalMom1997
|
-0.0011
|
0.0214
|
-0.0165
|
0.0303
|
-0.0193
|
0.0156
|
-0.009
|
0.0108
|
|
Dependent Variable: lnBMIt-lnBMIt-1=BMI Growth Rate
|
|
Source: NLSY 1997
|
|
Statistical Significance: * (0.10), ** (0.05), *** (0.01)
|
Table 6. GLM Regression by Age: Separate Analysis for Biological and Non-Biological Mothers.
|
Singular Regression with Covariates by Gender and Age NLSY 1997-2011
|
|
Male
|
|
|
Biological Mother
|
Non-biolgoical Mother
|
Biological Mother
|
Non-biolgoical Mother
|
|
QIC
|
2711.8776
|
|
150.2434
|
|
10868.57
|
|
489.0785
|
|
|
N
|
7,935
|
|
544
|
|
14,163
|
|
953
|
|
|
|
Age 12-20
|
Age 21-32
|
|
Variable
|
Parameter
|
Std Err
|
Parameter
|
Std Err
|
Parameter
|
Std Err
|
Parameter
|
Std Err
|
|
Intercept
|
0.228*
|
0.1278
|
-0.1191
|
0.4606
|
0.4345***
|
0.091
|
0.7178
|
0.5242
|
|
lnBMIt-1
|
-0.0982**
|
0.0414
|
-0.0148
|
0.136
|
-0.1444***
|
0.0282
|
-0.2388
|
0.1629
|
|
Aget-1
|
0.0063
|
0.0059
|
0.0281
|
0.0188
|
-0.0155***
|
0.0037
|
-0.0241
|
0.02
|
|
lnBMIt-1*Aget-1
|
-0.0018
|
0.0019
|
-0.009
|
0.0059
|
0.0045***
|
0.0011
|
0.0075
|
0.0064
|
|
Hispanic
|
0.0088**
|
0.0042
|
-0.0018
|
0.0171
|
0.0023*
|
0.0014
|
0.0209**
|
0.0093
|
|
Black
|
-0.0028
|
0.0047
|
-0.009
|
0.0154
|
-0.0022
|
0.0014
|
-0.0088
|
0.0067
|
|
Household Sizet-1
|
0.0024***
|
0.001
|
-0.0022
|
0.0031
|
0
|
0.0003
|
-0.0006
|
0.0017
|
|
Income/Poverty Ratiot-1
|
0.0009
|
0.0017
|
0.003
|
0.0054
|
0.0009
|
0.0006
|
0.0038
|
0.0035
|
|
Urbant-1
|
-0.0004
|
0.0033
|
-0.0057
|
0.0125
|
-0.0026**
|
0.0012
|
-0.0095*
|
0.0054
|
|
Northeastt-1
|
0.0036
|
0.0039
|
-0.004
|
0.0168
|
0.0028*
|
0.0015
|
-0.0299**
|
0.0118
|
|
Southt-1
|
-0.0048
|
0.0036
|
0.0037
|
0.015
|
0.0006
|
0.0011
|
-0.0068
|
0.006
|
|
Mothers Education Less than High School1997
|
0
|
0.0046
|
-0.0098
|
0.0166
|
0.0024
|
0.0014
|
0.0001
|
0.0069
|
|
Mothers Education High School1997
|
0.0006
|
0.0034
|
-0.0057
|
0.0163
|
0.0016
|
0.0011
|
0.003
|
0.0056
|
|
lnMothersBMI1997
|
0.0248**
|
0.0082
|
0.0583**
|
0.0284
|
0.0188***
|
0.0025
|
0.0162
|
0.0125
|
|
Female
|
|
|
Biological Mother
|
Non-biolgoical Mother
|
Biological Mother
|
Non-biolgoical Mother
|
|
QIC
|
2970.6084
|
|
157.6573
|
|
11396.025
|
|
481.9742
|
|
|
N
|
8,047
|
|
504
|
|
14,556
|
|
937
|
|
|
|
Age 12-20
|
Age 21-32
|
|
Variable
|
Parameter
|
Std Err
|
Parameter
|
Std Err
|
Parameter
|
Std Err
|
Parameter
|
Std Err
|
|
Intercept
|
-0.0427
|
0.1231
|
-1.1403*
|
0.6531
|
0.4099***
|
0.0919
|
0.4876
|
0.5031
|
|
lnBMIt-1
|
-0.0124
|
0.0408
|
0.3963*
|
0.2131
|
-0.1327***
|
0.0287
|
-0.1836
|
0.158
|
|
Aget-1
|
0.0154*
|
0.0059
|
0.0718**
|
0.0337
|
-0.0149***
|
0.0037
|
-0.0135
|
0.0199
|
|
lnBMIt-1*Aget-1
|
-0.005**
|
0.002
|
-0.024**
|
0.0112
|
0.0045***
|
0.0012
|
0.0047
|
0.0062
|
|
Hispanic
|
0.0011
|
0.0044
|
-0.0155
|
0.0294
|
0.0005
|
0.0017
|
0.0135
|
0.0108
|
|
Black
|
0.0074*
|
0.0041
|
0.0085
|
0.0185
|
0.0013
|
0.0015
|
-0.0005
|
0.0063
|
|
Household Sizet-1
|
-0.0006
|
0.001
|
-0.0052
|
0.004
|
-0.0011***
|
0.0004
|
-0.002
|
0.0017
|
|
|
-0.0001
|
0.0013
|
0.0032
|
0.0073
|
0.0008
|
0.0006
|
0.0022
|
0.003
|
|
Urbant-1
|
-0.0069**
|
0.0034
|
-0.0117
|
0.0169
|
0.0025*
|
0.0015
|
0.002
|
0.0075
|
|
Northeastt-1
|
-0.001
|
0.0044
|
-0.0605
|
0.0321
|
0.0011
|
0.0018
|
0.0246*
|
0.0142
|
|
Southt-1
|
0.0023
|
0.0033
|
-0.0138
|
0.0164
|
0.0005
|
0.0012
|
0.0161**
|
0.007
|
|
Mothers Education Less than High School1997
|
0.0031
|
0.0046
|
0.0185
|
0.0226
|
0.0004
|
0.0018
|
-0.0006
|
0.0086
|
|
Mothers Education High School1997
|
-0.005
|
0.0033
|
-0.0015
|
0.0189
|
0.0024*
|
0.0013
|
0.002
|
0.0069
|
|
lnMothersBMI1997
|
0.0349***
|
0.0085
|
-0.0005
|
0.037
|
0.0119***
|
0.003
|
0.0178
|
0.0136
|
|
Dependent Variable: lnBMIt-lnBMIt-1=BMI Growth Rate
|
|
Source: NLSY 1997
2021 Copyright OAT. All rights reserv
|
|
Statistical Significance: * (0.10), ** (0.05), *** (0.01)
|
Growth trajectories
Figures 3 and 4show projected male and female BMI growth by subgroup. Hispanics and black have the highest growth among males and females respectively. Females with non-biological mothers have steeper growth than those with a biological mother—true within all subgroups. Males with a biological mother have higher growth than the comparison group(Table 3 and 4).
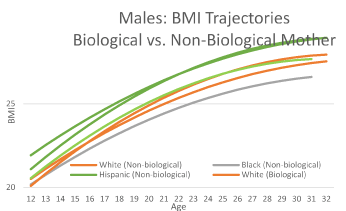
Figure 3.Male BMI Trajectory.
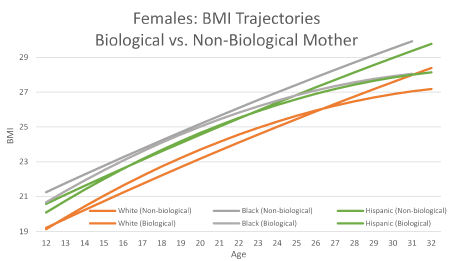
Figure 4. Female BMI Trajectory.
Discussion
Both OLS and GLM models prove that the higher a mother’s BMI, the faster a respondent’s BMI grows, but lack of significance for the non-biological mother dummy and interaction in the simplistic OLS specification would suggest no difference between the BMI growth impact of biological and non-biological mothers. This implies that the biological element is less important than other maternal attributes.
Testing this result with a more sophisticated GLM regression and running models separately for adolescents and adults shows that genetic impacts between adolescents and their mothers are strong and remain significant throughout one’s life, but domestic influences of maternal care and nurturing diminish with age.
Differences support the assumption that that inherited biological traits are larger correlates than the intrinsic attributes of non-biological mothers. However, changes in other characteristics in the non-biological sample implies additional differences between these households. While outside the scope of this analysis, empirical results indicate that households with a non-biological mother systematically differ from those with biological mothers in additional ways.
Trajectory differences indicate that the maternal relationship plays a role in BMI growth. While male and female differences appear surprising, they are consistent with evidence that parental influences, while significant, manifest differently for males and females [32]. Psychological studies highlight differences in parental relationship by gender.
Conclusion
This study uses OLS and GLM specifications to evaluate BMI correlates for adolescents as they age into adults. In general, results reveal that BMI development is impacted primarily by age and previous BMI, with household and environmental characteristics showing no significant correlation. Age is highly significant and negatively related to BMI growth, suggesting higher growth at younger ages—those years characterized by biological development—and slower growth in later years—attributable to later life weight gain.
Results show strong, positive relationships between BMI growth and maternal BMI, implying that a higher a mother’s BMI, the faster the growth rate of the child. Lack of significance of the non-biological mother dummy and interaction, indicates no differences in growth between respondents with biological and non-biological mothers. However, when respondents with biological and non-biological mother are analyzed separately, results show a stronger relationship between mothers and children with a biological connection.
When the sample is further separated by age into adolescents (≤20) and adults (>20), results differ. The biological mother’s BMI relationship is strong at all ages, but the non-biological mother’s BMI relationship is only significant when respondents are young. This suggests the maternal impact is transmitted through shared household and genetic environments, but, when the household is no longer shared, the non-biological impact fades.
Extended the scope to examine maternal impact on BMI growth trajectories, indicates that Females with non-biological mothers have higher projected BMI growth than those with a biological mother, but males with biological mothers have higher comparative trajectories. Parental relationships among adolescents and teens are shown to vary by gender with young females relying on maternal figures to establish their self-esteem, habits and goals, while males look to some paternal or other male figures to fill these needs [33,34].
These results are insightful, but do not provide a complete picture of youth BMI growth and the various influences. This study explored a variety of circumstantial, biological and environmental correlation, but there remains much unexplained BMI growth variation. There are likely other differences in households with and without biological mothers left unexplained. These differences could contribute to the different BMI growth rates and explain other intrinsic differences. This paper uses primarily extrinsic household and environmental covariates, ignoring the myriad of psychological, emotional and social changes that occur during adolescence and young adulthood. Further exploration of these factors in addition to other household members is needed to provide insight into BMI growth.
References
- Nonnemaker JM, Morgan-Lopez AA, Pais JM, Finkelstein EA (2009) Youth BMI trajectories: evidence from the NLSY97. Obesity (Silver Spring) 17: 1274-1280.[Crossref]
- Kline B,Tobias J (2014) Explaining Trends in Body Mass Index Using Demographic Counter factuals. Econometric Reviews33: 172-196.
- Freedman D, Khan K, Serdula M, Ogden C, DietzW (2006) Racial and Ethnic Differences in Secular Trends for Childhood BMI, Weight, and Height. Journal of Obesity14: 301-308.
- Markowitz DL, Cosminsky S (2005) Overweight and stunting in migrant Hispanic children in the USA. Econ Hum Biol3: 215-240.[Crossref]
- Van Hook J, K Balistreri (2007) Immigrant generation, socioeconomic status, and economic development of countries of origin: A longitudinal study of body mass index among children. Social Science and Medicine 65: 976-989.
- Cecil-Karb R, Grogan-Kaylor R (2009) Childhood Body Mass Index in Community Context: Neighborhood Safety, Television Viewing, and Growth Trajectories of BMI. Health and Social Work34: 169–177.
- Anderson P,Butcher K, Levine P (2003) Economic Perspectives on childhood obesity. Economic Perspectives. Federal Reserve Bank of Chicago 3: 30-48.
- Lakdawalla D, PhilipsonT, BhattacharyaJ (2005) Welfare-Enhancing Technological Change and the Growth of Obesity. American Economic Review95: 253-257.
- Council on Communications and Media, Strasburger VC (2011) Children, adolescents, obesity, and the media. Pediatrics128: 201-208.[Crossref]
- Classen T, Hokayem C (2005) Childhood influences on youth obesity. Econ Hum Biol3: 165-187.[Crossref]
- Cawley J (2004) An economic framework for understanding physical activity and eating behaviors. American Journal of Preventive Medicine27: 117-125.
- Ruhm CJ (2008) Maternal Employment and Adolescent Development. Labour Econ 15: 958-983.[Crossref]
- Fertig A, GlommG,Tchernis R (2009) The connection between maternal employment and childhood obesity: inspecting the mechanisms. Review of Economics of the Household7: 227–255.
- Golan M, Crow S (2004) Parents are key players in the prevention and treatment of weight-related problems. Nutrition Reviews62: 39–50.
- Nayga R, Rodolfo M (2000) Schooling, health knowledge and obesity. Journal of Applied Economics32: 815-822.
- DropplemanLF, Schaefer ES (1963) Boys' and girls' reports of maternal and paternal behavior. J AbnormPsychol67: 648-654.[Crossref]
- Maccoby EE (1990) Gender and relationships. A developmental account. Am Psychol45: 513-520.[Crossref]
- Flegal K, Shepherd J, Looker A, Graubard B,Borrud L, et al. (2009) Comparisons of Percentage Body Fat, Body Mass Index, Waist Circumference and Waist-Stature Ratio in Adults. American Journal of Clinical Nutrition 89: 500-508.
- Gallagher D,Visser M, Sepulveda D, Pierson R, Harris T, et al. (1996) How Useful is Body Mass Index for Comparison of Body Fatness across Age, Sex and Ethnic Groups? American Journal of Epidemiology143: 228-239.
- Corral I, LandrineH, Zhao L (2014) Residential Segregation and Obesity among a National Sample of Hispanic Adults. Journal of Health Psychology19: 503-508.
- Jacobs Starkey L, Gray-Donald K, Kuhnlein HV (1999) Nutrient intake of food bank users is related to frequency of food bank use, household size, smoking, education and country of birth. J Nutr 129: 883-889.[Crossref]
- Jackson E,Doescher M,Jerant A, Hart G (2005) A National Study of Obesity Prevalence and Trends by Type of Rural County. The Journal of Rural Health21: 140–148.
- PlantingaA, Bernell S (2007)The association between urban sprawl and obesity: is it a two-way street? Journal of Regional Science47: 857-879.
- Sen B, Memmemeyer S, Gary L (2009) The Relationship Between Neighborhood Quality and Obesity Among Children. NBER Working Paper.
- Powell LM, Chriqui J, Chaloupka FJ (2009) Associations between state-level soda taxes and adolescent body mass index. J Adolesc Health 45: S57-63.[Crossref]
- Cawley J, Liu F (2012) Maternal employment and childhood obesity: a search for mechanisms in time use data. Econ Hum Biol10: 352-364.[Crossref]
- Wang Y, ZhangQ (2006) Are American children and adolescents of low socioeconomic status at increased risk of obesity? Changes in the association between overweight and family income between 1971 and 2002. American Journal of Clinical Nutrition84: 707-716.
- MagareyA, DanielsL,BoultonT, CockingtonR (2003)Predicting obesity in early adulthood from childhood and parental obesity. International Journal of Obesity27: 505–513.
- Albouy V, Davezies L,Debrand T (2010) Health Expenditure Models: A Comparison Using Panel Data. Economic Modelling4: 791-803.
- Dehejia R, Wahba S (1999) Causal effects in non-experimental studies: Re-evaluating the evaluation of training programs. Journal of the American Statistical Association94: 1053–1062.
- Duncan G, Magnuson K, Ludwig J (2004) The Endogeneity Problem in Developmental Studies. Research in Human Development1: 59-80.
- Alison F,Camargo C, Taylor B,Berkey C,Roberts S,et al. (2001) Peer, Parent, and Media Influences on the Development of Weight Concerns and Frequent Dieting Among Preadolescent and Adolescent Girls and Boys. Pediatrics 107: 54-60
- Spiel, Emma, Rodgers R, PaxtonS, WertheimE, DamianoS, et al. (2015)‘He's got his father's bias’: Parental influence on weight bias in young children. British Journal of Developmental Psychology34: 198–211.
- Sternberg KJ, Lamb ME, Guterman E, Abbott CB, Dawud-Noursi S (2005) Adolescents' perceptions of attachments to their mothers and fathers in families with histories of domestic violence: a longitudinal perspective. Child Abuse Negl29: 853-869.[Crossref]