Background: Systemic vasculitis such as Kawasaki Disease (KD) and collagen diseases have been suggested to be related to pollen exposure (PE).
Objective: To elucidate effects of PE on outbreaks of gastrointestinal diseases including inflammatory bowel diseases(IBDs) and associated diseases.
Methods: We analyzed national database on annual occurrence of ulcerative colitis(UC), Crohn's disease(CD), as well as primary biliary cirrhosis(PBC), fulminant hepatitis(FH), severe acute pancreatitis(SAP), interstitial pneumonia(IP), amyloidosis(AMY), idiopathic thrombocytopenic purpura and aplastic anemia.
Results: Increase in pollen scatter started during 1977-1987 in Japan, characterized by three upward peaks (1978-79, 1982, and 1984-86), with which triphasic outbreaks of KD coincided. During 1975–2014, the 1984-86 peak of pollen scatter was the earliest peak with which simultaneous increase in occurrence of UC, CD, and FH coincided. Furthermore, simultaneous outbreaks of UC, CD and FH coincided with subsequent four peaks of pollen scatter in 1997-98, 2000-03, 2008-09 and 2011. Our results showed statistically significant correlations for UC, CD, and IP between the annual number of newly registered patients in the patient-registry year and annual pollen levels in the same patient-registry year. Significant correlations were also shown between the number of newly registered patients in the patient-registry year and annual pollen levels measured 6 years (UC, CD, PBC, SAP), 9 years (UC, CD, IP), 11 years (UC, CD), 14 years (IP) and 16years (CD, PBC, SAP, AMY) before the patient-registry year.
Conclusion: We assume that cumulative effects of PE during a decade or more before the diagnosis of IBDs might possibly trigger onset of IBDs when cumulative effects of PE as environmental stress overwhelmed immunoreactive threshold.
ulcerative colitis, Crohn's disease, airborne pollen exposure, Kawasaki disease, outbreaks in 1984-86
Abbreviations
AA: Aplastic Anemia; AP: Airborne Pollen; ASID: All Specific Intractable Diseases; AMY: Amyloidosis; CD: Crohn's Disease; DTH: Delayed-Type Hypersensitivity; FH: Fulminant Hepatitis with Intractable Hepatitis; GPA: Granulomatosis with Polyangiitis; IBD: Inflammatory Bowel Disease; IP: Interstitial Pneumonia; ITP: Idiopathic Thrombocytopenic Purpura; JIDRF: Japan Intractable Diseases Research Foundation; KD: Kawasaki Disease; LST: Lymphocyte Stimulation Test; PBC: Primary Biliary Cirrhosis; PE: Pollen Exposure; PID: Pollen-Induced Diseases; RPs: Registered Patients; Sagamihara: Sagamihara City In Kanagawa Prefecture; SAP: Severe Acute Pancreatitis; SIDs: Specific Intractable Diseases; SLE: Systemic Lupus Erythematosus; TAK: Takayasu Arteritis; UC: Ulcerative Colitis.
Ulcerative colitis (UC) and Crohn's disease (CD) are major types of inflammatory bowel diseases (IBDs) [1]. This study aimed to show the trend for increase in Japanese IBD patients related to the amount of airborne pollen (AP) exposure, using an electronic database maintained by the Japan Intractable Diseases Research Foundation (JIDRF) under the Japanese Ministry of Health, Labor and Welfare's nationwide registry system [2]. We focused on those patients with UC and CD registered as “specific intractable diseases” (SIDs) by the Japanese governmental authorities. The annual number of those IBD patients has been steadily increasing. An epidemiological study was conducted to determine the characteristics of Japanese IBD patients, with focusing on their family history [3]. The epidemiological study showed that the prevalence of IBDs has been still increasing in Asia, although it has reached a plateau in Western countries. Although these studies did not focus on the etiology of IBDs, another study entitled “Environmental risk factors for IBD: an umbrella review of meta-analyses” has been recently published [4]. This study examined 183 estimates from 53 meta-analyses of 71 environmental factors related to lifestyle, hygiene, surgeries, drug exposures, diet, microorganisms, and vaccinations. This novel study on possible factors associated with IBDs showed varying levels of evidence on the relationship between different environmental factors and the risk of developing IBDs [4].
Japanese SID patients have been sequentially registered depending on the year of inclusion in the registry [2]. Presently in Japan, data of 331 SIDs have been recorded in the registry, which include 5 digestive diseases (UC, CD, primary biliary cirrhosis [PBC], fulminant hepatitis [FH] with intractable hepatitis, and severe acute pancreatitis [SAP]) which were studied in this paper, as well as other 11 SIDs, including 5 vasculitis syndromes (Takayasu arteritis [TAK] or aortitis syndrome, Behçet’s disease, Buerger’s disease or thromboangiitis obliterans, granulomatosis with polyangiitis [GPA], and periarteritis nodosa), 5 collagen diseases (systemic lupus erythematosus [SLE], rheumatoid arthritis, scleroderma, sarcoidosis, and pemphigus), and aplastic anemia (AA).
The author previously conducted an epidemiological study on Kawasaki disease (KD), a systemic vasculitis, for clarifying the relationship between weekly, monthly and annual occurrence of KD and weekly, monthly and annual amount of AP exposure. The author firstly noticed that during the decade of 1977-87, Japanese KD patients in any of all Japan, Tokyo, and Sagamihara showed triphasic outbreaks of their occurrence (1978-79, 1982, 1984-86), with the highest peak in 1982, which coincided with triphasic upward peaks of AP release [5-7]. The author had stated that KD may be a pollen-induced disease (PID) of delayed-type hypersensitivity (DTH) with suppressed onset in the epidemics of influenza, in his four previous reports published during 2003-17 [6-9].
Subsequently, the author went on to conduct an epidemiological study on another vasculitis, TAK (aortitis syndrome) [2]. The governmental authority, JIDRF reported by use of bar graphs, the change in patient numbers of TAK, so the author downloaded the bar graph and noticed transformational increase in occurrence of TAK patients in 1984 [2]. The author then analyzed the incidence of TAK by drawing the line graphs merging annual data of disease occurrence in under-described [1,2].These line graphs expressed 1) “present registered patients (present RPs)”, defined as the total patient-registry number in each fiscal year and 2) “newly registered patients (newly RPs)”, defined as the difference between the total patient-registry number in each fiscal year and that in its previous year. As a result, the author could recognize and show more easily distinguished outbreaks of 590 TAK patients, who were newly registered only in one year, 1984. Thus, the author continued to conduct the epidemiological study on other ten SIDs, for clarifying the relationship between increment of annual occurrence of 11 SIDs and annual amount of AP exposure during 1975-2014, focusing particularly the first and rapid annual occurrence around 1984-86. The author published those results in 2018 as a reference of merged line graph of annual data of KD occurrence and AP exposure from 1970 to 2016 [5].
Through these studies, we have learned the lesson that the change of patient numbers was more clearly visualized such as appearances of upward peaks by use of line graphs of “newly RPs” rather than by use of bar graphs of “present RPs” drawn by JIDRF. When we observed the change in number of patients with UC and CD in bar graphs drawn by JIDRF [1,2], we saw similar remarkable leaping increase in 1984 bar as that in bar graph of TAK [5]. The first and rapid increment of outbreaks of present RPs and newly RPs with UC and CD around 1984-86 appeared to remain unnoticed, we naturally created line graphs instead of bar graphs, for the purpose of more clearly visualizing annual newly RPs data.
The annual change in occurrence of SIDs should be analyzed by use of line graphs which merged annual data of newly RPs and AP exposure. Furthermore, the author proceeded with research on other 36 SIDs including the above 11 diseases, one after another. The author similarly noticed that outbreaks of newly RPs occurred concurrently for a large number of SIDs around 1984-86 in Japan.
The present study focused on 9 SIDs consisting of 5 digestive disorders (UC, CD, PBC, FH, and SAP), interstitial pneumonia [IP], amyloidosis [AMY], idiopathic thrombocytopenic purpura [ITP], and AA. We took notice of IP and AMY, because they are known to be often associated with UC [10,11] and CD [12,13]. The author examined the relationship between the upward peaks of AP released in the Bunkyo-ku area of Tokyo, in the whole area of Tokyo Metropolitan, and in Sagamihara City of Kanagawa Prefecture, and the increase in annual number of newly RPs during 1975-2014. The final aim of our study is to search for the risk of AP exposure to influence the occurrence of immune-related diseases such as UC, CD, PBC, IP, connective tissue diseases, and vasculitis syndrome in Japan. We hypothesized that these immune-related diseases, especially IBDs might belong to pollen-induced diseases (PIDs), or "pollen diseases", because these conditions are assumed to be triggered when susceptible patients are exposed to immunological stress.
Since 1974 in Japan, the governmental authority, JIDRF [2] has assigned its certificates to SID patients for supporting their treatment financially after their registration. The homepage (HP) of JIDRF has reported “numbers of recipient certificates issued for specific disease treatment” based on the registration beginning in 1974 or 1975, 1983, and so on until 2014. The data show the number of present RPs registered in the present fiscal year as well as the number of newly RPs, defined as increments in numbers from the previous fiscal year for all the major SIDs. The increments could be negative numbers because the number of present RPs in the present fiscal year was occasionally smaller than that in the previous fiscal year. Since KD is not included in SIDs, the number of KD patients in every calendar year was downloaded from the HP of the Department of Public Health, Jichi Medical University [14]. The authors declare that our work was performed in accordance with the ethical principles for medical research outlined in the Declaration of Helsinki 1964 and per subsequent revisions (https://www.wms.net/).
Data on AP release were provided by Dr. Yozo Saito, Dr. Hiroshi Yasueda, and Professor Norio Sahashi[6]. Dr. Saito gathered the AP data based on the research unit in the Tokyo Medical Dental University Graduate School of Medicine, Bunkyo-ku, Tokyo, and Dr. Yasueda surveyed the AP data based on the research unit in the National Hospital Organization Sagamihara National Hospital, Sagamihara, Kanagawa. The AP data in Tokyo Metropolis were collected from twelve searching sites in Tokyo and were donated by Mr. Hiroshi Kaneko. The AP data were downloaded after administrative information disclosures from the website of Tokyo Metropolitan Institute of Public Health [7,15].
In the present study, the number of nine SID patients was imported into excel tables. The ten figures of line graphs we created for a total group of all SIDs (ASIDs) (Figure 1), and for each of nine SIDs (Figure 2-10) represent annual numbers of present RPs and newly RPs, and the amount of AP scattered in 3 areas (the Bunkyo-City area of Tokyo, the whole area of Tokyo Metropolitan, and Sagamihara City). In addition, an another figure was created to show the annual number of KD patients in Tokyo, Kanagawa, and all-Japan during the period from 1975 to 2014 and pattern of AP scatter in Bunkyo-City, Tokyo, and Sagamihara during the same period (Figure 11, modified from published version) [5,9,16].
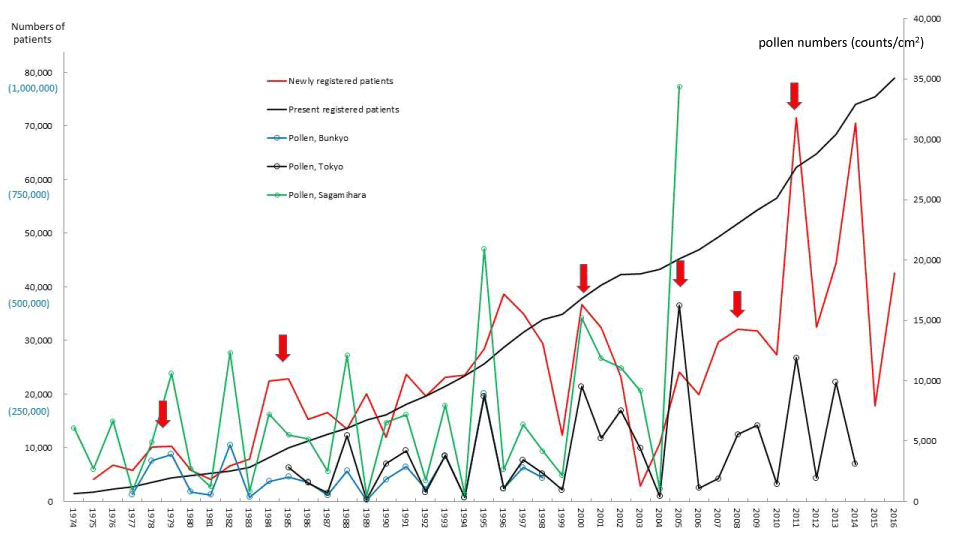
Figure 1. The line graphs for all specific intractable diseases (ASIDs) representing numbers of present registered and newly registered patients in each year, as well as the amount of pollen scattered in Bunkyo-ku, Metropolitan Tokyo and Sagamihara city during the period from 1975 to 2016. Red arrows indicate phasic increments occurring concomitantly in patients and pollen scatter. Numbers of patients are shown on left axes whose scales are black reduced numbers to newly registered patients and (blue actual numbers) to present registered patients. Pollen numbers are shown on right axes whose scales are counts/cm2.
A correlation analysis was performed for each of nine SIDs and for ASIDs between the annual number of newly RPs in each patient-registry year “x” (“x”=1975~2014), and the annual amount of AP levels in Tokyo and Sagamihara, measured in the same year as the patient-registry year “x”. The correlation analysis was also performed between the annual number of newly RPs in each patient-registry year “x” (“x”=1975~2014), and the annual amount of AP levels in both cities, measured “α” years before the patient-registry year “x”(“α”=1~20). Correlation coefficients and p values were calculated using excel function PEARSON by the method described in the brochure http://imnstir.blogspot.com/2014/04/p.htm. A statistically significant positive correlation was defined as p<0.05, and was graded into five stages (0.00001 ≤p<0.00005*****, 0.00005 ≤p<0.0005****, 0.0005 ≤p<0.005***, 0.005≤p<0.01**, 0.01 ≤p<0.05*) . The positive tendency results (0.05 ≤p<0.10♰) were also determined for reference.
Concurrent occurrence of upward peaks in line graphs for annual numbers of newly RPs, and for annual levels of AP scatter
The five line graphs in our figures for ASIDs (Figure 1), nine SIDs (Figures 2-10), and KD (Figure 11) consisted of two line graphs visualizing the annual patient-registry data for present RPs and newly RPs, and three line graphs visualizing the annual amount of AP scatter measured in the three areas. Figure 1 shows that six phasic increments in patient-registry data on newly RPs for ASIDs took place concomitantly with those in AP scatter during 1975–2014; in 1978-79, 1984-86, 2000-03, 2005, 2008-09, and 2011. Simultaneous increase in occurrence of UC, CD, and FH took place concomitantly in line graphs with five upward peaks of annual AP levels in 1984-86, 1997~98, 2000-03, 2008-09, and 2011 (Figure 2, 3, and 5; Table 1). During the four decades of 1975–2014, the upward peak of AP scatter in 1984-86 was found to be the earliest peak with which simultaneous outbreaks of multiple SIDs; ASIDs, UC, CD, FH, AMY, ITP, AA, and KD were concurrent (Figures 1-3,5,8-11; Table 1). We further found that simultaneous outbreaks of multiple SIDs; UC, CD, PBC, FH, and SAP were also concurrent with subsequent series of four upward AP peaks in 1997~98, 2000-03, 2008~09, and 2011 (Figures 2-6; Table 1). As shown in our line graphs (Figures 1-11), the amount of cedar pollen scatter in both Sagamihara city and Bunkyo-ku commonly started to increase during 1977-87 in Japan, showing three distinct peaks (1978-79, 1982, 1984-86) [5,6,9,16]. A steady increase in annual numbers of both present and newly RPs continued up to 2014, commonly for ASIDs and for UC, CD, PBC, IP, AMY, and KD (Figures 1-4,7,8, and 11) , along with a consecutive series of 13 upward AP peaks in 1978-79, 1982, 1984-86, 1988, 1990-91, 1993, 1995, 1997-98, 2000-03, 2005, 2008-09, 2011, and 2013.
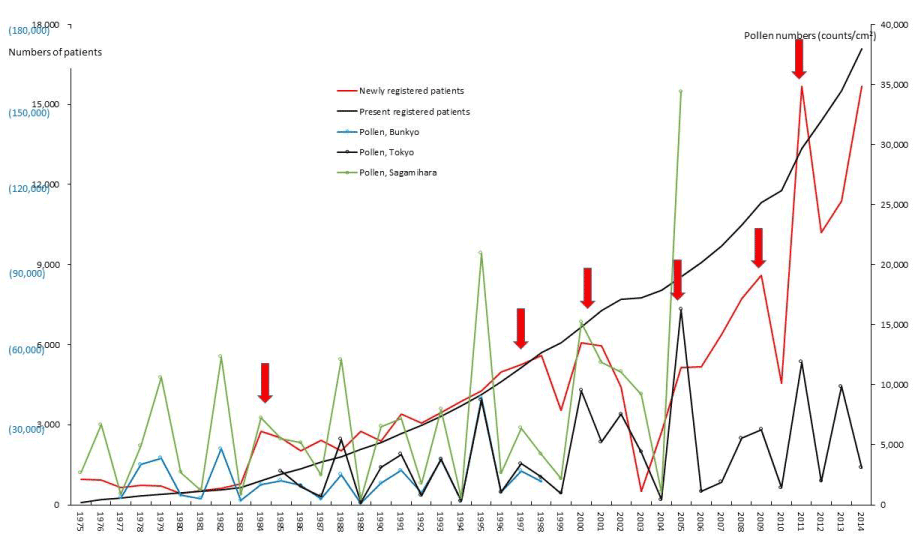
Figure 2. The line graphs for ulcerative colitis (UC) representing numbers of present registered and newly registered patients in each year, as well as the amount of pollen scattered during the period from 1975 to 2014. Red arrows indicate phasic increments occurring concomitantly in patients and pollen scatter. Numbers of patients are shown on left axes whose scales are black reduced numbers to newly registered patients and (blue actual numbers) to present registered patients. Pollen numbers are shown on right axes whose scales are counts/cm2. The remainder of the text is the same as in this sentence (Figures 3-11).
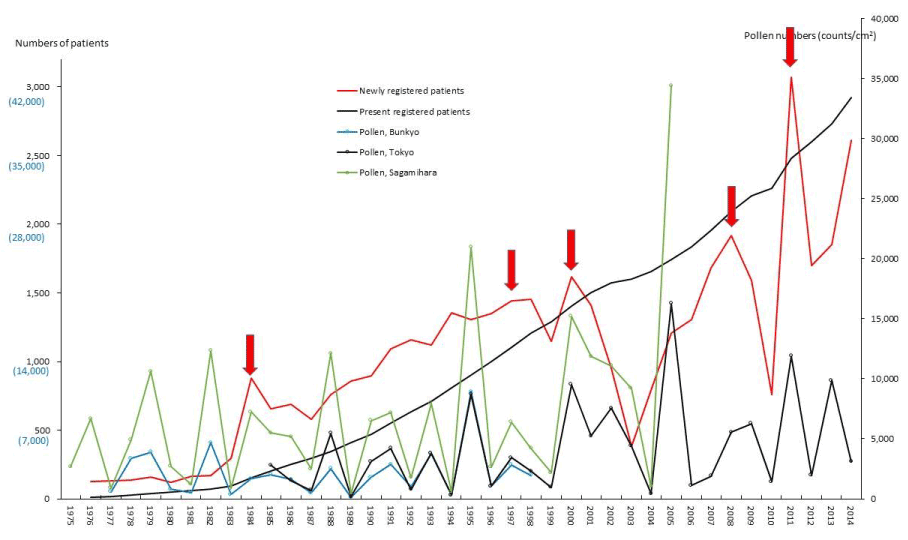
Figure 3. Numbers of patients with and scattering pollen from 1975 to 2014. The line graphs for Crohn’s disease (CD) representing numbers of present registered and newly registered patients in each year, as well as the amount of pollen scattered during the period from 1975 to 2014. Red arrows indicate phasic increments occurring concomitantly in patients and pollen scatter.
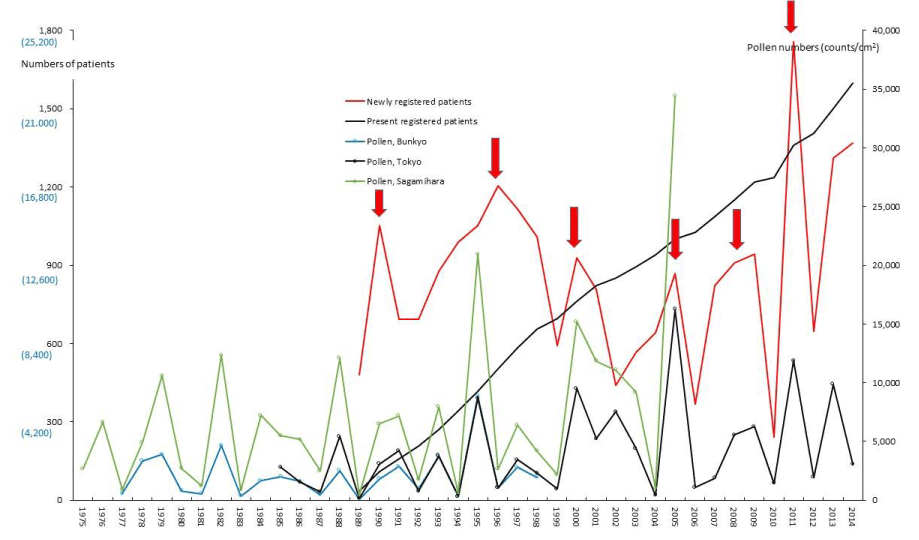
Figure 4. Numbers of patients with and scattering pollen from 1975 to 2014. The line graphs for primary biliary cirrhosis (PBC) representing numbers of present registered and newly registered patients in each year, as well as the amount of pollen scattered during the period from 1975 to 2014. Red arrows indicate phasic increments occurring concomitantly in patients and pollen scatter.
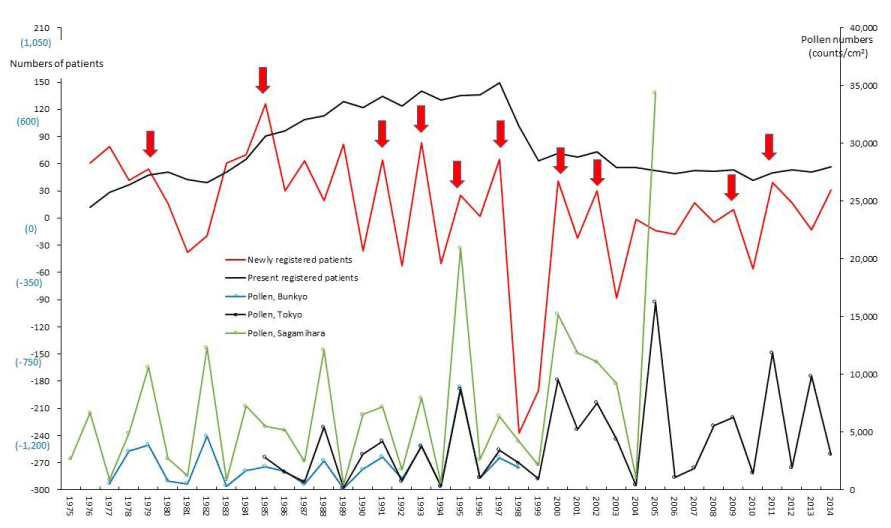
Figure 5. The line graphs for fulminant hepatitis among intractable hepatitis (FH) representing numbers of present registered and newly registered patients in each year, as well as the amount of pollen scattered during the period from 1975 to 2014. Red arrows indicate phasic increments occurring concomitantly in patients and pollen scatter.
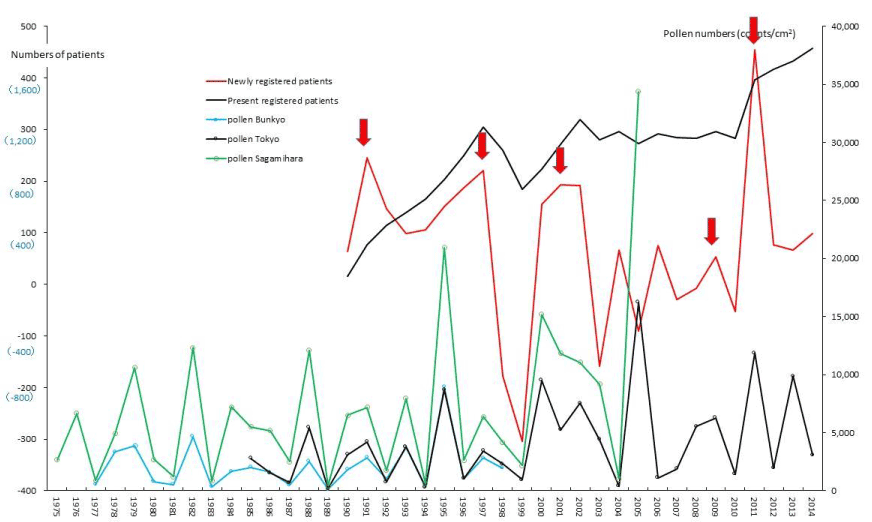
Figure 6. The line graphs for severe acute pancreatitis (SAP) representing numbers of present registered and newly registered patients in each year, as well as the amount of pollen scattered during the period from 1975 to 2014. Red arrows indicate phasic increments occurring concomitantly in patients and pollen scatter.
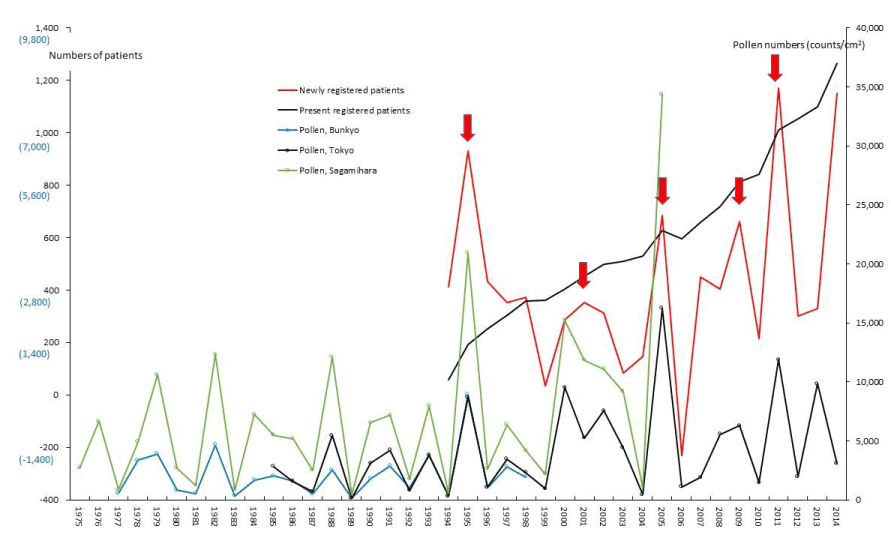
Figure 7. The line graphs for interstitial pneumonia (IP) representing numbers of present registered and newly registered patients in each year, as well as the amount of pollen scattered during the period from 1975 to 2014. Red arrows indicate phasic increments occurring concomitantly in patients and pollen scatter.
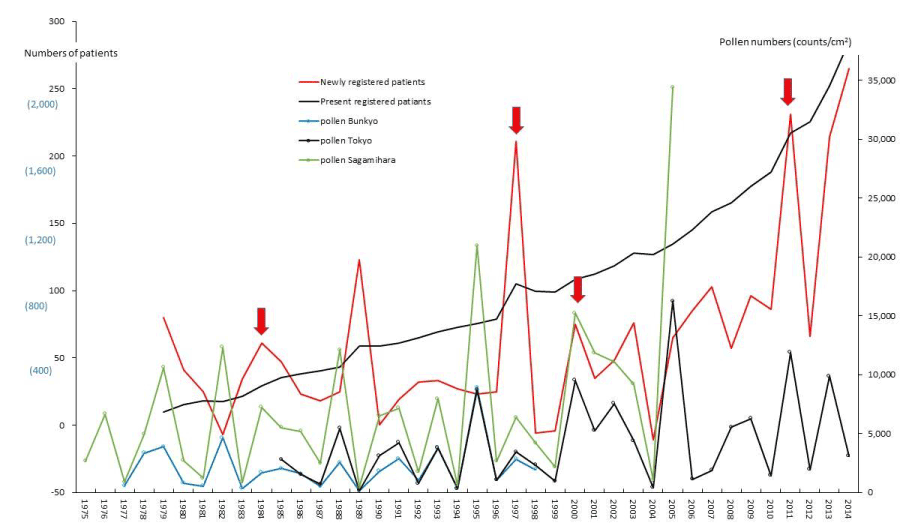
Figure 8. The line graphs for amyloidosis (AMY) representing numbers of present registered and newly registered patients in each year, as well as the amount of pollen scattered during the period from 1975 to 2014. Red arrows indicate phasic increments occurring concomitantly in patients and pollen scatter.
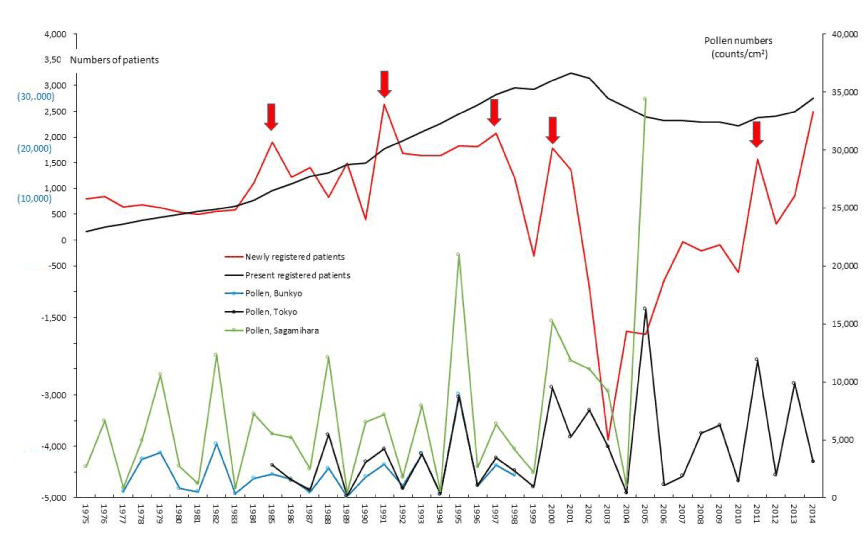
Figure 9. The line graphs for idiopathic thrombocytopenic purpura (ITP) representing numbers of present registered and newly registered patients in each year, as well as the amount of pollen scattered during the period from 1975 to 2014. Red arrows indicate phasic increments occurring concomitantly in patients and pollen scatter.
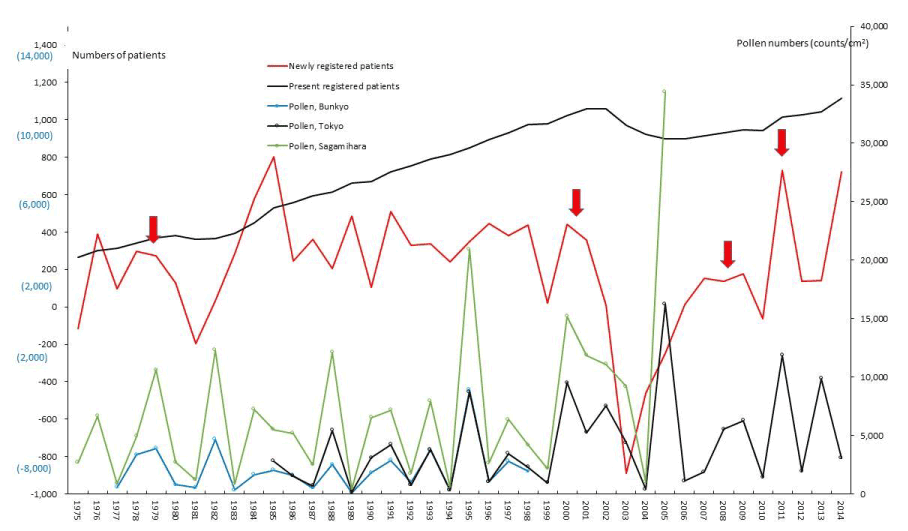
Figure 10. The line graphs for aplastic anemia (AA) representing numbers of present registered and newly registered patients in each year, as well as the amount of pollen scattered during the period from 1975 to 2014. Red arrows indicate phasic increments occurring concomitantly in patients and pollen scatter.
PBC and FH as hepatic SIDs began to be registered as SIDs since 1989 and 1976, respectively, as shown in figures 4 and 5. Phasic increments in newly RPs with these hepatic SIDs took place concomitantly with six upward AP peaks in 1990-91, 1995, 1997-98, 2000-03, 2008-09, and 2011 (Figures 4,5; Table 1). The incremental pattern in newly RPs with SAP as another gastroenterological disorder is shown in figure 6. The patient-registry for SAP started in 1990, and the increase in newly RPs with SAP was linked to five upward AP peaks in 1990-91, 1997-98, 2000-03, 2008-09, and 2011 (Table 1). Figure 7 shows the concurrent association between an increase in newly RPs with IP and an increase in AP release. Although the patient-registry for IP began late, starting from 1994, the upward peaks of IP occurrence coincided with five upward AP peaks in 1995, 2000-03, 2005, 2008-09, and 2011. Figure 8 shows a distinct peak in newly RPs with AMY in 1984-86, followed by three subsequent peaks associated with the increasing AP release in 1997-98, 2000-03, and 2011. Variations in the patient-registry number for ITP and AA as blood disorders are shown in figures 9 and 10 and were characterized by the increase in newly RPs commonly linked to three upward AP peaks in 1984-86, 2000-03 and 2011. Figure 11 is provided as a reference to show the relationship between an increase in newly RPs with KD and increase in AP release. Summarizing our data as shown in table 1, the concurrent outbreaks of SIDs associated with the increasing AP release started in 1984-86, and broke out again 12~13 years later in 1997-98, followed by three subsequent outstanding outbreaks of SIDs occurring in 2000-03, 2008-09, and 2011.
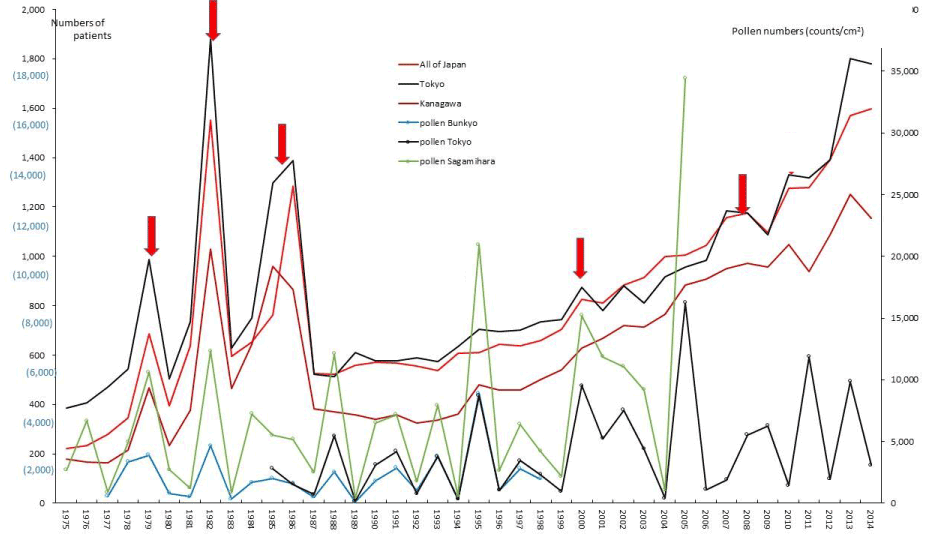
Figure 11. The line graphs for Kawasaki Disease (KD) representing numbers of patients in Tokyo, Kanagawa and all of Japan in each year, as well as the amount of pollen scattered during the period from 1975 to 2014. Red arrows indicate phasic increments occurring concomitantly in patients and pollen scatter.
Table 1. Concurrent occurrence of upward peaks in line graphs (indicated by circles) for annual numbers of newly registered patients, and for annual levels of airborne pollen scatter, for all specific intractable diseases (ASIDs), ulcerative colitis (UC), Crohn's disease (CD), primary biliary cirrhosis (PBC), fulminant hepatitis with intractable hepatitis (FH), severe acute pancreatitis (SAP), interstitial pneumonia (IP), amyloidosis (AMY), idiopathic thrombocytopenic purpura (ITP), aplastic anemia (AA), and Kawasaki’s disease (KD)
Figure. No |
1 |
2 |
3 |
4 |
5 |
6 |
7 |
8 |
9 |
10 |
11 |
Pollen peaks |
ASIDs |
UC |
CD |
PBC |
FH |
SAP |
IP |
AMY |
ITP |
AA |
KD |
1978~79 |
〇 |
|
|
|
〇 |
|
|
|
|
〇 |
〇 |
1982 |
|
|
|
|
|
|
|
|
|
|
〇 |
1984~86 |
〇 |
〇 |
〇 |
|
〇 |
|
|
〇 |
〇 |
〇 |
〇 |
1988 |
|
|
|
|
|
|
|
|
|
|
|
1990~91 |
|
|
|
〇 |
〇 |
〇 |
|
|
〇 |
|
|
1993 |
|
|
|
|
〇 |
|
|
|
|
|
|
1995 |
|
|
|
〇 |
〇 |
|
〇 |
|
|
|
|
1997~98 |
|
〇 |
〇 |
〇 |
〇 |
〇 |
|
〇 |
〇 |
|
|
2000~03 |
〇 |
〇 |
〇 |
〇 |
〇 |
〇 |
〇 |
〇 |
〇 |
〇 |
〇 |
2005 |
〇 |
〇 |
|
〇 |
|
|
〇 |
|
|
|
|
2008~09 |
〇 |
〇 |
〇 |
〇 |
〇 |
〇 |
〇 |
|
|
|
〇 |
2011 |
〇 |
〇 |
〇 |
〇 |
〇 |
〇 |
〇 |
〇 |
〇 |
〇 |
|
Statistical relations of newly RPs in each patient-registry year with AP levels measured in the same year as and before the patient-registry year
The author examined the statistical correlation for nine SIDs and for ASIDs, between the annual number of the newly RPs in each patient-registry year “x” (“x”=1975~2014) and annual AP levels in Tokyo and Sagamihara, measured in the same year as the patient-registry year “x”, as well as measured “α”years before the patient-registry year “x”(“α”=1~20). A statistically significant positive correlation was graded into five stages and positive tendency results were also shown for reference (Table 2). Our results showed statistically significant correlations for UC, CD, IP, and ASIDs between the number of newly RPs in the patient-registry year “x” and the amount of AP exposure measured in Tokyo in the same patient-registry year “x”. Similarly, significant correlations were shown for UC and IP between the newly RPs in the patient-registry year “x” and the AP exposure measured in Sagamihara, in the same patient-registry year “x”.
Table 2. A correlation analysis between the annual number of newly registered patients in each patient-registry year“x” (“x”=1975~2014), and the annual amount of airborne pollen levels in Tokyo (T) and Sagamihara (S), measured in the same year as the patient-registry year“x”, and measured “α” years before the patient-registry year“x”(“α”=1~20) , for all specific intractable diseases (ASIDs), ulcerative colitis (UC), Crohn's disease (CD), primary biliary cirrhosis (PBC), fulminant hepatitis with intractable hepatitis (FH), severe acute pancreatitis (SAP), interstitial pneumonia (IP), amyloidosis (AMY), idiopathic thrombocytopenic purpura (ITP), and aplastic anemia (AA).
α |
|
ASIDs |
UC |
CD |
PBC |
FH |
SAP |
IP |
AMY |
ITP |
AA |
0
|
T |
0.044* |
0.038* |
0.040* |
0.057♰ |
ns |
ns |
0.026* |
ns |
ns |
ns |
S |
ns(0.103) |
0.041* |
ns(0.159) |
ns(0.825) |
ns |
ns |
0.024* |
ns |
ns |
ns |
1
|
T |
ns |
ns |
ns |
ns |
ns |
ns |
ns |
ns |
ns |
ns |
S |
ns |
ns |
ns |
ns |
ns |
ns |
ns |
ns |
ns |
ns |
2
|
T |
ns |
ns |
ns |
ns |
ns |
ns |
ns |
ns |
ns |
ns |
S |
ns |
ns |
ns |
ns |
ns |
ns |
ns |
ns |
ns |
ns |
3
|
T |
ns |
ns(0.116) |
ns |
ns |
ns |
ns |
ns |
ns |
ns |
ns |
S |
ns |
0.067♰ |
ns |
ns |
ns |
ns |
ns |
ns |
ns |
ns |
4
|
T |
ns |
ns(0.750) |
ns |
ns |
ns |
ns |
ns |
ns |
ns |
ns |
S |
ns |
0.080♰ |
ns |
ns |
ns |
ns |
ns |
ns |
ns |
ns |
5
|
T |
ns(0.326) |
ns |
ns |
ns |
ns |
ns |
ns |
ns |
ns |
ns |
S |
0.067♰ |
ns |
ns |
ns |
ns |
ns |
ns |
ns |
ns |
ns |
6
|
T |
0.044* |
0.015* |
0.001*** |
0.053♰ |
ns |
0.056♰ |
ns |
0.050♰ |
ns |
ns |
S |
0.0008*** |
0.00004***** |
0.0001**** |
0.026* |
ns |
0.039* |
ns |
0.093♰ |
ns |
ns |
7
|
T |
ns |
0.060♰ |
ns |
ns |
ns |
ns |
ns |
ns |
ns |
ns |
S |
ns |
0.090♰ |
ns |
ns |
ns |
ns |
ns |
ns |
ns |
ns |
8
|
T |
ns |
ns(0.557) |
ns |
ns |
ns |
ns |
ns |
ns |
ns |
ns |
S |
ns |
ns(0.101) |
ns |
ns |
ns |
ns |
ns |
ns |
ns |
ns |
9
|
T |
0.020* |
0.012* |
0.056♰ |
ns |
ns(0.104) |
ns |
0.047* |
ns |
ns |
ns |
S |
0.011* |
0.008** |
0.049* |
ns |
ns |
ns |
0.083♰ |
ns |
ns |
ns |
10
|
T |
ns |
ns |
ns |
ns |
ns |
ns |
ns |
ns |
ns |
ns |
S |
ns |
ns |
ns |
ns |
ns |
ns |
ns |
ns |
ns |
ns |
11
|
T |
0.093♰ |
0.021* |
0.037* |
ns |
ns |
0.095♰ |
ns |
ns |
ns |
ns |
S |
0.077♰ |
0.033* |
0.059♰ |
ns |
ns |
ns(0.377) |
ns |
ns |
ns |
ns |
12
|
T |
ns |
ns |
ns |
ns |
ns |
ns |
ns |
ns |
ns |
ns |
S |
ns |
ns |
ns |
ns |
ns |
ns |
ns |
ns |
ns |
ns |
13
|
T |
ns |
ns |
ns |
ns |
ns |
ns |
ns |
ns |
ns |
ns |
S |
ns |
ns |
ns |
ns |
ns |
ns |
ns |
ns |
ns |
ns |
14
|
T |
ns |
0.096♰ |
ns |
ns |
ns |
ns |
0.007** |
ns |
ns |
ns |
S |
ns |
ns(0.123) |
ns |
ns |
ns |
ns |
0.073♰ |
ns |
ns |
ns |
15
|
T |
ns |
ns |
ns |
ns |
ns |
ns |
ns |
ns |
ns |
ns |
S |
ns |
ns |
ns |
ns |
ns |
ns |
ns |
ns |
ns |
ns |
16
|
T |
0.073♰ |
ns(0.117) |
0.048* |
0.025* |
0.069♰ |
0.003*** |
ns(0.200) |
0.044* |
ns |
ns |
S |
0.033* |
0.069♰ |
0.022* |
0.017* |
ns |
0.044* |
0.066♰ |
0.017* |
ns |
ns |
17
|
T |
ns |
ns |
ns |
ns |
ns |
ns |
ns |
ns |
ns |
ns |
S |
ns |
ns |
ns |
ns |
ns |
ns |
ns |
ns |
ns |
ns |
18
|
T |
ns |
ns |
ns |
ns |
ns |
ns |
ns |
ns(0.100) |
ns |
ns |
S |
ns |
ns |
ns |
ns |
ns |
ns |
ns |
ns(0.319) |
ns |
ns |
19
|
T |
ns |
ns |
ns |
ns |
ns |
ns |
ns |
ns |
ns |
ns |
S |
ns |
ns |
ns |
ns |
ns |
ns |
ns |
ns |
ns |
ns |
20
|
T |
ns |
ns |
ns |
ns |
ns |
ns |
ns |
ns |
ns |
ns |
S |
ns |
ns |
ns |
ns |
ns |
ns |
ns |
ns |
ns |
ns |
ns; not significant; 0.00001≤p<0.00005*****, 0.00005≤p<0.0005****, 0.0005≤p<0.005***, 0.005≤p<0.01**, 0.01≤p<0.05*, 0.05≤p<0.10♰
We also found significant correlations for a variety of SIDs between the newly RPs in the patient-registry year “x” and the AP exposure measured in Tokyo,“α”years before the patient-registry year “x” (ASID,“α”=6 and 9; UC,“α”=6, 9, and 11; CD,“α”=6, 11, and 16; IP,“α”=9 and 14; PBC, SAP, and AMY,“α”=16). Similarly, significant correlations were shown for a variety of SIDs between the newly RPs in the patient-registry year “x” and the AP exposure measured in Sagamihara,“α”years before the patient-registry year “x” (ASID and CD,“α”=6, 9, and 16; UC,“α”=6, 9, and 11; PBC and SAP,“α”=6 and 16; AMY,“α”=16).
The earliest outbreaks of multiple SIDs in 1984-86, associated with the increasing AP release
During the decade of 1977-87 when Japanese pollen release began to increase rapidly, KD in any of Tokyo, Kanagawa, and all-Japan showed outstanding outbreaks of triphasic appearance (1978-79, 1982, 1984-86), which clearly coincided with triphasic peaks of AP release in Japan, while a large number of immune-mediated SIDs, such as TAK, UC, CD, and ITP showed monophasic outbreaks associated with the increasing AP release in 1984-86. This epidemiological phenomenon might not sound like the truth for those who knew such a strange fact for the first time but can be explained by the Japanese history of forestry, as described below. Japanese cedar trees were rapidly cut on a large scale in the 1940s-50s, because of military and industrial needs during and after the World War II. Therefore, Japanese government strongly promoted a national forestation project in the 1950s-60s, and cedar trees were widely and rapidly planted in the entire Japanese land. In the 1970s-80s, namely 20 years after the period of cedar afforestation, the Japanese cedar trees gradually reached an age at which they have a high pollen producing capacity. Furthermore, cedar trees in Japan have been rarely cut since the 1990s, because of both increase in imported trees and decrease in demand for trees. Therefore, the Japanese cedar trees then have acquired even stronger pollen producing capacity. That is the background reason for the fact that cedar pollen release in Japan started to increase rapidly around the period of 1978-79 and continued to increase until 1986 with the highest peak in 1982 [5,6,9].
Our present study confirmed that during the four decades of 1975–2014, the upward pollen peak in 1984-86 was the earliest peak with which concurrent outbreaks of a large number of immune-mediated diseases, such as TAK, UC, CD, FH, and ITP broke out simultaneously. Compared with the outbreaks in these non-infantile diseases, only KD as an infantile disease showed peculiar outbreaks, characterized by outstanding peaks of triphasic appearance (1978-79, 1982, 1984-86), which clearly coincided with triphasic peaks of AP release. We had successfully analyzed the effects of cumulative pollen exposure to 6,000 individuals in Kanagawa with a potential risk of developing KD from 1991 to 2002 using an exponential function of the statistics [8]. We propose the assumption that such peculiar outbreaks of triphasic appearance seen only in KD might have been caused by the cumulative effects of AP exposure during immunological maturation of young infants under the age of 4-5 years old, which led to the development of KD [8].
In those SIDs where the patient-registry had already started before the 1980s, the earliest incremental outbreaks in the 1984-86 period were classified into the following three patterns; occurrence of the main peak in 1984 (pattern A), in 1985 (pattern B), and in 1986 (pattern C), respectively. The author previously studied five vasculitis syndromes, five connective tissue disorders, and AA [5], which included TAK, Behçet’s disease, Buerger’s disease, SLE, scleroderma, sarcoidosis and GPA. The earliest incremental outbreaks in the 1984-86 period were characterized by the pattern A in UC, CD, AMY, TKA, Behçet’s disease, Buerger’s disease, SLE, scleroderma, sarcoidosis, and GPA, by the pattern B in FH, ITP, AA and rheumatoid vasculitis, and by the pattern C in pemphigus, respectively. Periarteritis nodosa showed biphasic outbreaks in 1982 and 1985. ASIDs showed the earliest incremental peak in 1978-79 and the second incremental peak in 1984-86, as shown in figure 1. In PBC, SAP, and IP, where the patient-registry had started in the 1990s, the earliest outbreaks of newly RPs occurred in 1990-91, 1990-91, and 1995, respectively. In these three diseases, earlier incremental peaks may have been detected around the 1984-86 period, if the registration had begun earlier than the 1990s.
Later outbreaks of multiple SIDs associated with the increasing AP release in 1997~98, 2000-03, 2008-09, and 2011
The simultaneous outbreaks of a large number of immune-mediated diseases associated with the increasing AP outbreaks started in 1984-86 and broke out again 12~13 years later in 1997-98, followed by three outstanding outbreaks of immune-mediated diseases occurring in 2000-03, 2008-09, and 2011. Such later outbreaks of multiple SIDs associated with the increasing AP release are compatible with our observations that a steady increase in annual numbers of both present and newly RPs continued up to 2014, commonly for immune-mediated diseases, such as UC, CD, PBC, IP, and KD. We hypothesize that a consecutive series of 13 upward AP peaks in 1978-79, 1982, 1984-86, 1988, 1990-91, 1993, 1995, 1997-98, 2000-03, 2005, 2008-09, 2011, and 2013 produced the cumulative effects of pollen exposure which might trigger the immune-mediated diseases when those cumulative effects overwhelmed the immune-reactive threshold for their onset.
Statistical relations of newly RPs in each patient-registry year with AP levels measured in the same year as the patient-registry year
We examined the relationship between the increments in the number of newly RPs with each disease and the amount of AP released in Tokyo and Sagamihara in the same year as the patient-registry year. Our results showed that the development of UC, CD, IP, and ASIDs commonly demonstrated a significant relationship with AP release in the same year as the patient-registry year. In 2014, the patient numbers for UC, CD, and ASIDs were 133,543, 34,721, and 925,646, respectively; therefore, IBDs accounted for 18.2 % of summated patient numbers of ASIDs. Though the epidemiological correlation between the incidence of IBDs and AP levels has never been previously reported,1) we now have sufficient evidence to indicate a significant association between the occurrence of IBDs as the representative immune-mediated SIDs and the amount of AP exposure during 1975–2014.
Statistical relations of newly RPs in each patient-registry year with AP levels measured before the patient-registry year
The increments of newly RPs with UC, CD, PBC, SAP, and ASIDs were significantly correlated with AP exposed 6 years before the patient-registry year. The development of UC, CD, IP, and ASIDs was significantly correlated with AP exposed 9 years before the patient-registry year. The development of UC and CD was significantly correlated with AP exposed 11 years before the patient-registry year. The development of IP was significantly correlated with AP exposed 14 years before the patient-registry year. Finally, the development of CD, PBC, SAP, AMY, and ASIDs was significantly correlated with AP exposed 16 years before the patient-registry year. Therefore, the author hypothesized that the cumulative effects of pollen exposed 1-10 years or more before patient-registry might have triggered the onset of immune-mediated diseases, such as UC and CD and then developed these immune-mediated diseases when the cumulative effects of pollen exposure overwhelmed the immunoreactive threshold for each patient.
The limits of our study, and other issues
Now we want to discuss the way how to go beyond the limits of our study, which is neither human clinical trials nor in vivo animal experiments. All the data information used in the present study are derived from the source in public domain or from the results of our previous studies which have already been published. In order to carry out an epidemiological study, it is desirable that more reliable data should be collected in the future, such as real numbers of newly RPs based just on the date of diagnosis from medical records written by the attending physicians, especially for the data on increments in patient numbers from the previous year. Additionally, if the data on AP release from 2006 to the present are available by a kind donation from the National Hospital Organization Sagamihara National Hospital, more accurate correlation analysis would be possible.
Human diseases may be potentially triggered by the various effects of natural environmental factors, so it is worthwhile to make efforts of recording monthly data besides annual data of patient numbers. Data on the number of patients with pollen-related disorders from January to March include those in the peak season for Japanese cedar pollen release (mid-February to March end). So, the new patient-registry system from January to December entry based on a calendar year might be preferable to the present patient-registry system from April to March entry based on a fiscal year.In the present system, the patient-registry from January to March entry in the calendar year of “X” is regarded as the patient-registry in the fiscal year of “X-1”. The new calendar year system where the patient-registry in January~March of the calendar year of “X” is regarded as the registry in the same year “X” may improve the way in which the pollen-related disorders are searched for.
It would be very important to analyze in future the relationship between the onset of various SIDs and allergic rhinitis/conjunctivitis (pollinosis) triggered by AP exposure in a large cohort study. Antigenic AP substances enter the human body through the nose, eyes, and skin and are processed by immunologically competent cells in the mucosal organs. The immunological signals are transferred as immune-mediated stress information from the mucosal organs via immune pathways to the hypothalamic median eminence rich of histaminergic mast cells, which is the brain center controlling immunological homeostasis. The problems that remain to be solved are questions for antigen recognition mechanisms involved in triggering the systemic inflammatory conditions induced by pollen exposure in patients with immune-mediated SIDs. A previous study reported that corneal involvement in patients with systemic inflammatory disorders may be sight-threatening and associated with a life-threatening disease [17].
Generation of type I hypersensitivity reactions, such as allergic rhinitis, as well as generation of type IV hypersensitivity reactions [18], such as KD [7-9] or intractable diseases [5], may be interfering with each other. Clinical observation of symptomatic immune responses and laboratory tests, as well as research data on animal models, are currently the most important issues. As we previously suggested on KD [7-9], TAK and other vasculitis syndromes, and collagen diseases [5], it is essential to devise experimental systems so that pollen exposure or pollen immunization in animals can cause vasculitis, such as KD and TAK, and other autoimmune diseases previously studied [5] and investigated in the present study. Furthermore, in order to verify that these autoimmune diseases are commonly triggered by pollen exposure, we will need an experimental study on blastoid transformation of lymphocytes sensitized to specific antigenic constituents of pollens, such as Cryj1 and Cryj [2,19] in SID patients. A lymphocyte stimulation test [20,21] should be performed chronologically in the acute phase or early in the course of the disease and during remission or recurrence.
In conclusion, it should be recommended to avoid pollen exposure for preventing the aggravation of symptoms or recurrences, and concurrence of other diseases. It is necessary to take the precaution of wearing safety masks and goggles from the early postnatal period and of installing air cleaners, and to avoid the first onset of intractable diseases, particularly in the young infant individuals, having a potential risk of developing immune-mediated diseases, such as KD [22].
Akira Awaya deeply appreciates Mr. Koichi Iwata for his elaborate and diligent graphing work and correlation analysis.
The authors declare no conflict of interest in the preparation of this article. The authors have never had an opportunity of receiving any research fund in relation to this research.
- Fujii T, Watanabe M (2017) Definition and epidemiology of inflammatory bowel disease. Nihon Rinsho 75: 357-363. (Japanese)
- Number of holders of specific disease medical certificate holders. The data downloaded from http://www.nanbyou.or.jp/entry/1356 in http://www.nanbyou.or.jp/entry/141. [Japanese].
- Asakura K, Nishiwaki Y, Inoue N, Hibi T, Watanabe M, et al. (2009) Prevalence of ulcerative colitis and Crohn's disease in Japan. J Gastroenterol 44: 659-65. [Crossref]
- Piovani D, Danese S, Peyrin-Biroulet L, Nikolopoulos GK, Lytras T, et al. (2019) Environmental risk factors for inflammatory bowel diseases: an umbrella review of meta-analyses. Gastroenterology 157. 647-659. [Crossref]
- Akira A (2018) Development of many so-called autoimmune diseases including various vasculitis syndromes may be commonly triggered by pollen exposure. Jacobs Journal of Allergy and Immunology 5: 26
- Awaya A, Sahashi N (2004) The etiology of Kawasaki disease: Does intense release of pollen induce pollinosis in constitutionally allergic adults, while constitutionally allergic infants develop Kawasaki disease? Biomed Pharmacother 58: 136-140. [Crossref]
- Awaya A (2016) Suppressive influence of seasonal influenza epidemic on Kawasaki disease onset. Nihon Rinsho Meneki Gakkai Kaishi 39: 528-537. [Crossref]
- Awaya A, Murayama K (2012) Positive correlation between Japanese cedar pollen numbers and the development of Kawasaki Disease. Open Allergy J 5: 1-10.
- Awaya A, Nishimura C (2014) A combination of cross correlation and trend analyses reveals that Kawasaki disease is a pollen-induced delayed-type hyper-sensitivity disease. Int J Environ Res Public Health 11: 2628-2641.
- Baron FA, Hermanne JP, Dowlati A, Weber T, Thiry A, et al. (1998) Bronchiolitis obliterans organizing pneumonia and ulcerative colitis after allogeneic bone marrow transplantation. Bone Marrow Transplant 21:951-954. [Crossref]
- Sattianayagam PT, Gillmore JD, Pinney JH, Gibbs SD, Wechalekar AD, et al. (2013) Inflammatory bowel disease and systemic AA amyloidosis. Dig Dis Sci 58: 1689-1697. [Crossref]
- Casey MB, Tazelaar HD, Myers JL, Hunninghake GW, Kakar S, et al. (2003) Noninfectious lung pathology in patients with Crohn's disease. Am J Surg Pathol 27: 213-219. [Crossref]
- Sharma P, Aguilar R, Siddiqui OA, Nader MA (2017) Secondary systemic amyloidosis in inflammatory bowel disease: a nationwide analysis. Ann Gastroenterol 30: 504-511. [Crossref]
- The data downloaded from www.jichi.ac.jp/dph/kawasakibyou/20150924/mcls23report1013.pdf.
- Observation Data on Release of Japanese Cedar Pollens and Japanese Cypress Pollens in Tokyo in Pollen Information by Tokyo Metropolitan Institute of Public Health. Available from: http://www.fukushihoken.metro.tokyo.jp/kanho/kafun/data/index.html.
- Awaya A (2017) Pollen-Induced Diseases No.9; Prevention of Kawasaki disease by pollen evasion life: Decrease of recurrence cases and family cases are criteria. THE YAKUJI NIPPO (Pharmaceutical News) No.11922. (Japanese)
- Gomes BA, Santhiago MR, Jorge PA, Kara-José N, Moraes HV Jr, et al. (2015) Corneal involvement in systemic inflammatory diseases. Eye Contact Lens 41: 141-144.
- Rajan TV (2003) The Gell-Coombs classification of hypersensitivity reactions: a re-interpretation. Trends Immunol 24: 376-379. [Crossref]
- Sugimura K, Hashiguchi S, Takahashi Y, Hino K, Taniguchi Y, et al. (1996) Th1/Th2 response profiles to the major allergens Cry j 1 and Cry j 2 of Japanese cedar pollen. Allergy 51: 732-740. [Crossref]
- Awaya A, Sugane K, Yamauchi J, Kimura M (1975) Stimulation of lymphocytes of patients administered with a trypsin inhibitor, Trasylol (basic pancreatic trypsin inhibitor pharmaceutical), in vitro with BPTI and other several stimulants. Jpn J Exp Med 45: 541-549. [Crossref]
- Awaya A, Takeuchi T, Saito T, et al. (1979) Studies on a patient whose lymphocytes were stimulated in vitro with aprotinin in spite of having no history of therapy with aprotinin preparation. Rinshomeneki 10:1093-1100. (Japanese)
- Awaya A (2015) Pollen-Induced Diseases No.7; New strategy for prevention by avoiding measures against pollen exposure and therapy of Kawasaki disease: Proposal for KD prevention by influenza vaccine and KD therapy by IFN-ß. THE YAKUJI NIPPO (Pharmaceutical News) No.11566. (Japanese).


